
Harry S. Dent Jr.'s Blog, page 176
November 5, 2014
Slick Commodity Cycle for Oil
In the 1980s, Saudi Arabia had a problem. Energy demand was sluggish and the kingdom had just brought a lot of supply on line by opening new fields. The combination led to falling energy prices, which meant less money for the country.
In response, Saudi Arabia cut output, hoping the drop in supply would send prices higher.
The only problem was that other oil producing nations didn’t toe the line. Instead, they kept pumping which meant that these other producers were effectively taking market share from the Saudis even as prices remained low, which is like losing twice.
This time around, the Saudis aren’t taking the bait.
This Isn’t AltruismThe country did cut monthly oil production by about 5% in August, and just a touch more in September, but they’ve not made dramatic shifts in output.
As energy prices keep falling in the face of rising supply and sluggish world demand, the Saudis appear to be comfortable with the current pricing of energy through the rest of the year. They even lowered the price of oil to the U.S. recently.
There is no question the country will lose revenue due to lower prices, but they aren’t willing to risk losing market share, which is much harder to regain.
All of this is great news to consumers and businesses, who have engaged in the biggest wealth transfer in the history of the world as they bought oil from the Middle East. Falling prices, particularly near the holidays in Western nations and as winter approaches in the Northern Hemisphere, are a welcome relief to budgets large and small.
But chances are that the Saudis are not allowing the price of oil to drop out of altruism. Instead, they are probably hoping to be the last man standing on two different fronts, by squeezing countries that need more revenue to balance their budgets, and rendering high-priced energy production unprofitable.
Balancing PricesMany of the large Middle Eastern and African members of the Organization of Petroleum Exporting Countries (OPEC) need oil above $90 per barrel to balance their budgets. This includes Saudi Arabia, but that country has wealth it can draw on and a very strong relationship with the U.S.
Other countries aren’t well situated to keep taking losses on their main export, including Iran. While Saudi Arabia needs the price of oil to remain at $90 per barrel or above, the Iranians need the price of oil to reach $140 before their budget is balanced.
Watching prices go the other way has to be painful for Iran, which is probably very satisfying to Saudi Arabia since the two countries are long-time adversaries. Saudi Arabia is Arabian and mostly Sunni, whereas Iran is Persian and mostly Shiite.
This leads to proxy battles in places like Lebanon and Iraq, as well as fights in business.
At the same time that Saudi Arabia is causing pain for its old foe Iran, the country is also putting pressure on competitors that have high production prices, like the upstart fracking industry in the U.S. and tar sands producers in Canada.
While traditional barrels of oil from the shallow waters of the Gulf of Mexico or the Permian Basin in Texas cost much less than $90 per barrel to produce, break even for many of the newer producers is reportedly between $75 and $80.
Low Prices Weigh More Than JobsIf prices drop much below $80, it’s possible that many of the new oil producers will have to cut back production dramatically because the operations will be unprofitable.
This suits the Saudis just fine, since it means less competition in the future. Even if (or when) prices go back up, it takes time to ramp up oil production, transport, refining, etc., so the Saudis will have gained an advantage.
While Americans will be thrilled with cheaper gas and heating oil, any drop in energy production will hurt the economy through the jobs market. If the employment gains in Texas since the financial crisis are taken out of the equation, then employment levels in the U.S. are still below what we had in 2008.
Is cheaper gas worth a loss of jobs? That’s a really good question that unfortunately doesn’t have an easy answer.

Rodney
Ahead of the Curve with Adam O’Dell Oil Prices Still A Falling Knife

November 4, 2014
Critical Mass for San Fran Housing Market
The website, zerohedge.com, recently reported on an interesting indicator that makes perfect sense, but it’s one that I hadn’t seen before.
They reported that the San Francisco Case-Shiller year-over-year home price index is the primary real estate market that foreshadows when the stock market or any other major bubble will crash. In other words, it’s the bubble that best forecasts other bubbles bursting.
The reason that San Francisco is unique is that it’s very bubbly from a very limited supply… it reflects both Silicon Valley and the tech bubble… and it also reflects the “mega” bubble that is China.
The Chinese dump a lot of money into the San Francisco area and when they stop it’s a sign that something is wrong…
Trouble on the HorizonThe earliest sign of trouble is when the year-over-year price increases initially rise above 20%. That can’t be sustained for long even in such a hot market.
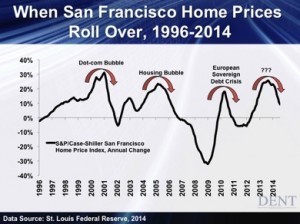
Note how this index led the dot-com bubble crash and the tech wreck. It was down from early 2000 into mid- to late 2001. The Nasdaq crashed 79% from March 2000 to October 2002. This was the highest bubble in San Francisco reaching 31% before caving with the biggest stock bubble burst of our lifetime to follow.
After dropping to a low of -7%, the next rise took home prices there to a high of +24% in early 2005, just before the housing bubble peaked the following year. Since that was a real estate crash in essence, San Francisco saw one of the worst declines year-over-year, dropping a staggering -33% just from late 2007 to late 2008.
Overall real estate crashed 34% from top to bottom and that number is even greater than those from the Great Depression. Stocks crashed nearly 55% from late 2007 into early 2009.
The next round of rising home price gains in San Francisco were more limited as it was a short response to the first and most massive Fed stimulus (QE1). That advance peaked at +19% gains and was quickly countered by the sovereign debt crisis in Europe.
The index fell to -6% in late 2012 and stocks in the U.S. had their only major correction of the 2009 to 2014 bull market, down 20% into late 2011.
A Peak is ComingThis latest bubble in San Francisco has been one of the largest in the U.S. since 2012 and has taken annual gains that reached a high of +26% in early 2013. Since then the index has fallen to +9%… a dramatic swing of 17 percentage points.
That would strongly suggest that this index has already peaked indicating that the next crash in stocks and the economy and real estate is going to come sooner rather than later.
A further confirmation will come when this index becomes negative which seems likely to occur in the next one or two quarters. By then the stock bubble should already be bursting.
Since I expect both a real estate and a stock crash greater than the last financial crisis, I wouldn’t be surprised to see San Francisco hit the -40%+ range sometime in the next few years and stocks down 65% or more from the top.
The lower this index falls, the more worried we’ll become… and so should you.
We’ve been warning that Germany would disappoint in 2014 due to falling demographic trends there. And it keeps doing so. The China bubble keeps showing further signs of beginning to burst. And when it does… watch out.
I saw a recent new index that forecasts China’s growth rate will slow to 4% to 5% in the next year. Almost no one was expecting that!
We’re also warning that the still strong affluent sector will slow in spending beginning in 2015, as will auto sales that are the last major durable goods sector to peak late this year due to the spending peak at age 53 for the massive baby-boom generation.
And the Fed has finally tapered to zero just in time for worsening fundamental trends ahead.
The only question now would be… when will the deaf, dumb, blind and delusional stock markets figure this out?
You should be ahead of them and selling on any rallies or slight new highs.
I keep warning that it’s better to be safe than sorry as bubbles burst rapidly when they finally do.
Now you see it… now you don’t. It’ll likely be that quick.

Harry
Bull Market Giving It a Run for the Money
Last year, stocks prices peaked on September 18 and then fell nearly 5% over the next three weeks.
On October 10, a “kickstarter” signal showed a wave of bullish buying activity. And by year-end, stocks were 9% above mid-October lows.
This year… the magnitude of the market’s moves is larger than last year’s, but the seasonality is roughly the same. Stocks peaked on September 19 this year and fell nearly 10% over four weeks into October 15.
And while the market’s long-term prospects are clearly in question, I observed two “kickstarter” signals recently — on October 21 and 28 — that suggest the bulls are making a strong push and may succeed in spurring gains into year-end.
Here’s a snippet of the note I sent to Cycle 9 Alert subscribers on October 21, alerting them to the “kickstarter” signal that hit my radar and its implications:
The idea is simple: When the number of bullish (advancing) stocks greatly outweighs the number of bearish (declining) stocks on a given day, it’s a reliable signal that bullish sentiment is dominant and a two- to three-month rally is likely to begin.
…today’s market action is triggering a kickstarter signal — four stocks are advancing for every one stock that’s declining.
But today’s kickstarter signal looks a bit different than the two others I’ve seen this year.
Today’s signal is coming a few days after a climax of heavy selling. In contrast, the kickstarter signals in March and July appeared at the end of stock price rallies.
And the signal is more potent when it appears after a sell-off.
Last year’s mid-October wave of “kickstarter” bullish buying came on the heels of a sell-off and spurred a 9% rally into year-end.
I don’t expect to see the market move 9% higher by the end of 2014 but seeing a kickstarter signal after the wave of selling is a positive sign that suggests the bulls haven’t given up control just yet.

Adam
Japan and the Global Economy
Aggressive bond buying?
You call printing $75 billion per month out of thin air to buy U.S. Treasury bonds aggressive? Pu-lease! In the pool of central banks, our Fed definitely swims in the shallow end of the pool.
To find a shark, we have to look to across the Pacific. And it’s not China … it’s Japan.
Most central banks moan and groan about printing a few measly billion dollars or euros to buy bonds. Will the currency suffer too much? Will the markets remain stable? Will businesses use the lower interest rates to borrow cheap money for investment?
What whiners! They should all take a page out of the book currently being written by the Bank of Japan (BoJ).
Go Big or Go HomeUp until Friday, the BoJ was content to print 60 trillion to 80 trillion yen over the course of a year, spending roughly 50 trillion yen on their own government bonds. In dollars, this equates to printing between $550 billion to $720 billion, with about $450 billion spent on Japanese government bonds.
However, the straight up conversion to U.S. dollars doesn’t tell the whole story. Japan’s economy is roughly 30% the size of the U.S. economy, so their level of printing would equate to the U.S. pumping between $1.8 trillion and $2.4 trillion into the American economy each year, with $1.6 trillion used to buy U.S. Treasurys.
That’s a lot of cash, but as I said, that was the case until last Friday. Now, the BoJ is going to print even more.
The Japanese central bank announced its plan to print 80 trillion yen per year, using just about all of it to buy Japanese government bonds. This equates to about $730 billion dollars, and that would be like the U.S. printing $2.5 trillion per year to buy U.S. Treasurys.
That’s more than $200 billion per month, where our Fed was only printing $85 billion per month at the height of its quantitative easing (QE) programs.
Interest Rates and BondsThe BoJ also stated their plan to triple the amount of yen they print to buy ETFs in their stock market, growing the program from 1 trillion yen to 3 trillion yen, or from $10 billion to $30 billion, per year.
Our Fed didn’t even (officially) get into the equity markets.
The goal of these programs seem obvious — to hold down interest rates by purchasing government bonds, and to prop up the stock market by purchasing ETF’s…. but there might be more to it.
On the same day that the BoJ announced these moves, the Japanese Government Pension Investment Fund (GPIF), which controls $1.2 trillion in assets, announced plans to sell $300 billion of Japanese government bonds, and buy $150 billion each of Japanese and foreign equities.
This might, just possibly, look like a coordinated effort to keep the price of Japanese bonds high (and rates low) while the GPIF reduces its position, and to boost the equity markets as the GPIF increases its holdings of stock.
Whatever the intention, this was exactly the result. Japanese bond yields fell even further on the news, with the 10-year bond yield dropping to 0.43%, while Japanese equities were up almost 5% on the day of the announcements.
But nothing in this world is free.
If it all sounds like sunshine and roses so far, that’s because we’ve only discussed the winners. The losers in this game are the Japanese consumers.
As the BoJ prints more yen, the value of the yen falls against other currencies. This is part of the goal — to make Japanese exports cheaper on the world markets in order to boost exports and increase Japanese GDP.
Starting in 2012, the BoJ has been driving the yen lower; since that time it has fallen from 78 yen to the U.S. dollar, to 109 yen to the U.S. dollar. That’s a 40% devaluation.
While this does make it cheaper for foreigners to buy Japanese goods, it also makes foreign goods more expensive to Japanese buyers. If we were only talking about importing Porsches and Caterpillar tractors that would be one thing, but Japan is a series of rocky islands.
They import much of their food and energy, which are two things it’s hard to live without. As the yen slides, imports of food and energy march higher in price. And it gets worse.
The Effects of a Dropping YenPart of the goal with driving down the yen was to increase Japanese corporate profits, which were supposed to trickle down to employees in the form of higher wages. It hasn’t happened. While some workers have received minimal increases, the extra money hasn’t been enough to offset the inflation in necessary items.
Most workers haven’t even received the minimal wage bumps. So as the yen drops, Japanese consumers watch their cost of living increase… as their wages remain mostly flat.
And since the government is using newly printed yen to buy bonds and hold down interest rates, savers can’t earn any interest, much less sufficient interest to offset their increased costs.
When the BoJ announced even more yen printing, the yen’s value fell from 109 per U.S. dollar to 112, so Japanese consumers immediately suffered a nearly 3% jump in the cost of imported food and energy in one day.
Oddly, equity markets around the world rallied as well. The European markets were up more than one percent, and U.S. markets posted similar gains.
The reasoning seemed to be that money will flow out of Japan, where it’s treated badly with a falling yen and low interest rates, and will make its way to other markets. But this seems to ignore the long-term implications of what is going on in Japan, and where it might lead.
Questions AriseWhat happens as the Japanese population continues to age and they’re left with assets like stocks that have profits on paper, but their currency has dropped so far that they can’t afford food and energy?
What happens when the world loses faith in the currency of the third largest economy on the planet because Japan, with a debt-to-GDP ratio of more than 240%, has chosen to run the money presses 24/7?
At some point, foreign investors will choose to hold zero yen, because the currency has become meaningless as the BoJ prints with abandon.
Japanese importers will have to pay all their bills in foreign currency. These two trends will mean the BoJ will have to spend down its foreign currency reserves as it exchanges dollars, euros, and whatever else it has for yen.
If the BoJ’s foreign currency reserves run low, the country runs the risk of becoming Argentina circa 1950.
The lesson for foreign investors is to keep the Japanese markets at a distance. If you have to be involved, make sure your currency exposure is hedged.
You don’t want to wake up one morning to find that your assets have fallen by 3%… 10%… or 20%… when the yen comes crashing down.
Rodney
Ahead of the Curve with Adam O’DellFollowing Last Year’s Script?
October 31, 2014
My Strategy for the Rumor Mill
Happy Halloween!
And what a blood-pumping month it’s been! The markets have been all over the place. If your emotions didn’t run wild with them, a Zombie costume may be an appropriate choice for today.
Personally, I had to take a couple of steps back to figure out all the hype cycles. Today, I am going to share some information with you about how to profit when everybody else’s head is spinning.
I’m sure you’ve heard the old Wall Street adage, “Buy the rumor, sell the news” — and maybe you were even left holding the bag on an execution strategy. Well, we now have a leg-up in this fight, because the rumor mill has now been digitized through social media, blogs and chat — and that’s exactly what we monitor.
In fact, I utilized my Department of Defense and systems engineering background to create a system that finds rumors that are “needles in the haystack of messages” to gain a market advantage. A lot of tracking and testing has proven that this is a system that works.
When I applied this system to Ebola plays in the biotech corner stock market, some serious patterns emerged. The largest pattern was the message chatter volume increasing on numerous Ebola-related stocks — just before the share price jumped. I call this the ground-swell effect and I’ve utilized many times to identify potential rising stars before the mainstream media and most other traders can identify them.
This is one way to make substantial gains. We can also profit on the other side of a trade, because our system also picks up a decline in message-chatter, signaling an “end-of-hype” downturn. This is exactly what happened with many Ebola-related stocks and we’ve already been handed a tidy gain. At last glance, our previous trade was up more than 25%. If you’d like to see more about that, you can read about it here.
Stay tuned for the next big hype cycle.
Happy Hunting,

Ben
Economic Collapse Scenario
The third round of QE is finally over. And stocks keep edging up. They’ve been slower than in 2013 and the recent correction took them temporarily into negative territory. The trend currently is that investors simply have nowhere else to go with bonds fluctuating constantly and commodities faring even worse.
Despite the slowing of affluent spending ahead in the U.S., it continues to look stronger than Europe. China’s economy is consistently slowing and Germany is not doing well at all… these are all things we’ve warned were coming.
But even after the 10% setback into October 15 for stocks, they’ve roared back stronger than ever. This may be the final hoorah for the “market on crack.” The Fed has rigged the markets so there’s nowhere else to go but stocks and the bulls keep running… and they’ll run until they’re out of steam, which looks like it’ll be very soon at this point.
Today’s latest surge comes from another doubling down on QE from the most desperate country in the world, Japan. This is insanity!!!
I see a big shift coming by looking at chart patterns across financial sectors…
The clearest one is the Megaphone pattern on the Dow (and many other sectors like the Russell 2000 for small-cap stocks).
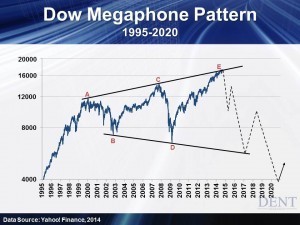
Each bubble over the past 14 years has taken the markets to new highs in 2000, 2007 and now 2014; but each crash has also taken us to new lows. I’ve been predicting the Dow would peak just over 17,000 and then fall to a level between 5,500 and 6,500 depending on when the bottom trend line above is tested.
Throughout 2013, the Dow gained 25%. Yet if you look at the last bull run from mid-November 2012 to the end of 2013 the Dow gained 33% — from 12,500 to 16,600. At its top on September 19 of this year and the retest of that today on October 31, the Dow only gained 4.2% at best.
Why?
It’s hitting resistance at the top trend line of this massive Megaphone pattern… and the Fed is tapering and taking away the punch bowl.
Not including China, the emerging markets are the only ones that still have strong demographic trends but they’ve stayed consistently down since early 2011. Why? They correlate much more with commodity prices than with U.S. and other developed countries stock markets.
Commodity prices are down about 27% since late April 2011 and stocks from emerging markets represented by EEM (ETF) below are down 20%+ in recent weeks. Look how EEM has traded between $36 and $45 since September of 2011 in a long A-B-C-D-E sideways channel.
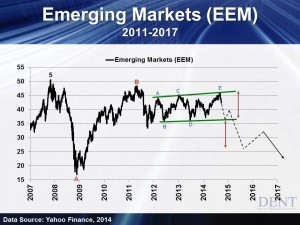
This consolidation should be about over and it should break strongly, regardless of whether it is up or down. The best interpretation was that the recent high peak (E) that broke back to the top of the channel at $46 was the final wave up.
This pattern suggests a drop to at least $27 in the coming year, especially if it pushes below that $36 level ahead convincingly. That’s 41% down from the recent high… and that’s just the next drop coming most likely in the next year. That would only be consistent with a continued fall in global growth.
In respect to gold, most people are keenly aware that its prices have been plodding along in a sideways pattern since May of 2012, with a distinct line in the sand around the two bottoms it hit when it neared $1,180. Gold broke below that level today. Hence, another drop is likely approaching with the next support at around $700. Oil is also close to breaking down from a long sideways pattern at just below $79. It could fall as low as $10 to $20 in the next several years.
Another commodity that best represents global growth is copper. Its horizontal movement has been going on since about May of 2013. It’s been hovering near $3 recently but keeps bouncing off of $3. If it falls much below $2.90… it’ll be curtains for copper, commodities in general and global growth.
Global growth has been declining steadily from a peak in late 2009 of 5% to a low of 2.2% in mid-2012 and 2.7% recently.
Here’s the bottom line. From late 2014 to early 2015, the scene will be ripe for a major shift in the markets. The chart patterns and our fundamental indicators and cycles all strongly suggest it will begin slipping down starting in early 2015 at the latest.
Be selling on rallies, especially as the Dow hits one more new high at 17,400+. Look to get out a little before rather than after a peak as bubbles like this one will burst quickly… just as gold’s did in early 2013.
Harry
Ahead of the Curve with Ben Benoy My Strategy for the Rumor Mill
October 30, 2014
Federal Reserve Stops the Presses
The howling can officially end. All the people crazy-mad about the Fed printing money (gold bugs, inflationistas, etc.) can ease their blood pressure and go back to their normal lives. On Wednesday, October 29 the Fed announced that it was no longer initiating new positions in U.S. Treasurys or mortgage-backed securities.
Sort of.
Even though the Fed isn’t growing its balance sheet anymore, it has pledged to keep its balance sheet at the current size. Whenever a bond matures or pays off early, the Fed will have to replace it. This might sound mundane, but the Fed has over $1 trillion worth of bonds maturing in the next five years. That’s not chump change.
Still, does it make a difference?
I don’t think the Fed is ending Quantitative Easing (QE) because it succeeded, I think they have pulled the plug because it doesn’t work… at least, not the way the Fed wanted…
The program provided tremendous support for the markets in its first iteration back in 2009. Not only did the Fed unfreeze the mortgage-backed bond market by purchasing securities, it also provided confidence to market participants that they wouldn’t be left holding unsold inventory. The initiative also drove down mortgage rates, which was part of the goal. But beyond some confidence and lower interest rates, what did QE2, Operation Twist, and QE3 (or infinity, whichever you like) actually do for us?
Homeownership fell to the lowest rate in over 30 years, so lower long-term interest rates haven’t goosed the housing market. Borrowers have cheaper money, which has given Apple and other big companies a cheaper cost of borrowing, but all they did was buy back their own shares. Consumers can borrow at cheaper rates, but other than student loans (which don’t count because they have set rates) and a boost in sub-prime car loans, debt hasn’t been rising.
All that said, lower interest rates have had one tremendous, long-term effect. They stole money from savers.
Every time the Fed bought a bond, it used money it had not earned to compete with other bond buyers. The competition drove interest rates lower than they would have been without the Fed, which means the other bond buyers paid more for the bonds than they would have if the Fed wasn’t buying.
For everyone that bought a bond over the last six years, this means you. Your interest rate was lower than it would have been if the Fed wasn’t using newly printed dollars to buy bonds as well.
At first glance, this might lead a person to think rates will spike higher, but that’s not very likely. If the Fed had ended QE before 2014, then maybe rates would have jumped. But now the global economy is slowing, with China missing GDP growth targets and the countries of the euro zone falling toward deflation. In this environment, it’s more likely that rates stay low and even fall further.
With QE off the table, the investing world now turns its attention to their other intervention policy — keeping short-term interest rates between 0% and 0.25%. The Fed announced this rate would stay low for a “considerable time,” without defining what that meant.
Is it six months? Nine months? A year? No one knows.
All we can do is wait for the Fed to tell us. But they did give us one hint. Their latest press release stated that their policies remain data driven, which means the Fed is looking at each release of unemployment, GDP, etc., trying to determine what it should do next.
If that doesn’t give you comfort, you’re not alone.
We expect more volatility in the equity markets in the months ahead, as everyone tries to figure out if the latest economic statistic is good enough, or bad enough, to change Fed policy.
Welcome to the world of a more transparent Fed. It’s unfortunate that we don’t like what we see.
Rodney
Is This Bull Market D.O.A?
I’m a medical school dropout.
And since I vowed not to waste that $40,000 I spent to realize that I actually didn’t want to be a doctor… I now find myself borrowing concepts from the medical profession and applying them to market analysis (my true passion).
Doctors routinely check patients’ levels of two types of cholesterol: “good cholesterol” and “bad cholesterol.”
Bad cholesterol clogs arteries and can lead to heart attacks and strokes. Meanwhile, good cholesterol works to clear bad cholesterol out of our blood.
So, to a doctor, the relative levels of good and bad cholesterol provide a useful gauge of a patient’s health. The doctor wants to see a high level of good cholesterol and a low level of bad cholesterol.
Said another way… a healthy patient’s blood should show a high ratio of good-to-bad cholesterol.
Much like doctors, market strategists are continually monitoring the “health” of bull markets… looking for potential warning signs that their “patient” is about to croak.
And one way to keep your finger on the market’s pulse is to measure investors’ willingness to buy into high-risk/high-return sectors.
Typically, when investors are confident and risk-seeking they prefer to buy stocks in the consumer discretionary sector more so than stocks in the consumer staples sector. And when investors are fearful and defensive, they prefer the relative safety of consumer staples stocks.
A simple ratio of these two sectors (discretionary-to-staples) acts as a useful gauge of investor sentiment. And when the ratio is falling, it indicates investors are growing increasingly wary and prefer a cautious and defensive stance.
It doesn’t mean a bull market is dead on arrival. But it’s a red flag that deserves close monitoring.
Since March of this year, the discretionary-to-staples ratio has trended downward, while the broad market continued to march upward. That’s a clear warning sign. Take a look…
Investors can still make good gains in “sick” markets… but you can’t be “all-out long.” And you have to know which sectors, specifically, are poised to outperform alongside the “risk-on/risk-off” sentiment du jour.
Go here to learn which sectors you should be in for the next two months.
Adam
October 29, 2014
Depression and the Economy of a Country
My father worked in politics with many great leaders. I also had the opportunity to speak, and work with many great communicators and entrepreneurs. It’s appropriate for most people to admire accomplished leaders… but on the inside, they also get envious. They wish they could be like them.
Remember the old adage — be careful what you wish for.
I’ve noticed, and with few exceptions, that most great leaders or entrepreneurs experience some major challenge early on in life that forces them to rise up against it. Reacting to this dilemma, they develop strengths most people never will
You know what they say… no pain, no gain.
I’ve also learned that many have dyslexia, ADD or even bipolar disorder. These challenges cause them to learn differently and to see things differently as well.
Psychologists speculate that non-depressed individuals usually feel they have more control of the world around them. While the depressed have the perception that they don’t have control of everything and can then be more flexible and pragmatic.
Being an entrepreneur or a great leader can take you down a very lonely path.
You don’t have many peers with which to socialize and often, don’t have any. You’re typically swimming against the current like a salmon moving upstream. The leader role takes a great level of commitment and you end up not having many opportunities to be with family and friends like most of us do…
Still envious?
Studies in LeadershipIn the show Homeland, Carrie (played by Claire Danes) is severely bipolar. But she’s the top agent that solves all of the biggest cases. Someone who is bipolar experiences more than the average person by moving rapidly from highs to lows.
The show depicts that the dramatic mood swings she experiences are isolating and have placed her on a painful and lonely path. Carrie isn’t well understood by her peers despite the fact that she usually breaks open the damn case.
Keeping to the bipolar disorder parallel, how much would the typical business learn and change if it went through 10 booms and busts in 10 years instead of just one?
Can we learn more about our economy by looking more at our leaders?
I recently watched an incredibly interesting documentary on the Roosevelt family as they showcased the true-life challenges they faced. As a child, Teddy was a sickly child and almost died from an asthma attack. It’s hard to believe because of his robust nature as an avid outdoorsman and hunter… as well as a bold leader.
FDR not only had polio but he also suffered from depression and frequently isolated himself because of his workaholic nature. Yet he led our nation through a depression and a World War. After his death, his wife Eleanor went on to great achievements yet behind the scenes, she too suffered from depression.
Just days before watching this documentary, I heard about Robin Williams’ suicide and then Joan Rivers’ accidental death. Two talented celebrities — Williams was a great comedian and actor and Rivers was one of the top female comedians in history.
Both battled depression their entire lives and despite of it… were incredibly successful. Williams was also plagued with drug and alcohol addiction and Rivers was an intensely busy workaholic, even at 81.
Then I recalled a special I watched on Abraham Lincoln. No one had to tell me he was depressed. He’s perhaps the most depressing looking leader I’ve ever seen in history. He was treated for melancholia and was even placed on suicide watch during his presidency. After Lincoln’s assassination, his wife Mary sank into a deep depression and eventually ended up being committed to an insane asylum.
Look at Winston Churchill… another leader who was depressed and a heavy drinker. He’s said to have called his depression his “black dog” that followed him around. Churchill even avoided ledges and train platforms. He’s reputed to have said that you never know when a whim will overtake your sense of self-preservation. Yet his contributions to the political history of Great Britain are huge.
Depression is perhaps the most intolerable of emotional afflictions and if you can conquer that, you can probably conquer pretty much anything. But it can certainly prove to be a strong motivator that will get you off your ass to do something.
I was talking to one of the best speakers in his field of sales training and he told me that he had learned that he was inclined to depression. He found that working and being constantly engaged was the best and healthiest antidote for it.
Success Through HardshipI realized through all of this that the underlying common thread in all of these leaders and successful individuals is the presence of depression… and it all fit together.
So here’s my first insight… if there weren’t a small percentage of depressed and otherwise so-called “afflicted” people in society; we wouldn’t have the innovation and leadership that has driven our remarkable progress, especially over the last few hundred years.
We should appreciate such people for the internal battles they have to fight, not just the external ones they tend to win. But you may want to think twice about envying them and wanting to trade places.
I don’t like calling things like depression, bipolar disorder, ADHD, etc… “diseases” or “afflictions”. I think that we should learn to look at and work with people simply in terms of their strengths and weaknesses.
As Peter Drucker said: “Great people have great weaknesses.” But they obviously have great strengths as well. Everyone should learn to focus on their strengths and to minimize, or offset, the weaknesses where possible. If you’re depressed and want to address it, it’s better to be a workaholic than an alcoholic.
My second insight is that it’s the same concept when you look at the economy. I’ve always said that the winter season, like the Great Depression, is the most challenging. But it is also the most opportune and powerful.
We’ve witnessed the most radical innovations during harsh depressions in our economy. We’ve created new arenas for growth that last for decades while simultaneously, great leaders create new political directions for the nation.
Innovations such as computers, TVs, automated appliances, jet engines and the A-bomb came out of the last winter season… and autos, electricity and phones in the one before that.
That said, I don’t see great leaders around today.
Our economist and politicians simply don’t tell the truth about our debt and financial leverage. They’re not making the hard decisions that will turn our economy around for the long term and they’re taking the easy way out.
But mark my words, we will see some great leaders and radical innovations emerge in the next decade when we finally settle into harsh deleveraging and a depression that is, unfortunately, inevitable. And it will be the most painful of our lifetime.
Greatness comes out of facing great challenges but not by taking economic medication like endless money printing.
We really have become comfortably numb. But that’s about to change, and most likely… drastically.
Harry
Ahead of the Curve with Adam O’DellIs This Bull Market Dead On Arrival?I’m a medical school dropout.
And since I vowed not to waste that $40,000 I spent to realize that I actually didn’t want to be a doctor…
October 28, 2014
China’s Economic House of Cards
China is nothing more than an economic house of cards, ready to fall with the slightest breeze. The country feeds its GDP with piles of debt, using the borrowed money to pay for commodities, which are then used to build unwanted structures, all in the name of progress.
When it finally comes tumbling down, the Chinese crash will reverberate around the world. But don’t think the country is feeble or weak! Even with a failing economy, China can still cause mayhem in Asia, and the biggest obstacle standing in the way of China imposing its will on the region — the United States — appears to have lost its resolve.
This is the future of the Middle Kingdom in Asia, as forecast by Gordon Chang, Chinese Economic Analyst and well-known author. Mr. Chang spoke at our recent Irrational Economic Summit in Miami. I had the pleasure of sharing a meal with him and his wife, Lydia, after his presentation, where we continued the conversation about what might happen on the other side of the world.
Given China’s enormous need for energy, I thought the most likely place for Chinese military action was in Siberia, along the border shared with Russia. After that, it seemed logical that China would like to rid itself of the crazy weirdness that is the Kim dynasty in North Korea.
The best option would be to replace the young Kim Jong-un with a less rash puppet leader to maintain the buffer country between China and South Korea. As a side benefit, the Chinese population could add a few North Korean women to its ranks in an effort to ease the imbalance caused by the one-child policy. In no uncertain terms, Lydia and Gordon explained that even while China is stumbling with a slowdown in the domestic economy, the leadership has its eye on one prize…
And that’s Japan.
Japan and China’s TensionThe animosity between Japan and China is no secret. The feud stretches far back in time, and includes the First Sino-Japanese War in 1895 and the infamous rape of Nanking in WWII. There’s no doubt that much of the anger stems from the changing of the guard as to which country dominates the region. China dominated for centuries, but was replaced in humiliating fashion by Japan in the 1800s.
Even when Japan was defeated in WWII, the country was still able to rebuild quickly and expand economically, while China suffered through its Cultural Revolution. The last 20 years have been exceptional for China, as the country has grown dramatically while Japan has faltered. But there is more to be done, and China sees an opening.
Recently the Chinese started a construction project in the Spratly Islands, which are part of a contested group of islands in the South China Sea. The main opponent in claiming the islands is the Philippines, which had maintained a presence in the area but their resupply efforts were cut off by the Chinese Navy.
These events caused uproar in diplomatic circles, but nothing else. The U.S. answer to the Chinese actions was a weak denouncement. If the U.S. is willing to let the Chinese bully a main ally like the Philippines, then how far can China push a country like Japan?
We’re about to find out.
Action Behind the ScenesThe Senkaku Islands are rocks, but they do have strategic and symbolic importance. The islands sit at a gateway to the area in the East China Sea near Taiwan. They were ceded to Japan in the 1890s. Exercising control over the islands today is one more way that China can show Japan which country controls the region.
As for Russia, the Chinese recently signed a decade-long energy deal that should keep the two countries linked for at least a few years. On North Korea, the Changs explained that while the country is an embarrassment to China, the older members of the Chinese military fought alongside their North Korean counterparts in the Korean War, so they are willing to stand with them, even when run by a dictator like Kim Jong-un.
The one question that the Changs found troubling about recent Chinese activity is, “Why now?” The country could have acted earlier, before Japan and South Korea gained nuclear capability. Or, China could have simply sat back and waited for Japan to devolve as its population dies away through attrition.
Perhaps the leaders of China recognize the depths of their own economic troubles, and are willing to pick international fights in order to rally nationalist feelings among the population. If that’s the case, then the eventual end game of all of this could be a very tense military standoff between China and Japan that could embroil the U.S.
One thing more damaging to the world economy than a contraction of the Chinese economy would be an armed confrontation with the Middle Kingdom. It’s possible that a lot is riding on the fate of a small group of islands in the East China Sea.
Rodney


