
Harry S. Dent Jr.'s Blog, page 2
March 31, 2020
Deflation in the Time of Coronavirus
I’m no Garcia Marquez, and the title isn’t quite Love in the Time of Cholera, but hey, this is a financial piece.
I’m still hung up on the number of infections from the coronavirus Covid-19 around the world. I’ve read a number of interesting (at least, to a math geek) articles discussing the size of the infected, but undetected, population, and the infection rate.
The undetected group consists of those who have the disease but were never tested because they didn’t seek medical attention. Either their symptoms were mild or they had none. The estimates for the percentage of people infected in this group range from 80% to more than 90%, so we’d have to multiply the known number of infected people, about 740,000 right now, by 10 or 12 to get an estimate of the actual number of people who have, or have had, the disease. On the low side, that gets us to almost 7.5 million.
At that level, we’re no longer talking about stopping the spread, but managing how it happens, which is what they are doing in Sweden. Granted, the Nordic country is hard to replicate. They have high trust in their government and follow instructions well, which aren’t two characteristics we can claim in the U.S.
So, we’ll continue with our shelter-in-place orders, social distancing, and other mitigation measures as we try to stop new patients from overrunning our health care system.
But this won’t last forever. As investors, we need to be considering how this changes the financial landscape not for the next few months, but for years.
Think Deflation
With the Fed printing as much as they want and buying everything in sight, it might seem like we’re headed toward inflation. We’ll probably get there, but it will take years. Between now and then, we’ll struggle to rebuild incomes and asset prices to what they were just 45 days ago. Some portion of the businesses that closed their doors will never reopen. Some part of the workforce won’t have a job when this is over. And some percentage of workers who are required to work from home will adjust to the change and continue to do so when this is over.
All of it will weigh on assets.
Strip malls and small office parks are likely to be hardest hit from lost tenants. Big malls are easy targets, but their tenants tend to be national companies that can more easily navigate bailout funding as well as debt and expense restructuring.
We talk about local restaurants, but consider all other businesses, like paint-and-wine shops, souvenir stores, local clothing stores, etc. And those that don’t close will suffer severe cash disruptions that will affect their spending and expansion plans for some time.
The knock-on effect is higher unemployment which dents consumption across the board, from auto sales to pizza.
Residential real estate could be the hardest hit in the short-term, as people, both buyers and lenders, worry about jobs. Sellers will want to maintain current high prices, but it’s likely they won’t have the same level of interest as they did “BC,” before coronavirus.
The same story will play out across the globe, weighing on international trade and dealing a blow to demand in the energy markets, which are suffering with oversupply.
All of it points to one thing, lower prices.
As an investor, I’ve been buying through the downdraft. The equity markets are forward-looking. As we get clarity on the duration of the crisis, I expect prices to move higher but not reach the old highs anytime soon.
As a consumer, I’m holding off. I think there are better prices to be had in the months, and maybe the year, ahead, on everything from new cars to rental properties. Even if the huge stimulus package replaces a large chunk of the money that went missing from the economy, I don’t see how it will give individuals the level of confidence necessary to spend as if the last 45 days didn’t happen. It will take time to get that risk appetite back. Until then, on the consumption side, cash and patience will be the keys to success.
The post Deflation in the Time of Coronavirus appeared first on Economy and Markets.


March 30, 2020
Amidst the Chaos… the Big Picture
While Covid-19 continues its expansion into the U.S. and Europe, there are clear signs that its acceleration is slowing and that we could be seeing a marked slowdown between mid- and late April, like China did in mid-February.
They are going back to work and into the streets now.
With mind-blowing but totally predictable stimulus programs, you would think the markets would be high on crack again… but most signs point to one more surge downward – albeit not as violent or sharp as the last.
The Big Picture: We are in the late stages of that first average 42% crash in 2.6 months that marks the end of great bubbles that seem to have no end while they are going. There will be a substantial rebound – and maybe this time, more so – that by history should last three to five months and reclaim 50% to 60% of the losses…
Then, after the last denial – the last hope, the last “high” – comes the detox, the real deleveraging of debt and bubbles…
The Depression We Had to Have.
I was talking to my Australian promoter Greg Owen over the weekend about how to re-create my tours there online for now, and he said that in Australia’s only serious downturn in three decades, their most cherished prime minister infamously called it “the recession that we had to have.”
That’s the real big picture. We cannot get healthy again until we get the grand perversion of debt and financial asset bubbles out of our economy – as they both pervert the very miracle of free market capitalism and democracy that were born together as the great marriage of opposites in the late 1700s. Japan has proven more and longer than any country that three decades of stimulus and money printing without deleveraging and restructuring debts does not work! Where’s its recovery, its spring season?
From here on out, it will be an epic battle between escalating money printing and fiscal stimulus versus unprecedented debt and financial asset bubbles unwinding to offset. There’s $330 trillion of financial asset bubbles including loans, so guess which will win!
This quick crash in stocks alone has already destroyed over $15 trillion in wealth in about one month. There will be more like $160 trillion, two times global GDP, and $60 trillion in the asset-rich U.S., three times GDP before this detox is over.
So, you think they can get away with printing $160 trillion before looking beyond ridiculous and losing all credibility? Take that, you academic, douchebag economists who have never run a business… or had sex (apparently)!
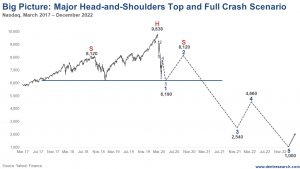
Here’s my best depiction of how this will play out using one of my two favorite chart patterns at major topping periods (the other is the megaphone pattern, which is also in play on a larger and smaller scale). This is a large head-and-shoulders pattern for the Nasdaq that appears to be forming. And even if it doesn’t, this is the pattern history clearly tells me will occur.
There is the biggest delusion currently, that this crash is all about the coronavirus, a black swan. This is a true black swan, but really it’s the Perfect Shock! Ever more stimulus can further cushion an already massively over-stimulated economy, but it can’t stop the virus like it can temporarily stop stock crashes and bank failures, etc.
My best target for the final wave of this first crash is 2,080 on the S&P 500 and 6,190 (the December 2018 low) on the Nasdaq. That forms a flat neckline through that late 2018 low. The left shoulder peaked at the September 2018 top around 8,120. The rebound I am forecasting from a lower low just ahead would peak between around July, and at the latest the election again, at around 8,120 – I am assuming mid-September 2020. (Note: I am using classic head-and-shoulder and wave ratios to make my best guess for this larger scenario, but no way will it work out exactly like this.)
The biggest third wave then comes from later this year into round the end of 2021. That wave (like the recent third wave down) should be the largest and longest. It would bottom according to the head-and-shoulder projections around 2,540 in December 2021 – the worst year of the larger crash. (The distance from the head to the neckline equals the distance to the crash bottom form the neckline once its broken.) After a fourth wave bounce into around May 2022, the final bottom comes between 800 and 1,100 – or about 1,000 at the end of 2022… Then the crash of a lifetime is over and the opportunities truly begin!
But the stimulus will not last as exposures in the foundation continue to crack, businesses keep failing and some just don’t come back (I saw that here in Puerto Rico after the hurricane). Consumers default on loans and some just give up on getting work again or get worse jobs. Major corporations, here and in the emerging world default and many can’t get healthy again. Emerging country governments keep defaulting.
This isn’t primarily about the virus, as will become clear when the virus proves to be temporary and the downturn does not. You will soon have a chance to leverage this rebound and prepare even better next time to profit from safe haven investments and to make a small fortune in targeted downside plays. But again, the big profit comes simply from buying the best financial assets and companies and real estate on the biggest sale since 1932-33.
Just after the election, if not before, the economy just rolls back over and central banks have already blown almost all of their ammunition right off the start this time – as they know how weak the economy has been after giving it non-stop life support for 11 years.
Then we get the classic 2-year+ more precipitous decline in stocks and the economy melts down like late 2000 into late 2002, and early 1930 into mid-1932. Then, and only then is it over, and finally the detox can happen and it will be unbelievably painful… except we have prepared you for that and it can be unbelievably profitable – what I have called:
The Opportunity of a Lifetime to Create Extreme Wealth.
Do not miss my once-a-month “Conquer the Crash” video, in subscribers’ inboxes tomorrow, where I will summarize all of the short-term analysis over the last few weeks of the fastest major stock crash ever and the final rebound before its curtains.
I won’t be able to get deeper into this important level of analysis for a while.
The post Amidst the Chaos… the Big Picture appeared first on Economy and Markets.
March 27, 2020
Think Like a Trader
I’m going to do the Friday rant a little differently this week, because we’re clearly living through historic times, and the volatility each day in the markets means that we need to make different decisions than we normally would.
Which is why on Wednesday I said that we’re getting to the day where it might be a good idea to start lightening up your portfolio … or getting out of the market entirely.
Well, that day has happened – it’s today, and you should act accordingly.
So in today’s rant, instead of talking about long-term outlooks as we usually do, we’re going to get into the nitty gritty. We’re going to think like professional stock traders.
What’s that mean? It means I’m going to look at exactly where we are right now and consider a series of short-term outcomes based on what’s happened during other crashes in history and where we are today. Then, I’ll lay out the probability of those incomes, and break down what a trader would do in these scenarios.
Again, this is an unprecedented era and we’ll have to act accordingly, which means it’s time to think like a real trader. I’ll show you how to do that this week in my rant.

The post Think Like a Trader appeared first on Economy and Markets.
March 26, 2020
What Have the Markets Done For You Lately?
Remember the comic Gallagher, the guy who’d smash watermelons with a sledgehammer, dousing people in the front row with watermelon guts? He used to do a bit on drivers. He said we could do away with a lot of our traffic police by issuing all drivers dart guns with suction-cup darts.
When you saw someone do something stupid in traffic, you shot them with a dart. When your car collected a set number of darts, the police would issue you a stupidity ticket. If you got too many darts, they would take your license away. The policy would also tell you whom to avoid on the road and in parking lots.
Socially-enforced rules… I like it.
With shelter-in-place orders putting 25% of the nation under some level of lockdown, people are getting bored and looking for outlets. California Governor Gavin Newsom specifically exempted outside activity from his lockdown order, but also cautioned people to be reasonable.
They weren’t. Soon, Californians were flooding public parks, hiking trails, beaches… anywhere that gave them a way to get out and be around people, which was the problem. And not paying attention to social distancing.
So, I’ve got a solution, inspired by a friend in Dallas: Everyone carries a spray bottle filled with fluorescent orange dye. When someone gets too close, hit ‘em with it. That allows the rest of us to easily avoid people covered in orange.
We’re not likely to adopt such a measure, but I like the idea.
As for the markets, they had the best single-day gain since the Great Depression on Tuesday, but we’ve all got that “what-have-you-done-for-me-lately” feeling. Will the good times continue, or was this just a stimulated bounce that will fade as we get more bad news from New York?
I think the answer is, “both.” The return trip won’t be straight, and it won’t reach the finish line, but with $2 trillion headed our way and Americans itching to get back to work, it seems unlikely we retest the bottom in this move. Nike sold a lot of shoes online, and President Trump said he won’t let Boeing fail.
But that doesn’t mean we go back to the February highs. As the restrictions lift, not everyone will still have a job. Many workers in the oil patch will return just to get a pink slip. Americans will keep a little more, or a lot more, cash on hand, and companies will rebuild cash cushions while avoiding stock buybacks for a while. None of this says, “the good times are back!”
And then there’s the math problem.
If you earn 100%, lose 50%, earn 50%, and then lose 33%, your average return is 16.75%, but you’re back where you started in real cash. Your $100 investment went to $200, then back to $100, then up to $150, and back down to $100. This is the magic, or pain, of geometrically-linked returns. The market fell 34%, but it will take a rebound of more than 50% to get us back to record highs. That seems…unlikely.
We’re adding positions to the Boom & Bust portfolio, on both sides. But I’m more interested in holding the Bust securities, big income plays, for a long time. However far the rebound takes us, I think we become range bound as we face the aftermath of the shutdowns and the looming election. That will make solid income plays a fabulous addition to your portfolio, and right now there are many fat yields and dividends to be had.
The post What Have the Markets Done For You Lately? appeared first on Economy and Markets.
March 25, 2020
Italy’s Coronavirus End in Sight?
The markets fell after the Fed took its first massive shot across the bow into Sunday, March 15, then barely reacted to the ultimate unlimited quantitative easing pledge to follow. They’re finally rebounding for the past two days, on news of the $2 trillion fiscal stimulus bill just agreed on early this morning with $4 trillion in Fed loans to boot.
That may not be enough.
Seeing an end to the present acceleration outside of China would be the strongest factor for that sustainable bear market bounce that occurs after the first 40%+ bubble crash.
There was a doctor that did see the China surge in Covid-19 slowing down before everyone else – because he saw the rate of daily case growth slowing even though the total numbers kept piling up and looking bleak…
He must have had some understanding of the S-Curve, which is the pattern that most exemplifies how new technologies, technologies, social behaviors or viruses move into a population. It is the key to measuring an exponential growth process, which this clearly is.
To demonstrate, I take the country that best handled this and has already seen the virus recede totally: South Korea. And it did indeed follow that classic S-Curve pattern in the growth of total infections.
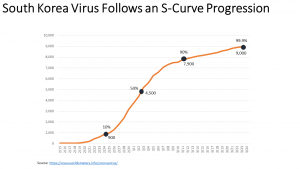
You can see here that the 10% acceleration point was between February 24 and 25 at around 900 cases. It hit the maximum growth rate just after March 2 at around 4,500 cases. Then it hit the end of the acceleration phase at 90% between March 9 and 10 at 7,900 (8,100 would have been the projection). It then grows much lower into a 99.9% peak around March 24, and today is at around 9,000 (right on projection).
The clearest point to project is at the 50% mark as you can measure when the daily growth is peaking – as it did between Feb 29 and March 3, closest to March 2.
So now we look at Italy, the epicenter of the virus’ European explosion. Seeing Italy slow down markedly would be the most important factor for stocks to mount that 3-5-month+ bear market rebound that will give us the best prices to exit going forward, and to get fully into the safe haven T-bonds and other investments to thrive in the great depression ahead.
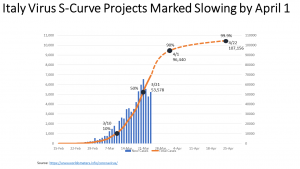
I have been watching this chart the most closely, and have been looking for when the daily cases (in bars) look like they are peaking. That clearly now looks like March 21 as there have been three days of lower advances into March 24. That puts the 50% penetration point at around 53,578 which projects 96,440 at 90% around April 1 when the acceleration phase is over and a marked slowing will become increasingly obvious. The total cases should mature at 99.9% at around 107,156 with around 12,000 deaths by April 23 when Italy will look like China today – ready to get back to work and life.
Somewhere between April 2 and mid-April, the markets should see an end to the worst acceleration and highest death rate in Europe. That should see a bottom to this first 40%+ crash, if not before – and that would parallel the 40% first crash in two months between March 24 and May 24.
Another S-Curve insight. The VIX (volatility index) looks to have peaked at 85 on March 18 and could represent the 50% point of this crash and project a bottom (one more wave down) into around April 15. Correlations with the first Nasdaq crash in 2000 would also correlate and my S&P 500 target of around 2,080 would be the best for a final bottom to this first crash down about 39%. I will discuss this scenario more in my March Conquer the Crash video by next Tuesday.
The second worst country in Europe is Spain, which appears to be about three or four days behind Italy but hasn’t seemed to hit 50% quite yet, but could be as soon as tomorrow. It projects to 100,000+ in total infections but with lower deaths of around 8,000+.
France, Germany and the U.K. are still in the pre-50% stage and are still growing rapidly… but Italy’s slowdown should mark the beginning of most slowing just ahead as well.
The big trend now is the explosion in New York City, with HALF of the 55,000 total U.S. infections today. Recent tests showed that of people tested, there was a 28% positive testing vs. 8% average for the U.S. The “attack rate” is 1/1000, or five-times normal. That’s alarming!
New York is the most dense and largest city in the U.S. and in colder weather, hence, it would be the most dangerous.
I will be tracking New York for when it appears to hit this more predictable 50% point… let’s hope it’s not a lot higher as the total projected infections and deaths will be double that rate.
Good news: the death rate in the U.S. is currently only around 1.2% vs. 9.5% in Italy and 4.4% globally.
Note that the markets are finally bouncing after the most extreme wave of the crash. Now we’ll see if it’s a few days’ bounce like the first one, or one that could last a few weeks or more… The safest sell strategy would be into Friday even though the rally could last a few weeks — but not likely with much higher targets.
The post Italy’s Coronavirus End in Sight? appeared first on Economy and Markets.
March 24, 2020
Where Will the Corporate Cash Go?
It’s possible Congress has agreed on a stimulus program by now, with hundreds of billions if not trillions of dollars allocated to Corporate America. People are frustrated at the idea that businesses that purchased their own shares will now receive bailout bucks. But for some of those firms, that ignores a basic question. What did you want them to do with the cash? And it brings up the next question of, “What will they do with extra funds in the future?”
Over the last two years, U.S. companies bought more than $2 trillion of their own stock through buyback programs. David Rosenberg estimates that, since the Great Financial Crisis, companies have purchased $4 trillion of their own stock. If they hadn’t, they’d either have more cash to use as a cushion during the coronavirus pandemic, or they’d have less debt on their books, depending on whether they used earnings or borrowed money to buy back the shares. They might have increased dividends along the way, or even invested more in their business.
Companies that borrowed money to repurchase shares are easy targets. They look like they were taking advantage of low interest rates to goose their share prices, which often benefited executives who were compensated with stock options.
But what about the companies that used cash?
U.S. GDP growth bounced around 2% for the last decade, and appeared to be putting in another year of non-stellar growth before the virus infected everything. Inflation remained well below the Fed’s target of 2% for most of the decade as well, showing that we weren’t in danger of too many dollars chasing too few goods. It’s possible that companies were earning decent returns but didn’t see much reason to invest in plants and equipment. If they pay dividends, then shareholders must pay taxes, and investors then expect consistent dividends and punish companies that fall short.
Stock buybacks aren’t the only thing a company can do with cash, but it can be a prudent thing.
The current draft of the stimulus plan bans companies that receive bailout funds from buying back their shares while they have bailout loans outstanding. Senator Elizabeth Warren wants to ban stock buybacks forever.
However, that fight ends up, it’s clear that many firms will avoid the practice for the rest of this year, and will use it more sparingly in the future.
What will they do with the cash?
When America goes back to work, and more importantly is allowed to spend money in retail locations and travel, corporate revenue will bounce back. There will be an adjustment period during which companies deal with normalizing their income and expenses, but there’s no reason to think that business won’t be back to “usual” in a matter of months. After they pay off any bailout loans, then what do we want them to do with their cash?
Dividends have the hair of taxes and expectations, expansion for expansion’s sake makes no sense. We’ll demand that they build cash cushions, preparing for “the next time,” which will bloat corporate coffers and be used to purchase U.S. Treasuries, further holding down interest rates. Then what? Perhaps in lieu of regular dividends companies will declare special, one-off dividends each year, hoping to avoid payout expectations. Or we might see increased M&A activity, which would serve to further shrink the available pool of companies we can invest in. None of those options sound like great alternatives.
It’s likely that we’ll see some combination of the above. Firms will repay their bailout loans, then they’ll rebuild their balance sheets with large cash cushions, which could take a while. After that, we’re probably looking at special dividends followed by modest stock repurchase programs by only the strongest companies. Think Apple.
The retrenchment will lay bare how much stock companies are giving to executives, a fact often hidden by stock buyback programs, but it will also take some of the consistent wind out of the sails of the markets. That was a force that assisted all investors over the last decade.
The post Where Will the Corporate Cash Go? appeared first on Economy and Markets.
March 23, 2020
Forget the Bazooka, The Fed Just Went Full Cannon
The central banks already got a big yawn after the Fed pledged up to $5 trillion repo funding and $700 billion of broad-spectrum QE… and that was after going back to zero Fed funds rates for the first time since the long stretch from 2008-15. The Dow saw its highest point drop of 3,000 the next day.
The new all-out announcement did get a response out of the markets finally. Now with the ultimate pledge early this morning (in response to the futures crash limit down again overnight) of unlimited QE to support the markets, the markets reversed and were pointing up between 200-700 points this morning. The open came in down 2% instead already bringing into question how strong the response will be.
This is important as 2,300-2,350 on Friday was very important support for the S&P 500. The next is 2,000 – 2,100 (down 40%), and the ultimate for this first crash is the 2016 low of 1,800 (down 44%). If the markets cannot turn around today, those targets will approach very quickly.
The Fed and central banks are so scared this time that they shot the full “cannon” right off the bat… what are they going to do next? It’s already presumed that the fiscal response will be around $2 trillion+ and maybe $4 trillion in direct consumer and business support, today or very soon.
So, here’s the $10 trillion question: Do we just get a more minor 4th wave bounce off this recent very sharp and deep 3rd wave crash with a final 5th wave just ahead – and did that already happen early on Friday? Or is this the beginning of the multi-month rebound that ranged from three to five months in the 2000 tech wreck and the 1929 crash with 50%+ retracements of that first crash to provide the last exit strategies?
If the S&P doesn’t bounce quickly back above 2,300 and rally harder, then selling may be best for many. If the bounce continues for a day or two but is weak, then it will be best to sell into it early this week around 2,400-2,450 on the S&P 500 and 7,800 – 7,900 on the Nasdaq. If we get a very strong 10% rise with 90% of stocks up in one day, then a longer rebound should be in play.
I’ll give more analysis of that on Friday (or earlier if need be) in my monthly “Conquer the Crash” video with some key charts.
Here’s the chart of the day as the forecasts for a second quarter deep recession go as high as -24% GDP from Goldman Sachs. I have from the beginning and even more now, see this as a two-phase economic downturn – most like the 1980–82 scenario. The difference being that this one starts with a wildly overvalued bubble vs. undervalued towards the end of the long recession from 1970 – 1983 after the last generation spending peaked – and this one will be much deeper in unemployment and GDP decline.
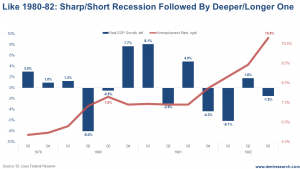
There was a first sharp stock crash and recession to follow in the first half of 1980. Then there was stimulus and a second deeper two-year stock crash and downturn followed from late 1980 into late 1982/early 1983. So, see that rough scenario almost exactly 40 years later (another important long-term cycle).
I would say you could roughly double these numbers, maybe more. If unemployment went up to near 8% in the first sharp recession, it will likely be more like 15% to 20% in the second quarter and maybe bleeding into the third quarter. Then some reprieve into the fourth quarter before that deep two-year slide and depression into late 2022 for stocks and early- to mid-2023 for the economy – say 20% to 30% unemployment. The higher range would come if the virus comes back with a vengeance next fall/winter which is very possible and similar to the Spanish Flu scenario in 1918-19.
This virus is the trigger for the greatest bubble in history to deleverage – the best part is that money printing can’t stop the virus, only cushion the economic impacts. But it’s not all about the virus as its impact is very short term.
This IS the 90-year cycle kicking in that I and my co-author Andy Pancholi (markettimingreport.com) have been warning about.
The virus is just a part of that inevitable and worst cycle for the stock markets, with a clear track record since the late 1700s when stock exchanges first appeared without such outside shocks. The much worse 1918 Spanish Flu hardly impacted stocks that were already at much lower valuations due to World War I. It’s the magnitude of this unprecedented bubble that makes this crash even sharper than first bubbles crashes of the past.
Unless other issues are more paramount, on Wednesday I will give an update on Italy. It is the epicenter of the virus explosion outside of China. I think it is very likely to start to slow noticeably (as China did in mid-February) by early April. It may have shown the first sign of that on Sunday. I use my proven S-Curve analysis to look at things differently here as usual.
That would be a better reason for this first crash to finally bottom and enter that 3 to 5-month rebound that will give investors a better chance to get out and get into the safe-haven long-term Treasury bonds that did so well in this crash. That would support a more normal two-month first crash bottom into early to mid-April. On Friday in Conquer the Crash, I will also give an update on which safe haven sectors did not do as well and may have to be questioned next time.
If the markets do continue to break back down today to substantial new lows below 2,200 on the S&P 500, then those lower targets of 2,000-2,100 and a crash bottom is coming even sooner, may be the end of this week.
Stay tuned.
The post Forget the Bazooka, The Fed Just Went Full Cannon appeared first on Economy and Markets.
March 20, 2020
Two Ways the Coronavirus Can Take Us
We’re now in week two of serious disruption as a result of the coronavirus, and the markets are in the middle of what’s looking like an extremely steep crash. Only 1987 can compare, and those circumstances were totally different.
I’ve spent the week trying to sort out what we should expect to happen in the near- and mid-term projections. Most crashes usually take out about 42% in two months. This one has seen losses of 30-32% in just one. So we should expect the downswing to continue, but not immediately. The way I see it, one of the following two scenarios will play out.
We’ll get a bounce early next week followed by another sharp downturn, on our way to that 42% dip.
We go sideways for another couple of weeks before we start our downward run.
So it’s either going to be a couple days or a couple weeks, but it’s going to happen no matter what.
I’ve also been looking at safe havens for investing during what’s really a short-term crisis. You’re going to see a lot of volatility and should expect that to continue through whatever bailouts get distributed, and then Trump’s efforts to pump up the economy before the election in November. But I get into that and the coronavirus’ growth more generally later in this week’s rant.
Remember, the first crash comes sudden and hard, and that’s what we’ve been for the past week or so. But you cannot forget that the crash is not over yet. There’s still a ways for us to continue downward.
Harry Dent: The Two Ways the Coronavirus Can Take Us
In week two of this serious disruption as a result of the coronavirus, the markets are in the middle of what's looking like an extremely steep crash. Harry has spent the week trying to sort out what we should expect to happen in the near- and mid-term projections…
Posted by Economy and Markets on Friday, March 20, 2020
The post Two Ways the Coronavirus Can Take Us appeared first on Economy and Markets.
Devastation In the Oil Field
Is this capitulation?
Fixed income investments dropped like rocks on Wednesday as investors wondered if a trillion-dollar stimulus package will explode the deficit, causing rising interest rates, and also worried that debtors won’t be able to pay their bills. Even high-quality bond funds were crushed as investors squeezed through the exit doors.
The Dow fell below its closing level on the day President Trump took office, 18,927, before rebounding to finish the day at 18,898. Cruise ship stocks piled up on the rocks, and airline stocks crashed. But nothing, nothing matched the devastation in the oil field.
Just as the fears over Covid-19 were taking off, the Saudis and Russians got into a tiff over cutting oil production. The Sauds wanted to cut by another 1.5 million barrels per day, while the Russians didn’t want to cut at all.
When the two sides couldn’t come to an agreement, the Saudis informed the world they would start pumping all the oil they can. They intend to increase production from 9.5 million barrels per day to 13 million on April 1. This will add more than 3% to world capacity when we’re in the midst of a global economic recession.
The price of oil reached $64 on January 7. Yesterday it fell to $21, down more than 24%, before rebounding a touch to finish the day at $22.39, down almost 17%. At $21, oil was cheaper on an inflation-adjusted basis than the average price in 1972, or $3.39 per barrel, before the Arabian oil embargo.
Once the embargo happened, the price of oil jumped 300%. The shock sent waves of inflation through the U.S. economy for years.
Today, incredibly low oil prices will also ripple through the economy, and that’s part of the Saudi/Russian plan. They might be fighting each other, but both have an eye on the U.S. fracking industry.
OPEC, led by Saudi Arabia, and a group of producers led by Russia, have been holding down production since late 2016. They want oil prices to go higher. But Americans don’t play that game; they keep pumping all they can. The U.S. now produces more oil than any other nation, at least until April 1, and so it took market share from OPEC, Russia, and the other producers.
If the current fight over oil ends up putting a lot of U.S. fracking companies out of business, well, that’s a joyful side benefit to the Saudis and Russians.
But it will hurt here at home.
We’ll get the benefit of sub-$2 gasoline, and truckers, delivery companies, and anyone who counts fuel as a cost will get a bump in profits as the price of a key input drops. But many companies in the energy sector carry a lot of debt, which Harry has mentioned many times. It’s unlikely that their lenders will come to their rescue this time. Expect companies to shut down rigs, lay off workers, and go bankrupt.
The saving grace in the oil patch is that low prices eventually drive out enough production that prices rise again, there’s just no way to know how long that will take. If we get some therapeutic for the coronavirus, or a “flattening of the curve,” as people are describing it among those infected, then investors will start to price in a return to normal economic activity. If the Saudis and Russians call a truce in their market share war, that would also help. In the most positive scenario, we’d get both. In the worst case, we get neither.
If we don’t get relief, it’s going to be a long, dismal summer in Texas.
The post Devastation In the Oil Field appeared first on Economy and Markets.
March 18, 2020
Markets Trying to Find a Near-Term Bottom
Two things I have been predicting for years that most people just can’t get have just started to happen.
You know when a person keeps going into cardiac arrest or flatlining, the doctors keep shocking them with the defibrillator until they finally give up and pronounce the patient dead? I say the economy was finally pronounced “dead” on Monday when stocks crashed 3,000 points, the highest ever, after the greatest injection by the Fed ever – $trillions since Thursday, with a peak on Sunday night.
1) The markets finally realized that you can’t stop a crisis by printing every more money, as it’s just “denial” and “something for nothing,” and
2) The first crash out of a massive stock bubble like this tends to be 30% to 49%, or 42% average within 2.5 months.
This is all happening now. Everyone told me it couldn’t happen – central banks and governments wouldn’t let it.
The market is making its first attempt to find at least a short-term bottom. I don’t think we are there yet, but we may get a decent bounce first to allow the risk-averse to get out.
The S&P 500 has just tested the critical bottom trendline through the lows since the 2009 bottom.
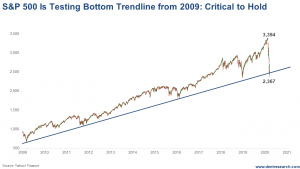
The market keeps crashing to slightly lower lows since it started falling apart last week and hit its greatest one-day crash just over 3,000 points on Monday. Despite pledging $3-5 trillion in repo funding and $700 billion in QE bond-buying, the markets fell over 3,000 points on Monday. It keeps breaking just below intraday, then bouncing and closing above it.
Stocks are limit down overnight and will likely retest Tuesday’s lows or go a bit lower today. Then it must rally and close back near this line near 2,500 or it is likely to fail further.
Where is the next support? I showed on Monday the 2-year megaphone pattern in the Nasdaq that projected down to 5,500 just ahead, or down 44% from the top. This is the same pattern on the S&P 500 and it projects a fall to around 2,080 or around 39%.
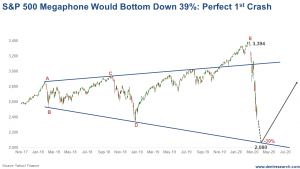
That one more crash would bring a fifth wave down that would look more completed and hit more credible targets for a sustainable low and a rebound that is likely to retrace 50% to 62% of the crash into the summer, or possibly as late as the election. There’s a mountain of stimulus waiting for when the virus scare first recedes.
A short-term bounce that fails could get to near 2,690 on the S&P 500 and 7,900 on the Nasdaq. Selling into that would be recommended, especially for the more risk averse. Don’t try to get the very top here, as a reversal will likely be quick.
I will report more next week, but I am tracking the virus acceleration in critical places like Italy, Iran and Spain using S-Curve patterns to get a better idea of when this trend could start to slow and give some daylight for the markets. That could be as soon as the end of March to mid-April.
The post Markets Trying to Find a Near-Term Bottom appeared first on Economy and Markets.


