
Harry S. Dent Jr.'s Blog, page 4
March 3, 2020
The Federal Reserve Bank Has No Clothes
We’re all pawns in a confidence game.
Somewhere along the way, central bankers took on the airs of economic overseers, acting as if they could, and should, pull levers that create economic activity whenever they deem it appropriate. The idea makes no sense.
The Fed controls money, not desire. The central bank makes it easier for people and businesses to satisfy their desires to spend more money by making credit more readily available, or making debt cheaper to service.
But that’s not the same as creating the desire or want in the first place. If you don’t want to buy a new car, then the financing rate won’t matter to you.
Which brings us to the coronavirus and the current confidence game.
To stem the tide of the virus, governments around the world are asking, and in some places demanding, that consumers not congregate in shopping areas, rail stations, movie theaters, etc. The lack of consumption is weighing on businesses large and small, as there’s only so much take-out food and Netflix that people can take in. Most of the missed sales won’t be recaptured.
On the production side, companies that can’t get workers to the factory floors to plunk out more stuff, or can’t get their goods delivered, or can’t receive raw materials, will be hard-pressed to make up lost sales when things return to normal.
The drumbeat calling for central bank intervention grew louder last week as equity markets around the world fell and analysts lowered their GDP forecasts. By the weekend, the drumbeat had become a deafening roar, with President Trump joining the mob demanding that the Fed do something.
What, exactly, are the central banks going to do to fix this? The answer is nothing, but they might make you feel better.
By lowering interest rates, the Fed and other central banks can make it cheaper to buy things that we finance. Whether they use newly-printed currency to buy long maturity bonds, cut the overnight interest rate, or do both, the result is always the same.
When buying bonds, central banks pump more money into the financial system, which increases the amount of funds available for lending and, theoretically, makes it easier to get a loan. The mechanism is different than pushing down interest rates, but the goal is the same, to entice borrowers who might have been on the fence to take the cash and spend it.
None of this changes your basic want for goods and services, it just makes it cheaper to buy them. In the case of the current virus, it’s hard to see how the Fed, or any central bank, will make a concrete difference.
But maybe that’s not what people are after. Perhaps instead, they want the appearance of control.
We’ve been in tough economic conditions before, and each time the Fed cut rates, printed cash, or both, and the equity markets responded. We didn’t necessarily see the economy rebound in a meaningful way, but when the equity markets turn from red to green, people feel better, and maybe that’s the point.
The Fed might be a financial emperor with no clothes, but as long as people believe, then they can keep the fantasy going.
The post The Federal Reserve Bank Has No Clothes appeared first on Economy and Markets.


March 2, 2020
China: The Emperor Has No Clothes
You know my position on China by now. It has over-expanded, urbanized to0 rapidly and, has excess capacity in everything from empty condos to cement factories. It is the epicenter of the greatest and most global bubble in modern history, and it will fall the hardest.
Clueless economic predictions that China will soon overtake the U.S. economy are as stupid as the projections that Japan would do the same in the late 1980s, before that country crashed and burned after over-expanding…
And Japan’s demographic spending trends peaked in 1996, and China’s already in 2011. How could economists miss something so big, important and obvious?
Now there’s finally been a great study at the University of Hong Kong by four economists. Guess what? China’s been systematically overstating its GDP growth… Who would have thought?
These economists studied all the hard data like satellite images, electricity consumption, railway cargo and merchandise exports. They calculate that GDP has been overstated on average by 1.7 percentage points, or cumulatively by about 20% – and the growth has also been far more volatile… duh! You notice how gradual and steady their slide has been with the trade war and slowing global growth? Sure, that could happen.
With the official numbers, China’s 2018 GDP was $13.4T (trillion) vs. the U.S. at $20.5T – 65% as large.
By these new estimates, it’s $11.1T, or 54% as large. Worse, their GDP per capita is officially $9,800 vs. $63,000 for the U.S., only 15.6% as high. But this new research says it’s $8,000, or a mere 12.7%.
China has pockets of near-Asian Tiger income in cities like Beijing, Shanghai, Guangzhou and Shenzhen, but most of the country is still poor. It’s still a middle-of-the-road third world country, damn it!
At current real average growth rates of about 4.7% vs. 2.1% for the U.S., China would not surpass the U.S. in total GDP until around 2036… I think with the bigger setbacks ahead, even later, 2040+.
They calculate it would take until 2076 to surpass in GDP per capita…
Not going to happen by my estimates as urbanization will peak by 2040 – 2050. I see $27,000 – $30,000 more likely at its peak, still less than 50% of the U.S. today and borderline developed country at best.
In my October 2019 issue of The Leading Edge, I showed why India is almost certain to become both larger and higher income than China by 2065 as Asia increasingly dominates the world and before the next global winter season sets in.
I’m even more firm in my conviction of that assessment after this week.
The post China: The Emperor Has No Clothes appeared first on Economy and Markets.
February 28, 2020
Coronavirus Chaos
The coronavirus is really spreading throughout the world now, having made its way to both Europe and the United States. That’s had a tremendous effect on stock markets around the world, and on Thursday we saw a big drop… and Friday’s open has been nightmarish, also.
So naturally I have people asking me whether I think this is the beginning of the big crash.
And here’s my answer. It could be, but I still don’t think we are quite there.
What we’re dealing with right now – and it is unique – is the actual definition of a Black Swan: a quick moving phenomenon (in this case, COVID-19) that has a pronounced and unpredictable effect on the markets. And this virus has some tricks to it, so expect a little more turbulence as governments try to tamp it down.
But still, I expect things to turn around today or in the next few days, and for a strong V-shaped rally to follow, and a bounce through April or May… right before the actual crash.
I will simultaneously be tracking this crash versus the first big crash in tech stocks from March to May 2000 to see if it is looking more like the first big 42% or so crash in 2.6 or so months – like I did in the two last sharp crashes in early and late 2018.
There’s a lot more to this, and I cover it all in this week’s Friday rant, and also get into Bernie Sanders’s rise in the Democratic primary and what that could mean for the banks and the markets.
And because things are moving so quickly, we’ve decided to delay the release of our March Boom & Bust until Monday. Subscribers should keep an eye on their inbox for that.
As always, we’ll keep you updated.

The post Coronavirus Chaos appeared first on Economy and Markets.
February 27, 2020
The Virus, the Bernie Factor, and the Europeans
It’s been a crazy week. The major U.S. equity indices puked their guts up, mostly over the spread of the coronavirus, COVID-19. With the Chinese economy stuck in a very low gear and new outbreaks happening in South Korea, Italy, and Iran, it looked like it was just a matter of time before the nasty bug washed up on our shores in a meaningful way.
Then staff from the Centers for Disease Control and Prevention (CDC) said as much, noting it’s not a matter of “if” we have an outbreak in the U.S., but rather “when.” Well, that’s just awesome…
But that’s not the only thing driving the stock markets into the ground. That little thing called the presidential election is heating up, and the Democratic race for the nomination took a not-totally-unexpected turn when the candidates took turns punching Mike Bloomberg in the face during his first debate appearance.
Bloomberg’s performance was largely panned, though it did have one big positive: he can only improve from here.
The ugly outing sapped the power from the notion that Bloomberg would swoop in on his billions and secure the nomination as an adult moderate, friendly to business and yet nodding to social concerns. Mike’s loss was Bernie’s gain, which was punctuated by the results of the Nevada caucus, where Sanders picked up almost 50% of the vote.
There’s now an avowed socialist at the front of the race, and it’s scaring the hell out of investors.
If you’re not sure about it, take a look at United Healthcare Incorporated (NYSE: UNH). The stock lost 6.3% on Monday, then 6.4% on Tuesday, and was responsible for more than 15% of the drop in the Dow. Bernie has pledged to destroy private insurance, and he’s leading in the polls.
Just to drive the point home, the latest Reuters poll shows Sanders beating Trump in a head-to-head race among all likely registered voters, 47% to 40%.
But there is a caveat. If Sanders takes the nomination and gathers national support, he would likely repel voters in Trump country who sent Democrats to the House in the midterms. Those seats could flip back, giving the Republicans either more voice, or perhaps even a majority, in the House of Representatives.
Gridlock would be a friend to the markets if Sanders sits in the White House, but it’s not a solid wall. With the presidential pen he can still enact many regulations and call for interpretations that favor a socialist agenda. After all, that’s why his supporters would be sending him to the Oval Office.
And then there are interest rates.
The rush to safe havens as COVID-19 spread drove up the dollar and flattened interest rates, but there’s more to it than that.
If the knock-on effects of the virus put the Chinese economy into recession and drag Japan and Europe down with it, then it’s a sure bet that the Bank of Japan and the European Central Banks will respond with a flood of new cash, sopping up equities and anything else the can find in Japan and buying government bonds across the euro zone. The moves will drive interest rates further into negative territory in those markets, eventually pulling U.S. rates down as well.
The only question left will be, “When will the Fed lower rates?”
If the sell off continues and the economic pain increases, the pressure will mount on the Fed to fix the inverted yield curve by cutting the overnight rate.
The post The Virus, the Bernie Factor, and the Europeans appeared first on Economy and Markets.
February 26, 2020
Just a Corona Correction?
The markets on crack have largely ignored the coronavirus, which obviously could be a potential game changer. And now they react, down 2,600 points on the Dow, as soon as it hits a “white toast” country like Italy. Yes, the markets are quite bigoted!
The markets have been on a tear ever since the Fed started pumping money feverously due to the repo crisis, and have continued with the coronavirus. That has stalled for now, hence I expected a correction here…
But it’s gone about as far as it should if it is to not break that strong final thrust that started in early October, looking very similar to the one from October 1999 into March 2000, in the last great tech bubble peak.
The Nasdaq chart shows a still clear channel if we don’t see the market break down much more than another 1%.
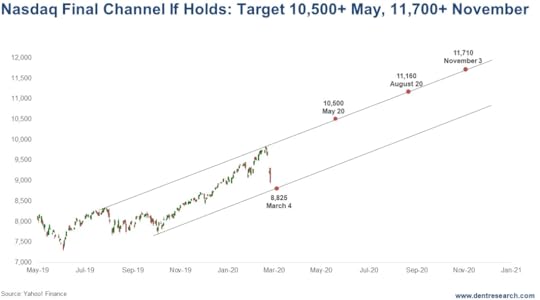
My two best short-term cycle guys are looking for a correction bottom between late February and early March. I’ve noted the bottom of the channel trendline as of March 4, the day after Super Tuesday, where Sanders’ strong lead may become more confirmed. A shot at a balls-out socialist winning is “game over” for this bubble.
The Nasdaq needs to hold around 8,800 near-term and 8,825 by March 4 to hold this channel convincingly. If so, it should continue up and see 20%+ gains by late May, the first likely turning point, and 33%+ by the election if it lasts that long.
This recent advance looks like the third wave up, and what’s going on now looks like the fourth wave correction. If the fifth wave is the same length, that would take us into late July or so with a target of 10,900+.
Note that the final wave tends to have a “throw-over” rally above the channel before it collapses. That means we could see the Nasdaq as high as 12,000+, a 35% gain from here.
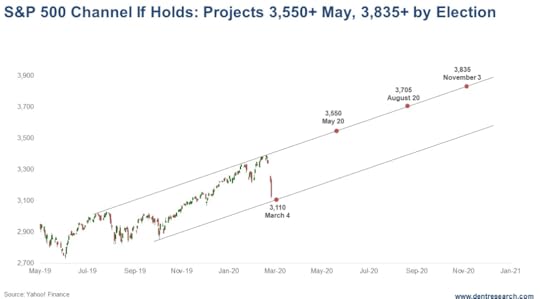
The S&P 500 is similar with even a tighter tolerance down to 3,080 on the downside near-term. The targets by May would project 15%+ returns and by the election 24%+. Hitting 4,000 would be a good top-end overthrow target, a 30% gain from here.
The tech stocks – and more so, the FAANGs – should continue to lead if this final orgasmic phase continues. If, instead, the markets break down too much further, another 8% to 10% downside is likely and a top in place becomes more of a possibility.
The post Just a Corona Correction? appeared first on Economy and Markets.
February 25, 2020
All Hail the Mighty Dollar… Or Not
There’s always some old relative who, when you ask how he is, says, “I woke up on the right side of the grass, so I must be alright!” Kind of funny . . . the first time. Then it’s just another non-reply that doesn’t answer the question. If the only choice was being dead or alive, we wouldn’t ask. The answer would be obvious.
In the world of economic health, we’ve got something of the same scenario playing out, except instead of a quick reply from an aging uncle, we have currencies. Looking at valuations, the U.S. dollar is not just the strongman, but the superhero becoming stronger, while the others fade into the background. That might look like everything is going well for the U.S., but a deeper look shows that it’s just a reflection of how poorly things look for others.
In 2015, the IMF added the Chinese yuan to its currency basket known as Special Drawing Rights (SDRs). I fielded many calls and emails from readers wondering if that spelled the end of the U.S. dollar because it would thrust the Chinese currency onto the world stage. Hardly.
As I pointed out, before anyone kicks Uncle Sam off the top of the hill, they’ll have to prove their mettle by accounting for a majority of international trade settlements and currency transactions. No one is coming close, because investors don’t trust them.
In addition to the Chinese yuan, the main currencies that compete with the U.S. dollar, and are part of the SDRs, are the British pound Sterling, the Japanese yen, and the euro. When deciding what currency to use for transactions and in what currency to hold their reserves, businesses and governments have to weigh the risk and opportunity of each one.
The Brits created turmoil when they voted to leave the European Union in 2015, and then made it worse by taking almost four years to seal the deal. The British pound took a beating over that time, dropping from $1.56 to $1.20, and currently sits around $1.30. If you had to stash a few billion dollars for a couple of weeks, a couple of months, or even a few years, would you want your currency risk to jump around like that?
The Europeans also suffer from Brexit.
The United Kingdom is the fifth largest economy on the planet. As it waves goodbye to the continent, it leaves a multi-billion-dollar hole in the European Union’s operating budget, and potentially upends trade and capital flows.
Everyone knows London is one of the financial centers of the world. Frankfurt doesn’t roll off the tongue like that. And speaking of Germany, that country posted fourth-quarter GDP growth of exactly zero, dragging GDP growth across the euro zone below 1% for all of 2019. It cost $1.24 to buy a euro in early 2018. Now it costs $1.08.
The Japanese yen has been a safe haven for investors since the 1980s, even as the Japanese economy has gone nowhere for almost three decades. With tremendous exports and innovation,
Japan has been able to remain in the top five economies of the world, and consistently attracted capital in tough times. Today is different.
Prime Minster Abe Shinzo came to power in 2012 promising to jumpstart the economy through fiscal and monetary policy, which he would pay for in later years with tax hikes. He tried to create inflation. It didn’t work, but he still had to raise taxes to pay for his monetary largesse. The latest hike happened last fall and cast a chill over the economy, which the coronavirus made worse.
The Chinese buy a lot of Japanese goods and account for a large percentage of tourism in Japan. With the virus spreading, the Chinese economic engine is sputtering and no one’s rolling out the welcome mat for Chinese tourists. It took 105 yen to buy a U.S. dollar last fall, now it takes 111 yen to buy a buck.
That’s not a big move, but it’s not the right direction if you’re looking to protect your capital.
And then there’s China, the epicenter of the coronavirus and a country that was decelerating before the epidemic began.
The Chinese yuan has moved back and forth between 6.20 and 7.00 per U.S. dollar over the last several years. The country manages its exchange rate, setting a trading range every day, so state officials specifically determine the valuation.
With the virus bringing parts of the country to a standstill and more than 750 million people living under some level of quarantine, it’s hard to see how their GDP growth remains positive this quarter. To reignite activity, the Chinese are likely to devalue their currency.
But none of these arguments against other currencies tell me that the U.S. dollar is doing great, they just tell me that everyone else has more immediate issues. Which explains why the dollar keeps trading higher, and the 30-year Treasury yield just dipped below 2%, and now pays less than inflation.
With U.S. GDP growth hovering around 2% while our federal deficit explodes to $1.4 trillion and our national debt climbs above $23 trillion, how long can this last?
Investors around the world are looking for safety. Today they found the U.S. dollar. It’s been the choice for years, but that can’t last. I don’t know if investors will move to a cryptocurrency, gold, another currency, or perhaps hard assets like real estate. But if we don’t get our house in order they will eventually move, and then it will be our turn to deal with a falling currency.
The post All Hail the Mighty Dollar… Or Not appeared first on Economy and Markets.
February 24, 2020
The Coronavirus Goes Global
When such a deadly virus hits, the first stage is always containment, as has occurred rapidly in China. But when it starts to spread past its origin more rapidly, it gets a life of its own. At this stage of the coronavirus’s spread, it’s better to focus on mitigation through sanitation and less direct social contact. Governments should support businesses and stop closing things down to make the economy and panic worse.
That’s where it seems we are suddenly today, after the coronavirus accelerated into Italy after doing the same in South Korea last week. The last week has seen the fastest acceleration outside of China.
The pandemic stage starts when the disease simultaneously starts spreading in multiple countries and regions. That’s why many experts say that stage has just started.
And yes, the “markets on crack” are finally waking up…
South Korea is down today 3.9%, and the same goes for Australia, at 2.3%, and Hong Kong, at 1.8%, with other Southeast Asian countries and India down 1% or more.
The Nasdaq opened up down 3.3%, the Dow down down 2.9% and the S&P 500 down 2.7%.
The major European indices are down similarly, from 3.2% to 3.9%.
The Shanghai Composite is down the least, 0.3%, with signs of marked slowing of the infections in China.
The coronavirus has now broken out in 31 countries. Cases in South Korea are now at 833, with 233 just on Monday, and 7 now dead. Holy crap!
Japan added over 60 in just the last week.
In Italy, the new shocker is cases reported, at 140 and rising.
Venice shut down a major carnival in response, and people weren’t happy about that.
Milan locked down 50,000 people.
Four infected U.K. passengers from the Diamond Princess ship (which had 695 infections) in Japan came home, with three of them already dead. A woman in the U.K. was harshly beaten for defending an Asian friend from strong racial attacks by a group of Brits.
Underreported Numbers?
Overall, reported deaths are now at 2,442; infections are at 76,936. Of course, the actual number of infections is much, much higher, as many more people with mild symptoms don’t go to hospitals or doctors at first. It’s like the classic “under the surface” picture of an iceberg.
Three well-connected experts have told me or sources I know that the infections are more like 10 times what China is reporting – suggesting as much as 800,000 infections.
One of them is my friend John Thomas, of The Mad Hedge Fund Trader. He has agreed to share with our subscribers a report on a conversation he had on a plane with an expert doctor from Wuhan, the town of origin. You can get it at this link: https://www.madhedgefundtrader.com/ht-hsdent/.
A study by Imperial College London estimates two-thirds of cases have not been reported. That would suggest at least 230,000 infections. A study by doctors from Henan Province, north of Wuhan, revealed that a woman with no symptoms over 19 days spread the infection to five family members.
The normal incubation period without symptoms has been estimated at two weeks… now it looks like it can be longer, up to 24 days. This long incubation period is the most dangerous part of this disease – not its lethality rate compared to others. It means that it can spread faster without being visible to contain or mitigate easily… and that’s exactly what appears to be happening.
The global areas most projected to get hit at this point are East Asia, Mongolia, East Russia, Northeast India, South Africa, Northern Europe, New Zealand, and the very low population in the upper northwest of Canada. Bill Gates has warned that this could end up killing 10 million in Africa. The U.S. and Australia look the least vulnerable thus far – where the great majority of our subscribers are.
The Big Test
Conversely, there have been no reported cases in recent days in 24 of 31 provinces in China, including Beijing and Shanghai.
In the last day, there were only 398 in Hubei Province (Wuhan), down from 630. Hence, they are relaxing some business and travel bans there. That brings hope that this can be contained and mitigated as it spreads faster globally.
The stock markets are projected to be down over 800 after the open on the Dow this morning. The biggest fear is the breakdown of supply chains in China and now globally in places like Korea and Japan.
Important bottom trendline support will be tested today. I will have an update on that on Wednesday. Stay tuned!
The post The Coronavirus Goes Global appeared first on Economy and Markets.
February 21, 2020
On the Markets: Stay Skeptical
Our eyes these days are on the Fed’s balance sheet, and they’ll continue to be, as we march forward through this repo and coronavirus crisis. What we’re seeing is a slight easing back and now flattening on repos, but the Fed’s still buying Treasury bills. That all combines to a mild positive for stocks, but it hasn’t been enough to show the likely next big surge quite yet. Keep an eye on this space, however, and on next week’s Boom & Bust. We’ll be tracking the balance sheet every Friday after the updates come late on Thursdays.
Short-term, everything’s politics, politics, politics. The Democratic primary continues on, with Bernie Sanders now looking like the clear frontrunner and the most likely nominee to face down Trump. That’s … not good for the banks or stocks, and the latter could be in for a serious correction if it starts to look like Bernie could take the election in November. I’m not exactly sold on that – Trump remains awfully formidable – but there are swing states beyond Wisconsin, Pennsylvania, Ohio, and Michigan, and a few of those states that usually go to Republicans (like Florida!) might be up for grabs in ways they haven’t been in recent elections.
But as I said, Trump remains formidable, and my understanding is that he’s planning a round of tax cuts for the middle class sometime around September. I’d do it earlier if I was him, but either way, more cuts would be good news for the markets and the economy: incentives for everyday households to invest. Of course, they’re investing in a bubble, but not everybody understands that like we do.
My advice: Keep with the markets but be skeptical. There’s simply too much going on right now that can change the course of where things are going. This is the final straight-up phase. For traders and short-term investors, there’s good potential to buy on a likely near-term correction.
We’ll have more next week.
The post On the Markets: Stay Skeptical appeared first on Economy and Markets.
February 20, 2020
Drowning in Student Loan Debt
The federal deficit reached just over $1 trillion last year, is expected to top $1.3 trillion this year, and will likely be at least $1 trillion every year for the rest of the decade.
And that’s if everything goes right. Throw in a recession or unforeseen circumstance (cough, coronavirus, cough), and things could get worse.
Which makes me wonder why in the world we’re running a deficit to do things like forgive student loans when the unemployment rate sits at 50-year lows?
I’m not talking about a presidential candidate’s proposal to wipe the slate clean at some date in the future. I’m pointing out income driven repayment (IDR) programs in place today. Under these programs, borrowers can commit to pay a portion of their income toward their student loans for 10 to 20 years (the details depend on their employment) and any balance left over is “forgiven” by the federal government.
I put “forgiven” in quotes because the debt doesn’t disappear, it’s transferred to you and me, the American taxpayers.
The worst part is that most people joining IDR programs aren’t struggling young people who racked up some debt during undergrad; they’re people who went to graduate school, which is much more expensive and you can borrow to pay for living expenses in addition to tuition and fees.
The numbers are staggering.
The Congressional Budget Office (CBO) recently reported that American taxpayers will be on the hook for just over $200 billion in forgiven student loans over the next 10 years. It’s worth noting that in 2011, we were expected to cough up $1.4 billion, a number that had ballooned to $11.5 billion by 2016.
By the end of the decade, the CBO expects 81% of the IDR participants to be graduate students, with an average of $92,000 in loans.
No one’s minding the store. No one is saying “no” to the schools or the borrowers. And they have no reason to shut this off themselves. Schools are raking in billions, and students don’t care, because after a certain level, the money doesn’t matter.
If you’re in graduate school pursuing your master’s in social work, then I applaud you for dedication. But I also understand that you won’t make much money. (And you should understand that, too!) If you plan to enroll in an IDR plan after school, then you know that the most you’ll ever pay toward your student loan is 10% of your income each month. At $60,000 per year, that’s $500 a month.
With that as a backdrop, where’s the motivation to hold loans to a minimum? As long as your borrowing exceeds the balance by one dollar that puts your loan payments over $500 per month, then you might as well borrow $1,000, $100,000, or even $200,000 more than that, because your payment will never change. Grad students who expect to be in IDR programs would be crazy to do anything other than borrow all they can. Why work during school when you can simply borrow more and hand the bill to taxpayers?
It’s a mess of a system that’s made worse by the complicated nature of the law and regulations surrounding it.
Through last June, the Department of Education reported it had processed 102,051 applications for loan forgiveness under income-based repayment plans. The department approved 1,216 and rejected over 100,000. Most were kicked out because their types of loans don’t qualify, even though their loan servicer confirmed that they did.
So now we have tens of thousands of borrowers who made payments according to the law as explained to them by their servicers, who now owe the principal and interest they didn’t pay, as well as interest on those amounts.
I’ve got an idea. How about we kick IDR programs to the curb completely, require schools to bear the weight of graduates who don’t pay back their loans, and make the legal requirements for any program clear enough to be understood by an eighth-grader?
Of course, that would require an act of Congress, whose members are otherwise engaged in political infighting for re-election… which always seems to be the case.
While they fight, our debts pile up. One day, those debts will drown us all.
The post Drowning in Student Loan Debt appeared first on Economy and Markets.
February 19, 2020
The Fate of Final Rallies
I have been talking recently about how this final blow-off rally since the sharp 20%+ crash into late December 2018 is tracking very close to the one that occurred from late October 1998 into late March 2000.
That correlation suggests that this rally could last into late May or so, at the height of the normal annual seasonal cycle that says, “Sell in May and go away.”
But wait. This is an election year and a highly contested one, with every incentive for the Donald to pull out all the stops to win: consumer tax rebates and incentives for investing in stocks near the top of the greatest bubble in modern history… Does that sound rational to you?
Donald’s middle initial “J” may go from standing for “genius” (his term) to “jerk.”
I showed in a recent article that the trajectory of this final blow-off from late December 2018 would project to a peak around late May of this year. But odds are that it should go longer in this unique election year with so much incentive for more stimulus, from the repo crisis to the coronavirus.
This table shows the final rally of every S&P 500 broader index bull market without a 20% correction since 1949 after World War WII. The bubble market of 1987-2000, which more technically speaking began in October of 1990, is most relevant in time and gains to this one.

The range of the final rally gains are 29% to 68%. The average crash after has been 42%. But, mark my words, this one will be the greatest you see – and closer to 1929-32, between 70% and 90% after such an unprecedented bubble.
If this final long rally compares to the last tech bubble one from October 1998 into March 2000, it would last about three to four more months into late May to late June. The gains from here would be about 15% for the S&P 500 at around 3,900 and 20%+ for the Nasdaq at 11,500-12,000.
This final bull market peak is now months away, not years, as many are suggesting. I see a peak between late March at the earliest and February of 2021 at the latest. Best range would be 11,000-12,000 between late May and the election.
If I had to give my pick this early in this late game, I would pick between late August and late October, at 11,000-12,000 on the Nasdaq.
We’ll see… I examine more scenarios and iterations in the March Boom & Bust newsletter, which will hit your inboxes late next week.
P.S. If you’ve been looking to break into tech investing while this bull market continues to rage, on you’re going to want to check out Lance Gaitan’s live webinar on February 25th. This is where he’ll be showing viewers how to uncover bigger, faster and safer tech profits without risking a ton of money on speculative penny stocks or waiting 10 years for a company to break through. Click here to reserve a spot.
The post The Fate of Final Rallies appeared first on Economy and Markets.


