
Harry S. Dent Jr.'s Blog, page 9
December 25, 2019
Asia Dominates Next Four-Season Cycle
On Monday, I talked about how global growth is slowing even with the leaders of the emerging world: first China, now India. But the flip side is that Asia will be the dominant leader for the next spring boom from 2023 into 2036-37 and broader into a plateau between 2055-64 before the next winter season and global depression sets in.
This trend was foretold by my 165-year East-West Cycle even before China’s massive urbanization explosion from 1985 to now, and Japan’s and other Tigers’ before in East Asia.
This chart shows the three major sectors of Asia and the clear progression is from East Asia (dominated by China) to Southeast Asia to South Asia (dominated by India).

What Does This Mean?
Note here that in 1950, East Asia was the largest region by far with 690m (million) vs. 490m in South Asia and a mere 160m in Southeast Asia.
East Asia is dominated by China, but includes the Tiger countries: Japan, Hong Kong, South Korea and Taiwan. It peaks first, at 1.75b (billion) in 2030, and that’s due to China whose workforce already peaked in 2011.
Southeast Asia peaks next at 790m in 2060. That includes Indonesia, the Philippines, Singapore (their original Tiger), Malaysia (late stage Tiger), Vietnam, Cambodia, Laos and Myanmar.
Last comes the largest, South Asia, at 2.45b, peaking in 2065. That includes India, Pakistan and Bangladesh. India peaks in 2060, like Southeast Asia. It’s Pakistan that stretches the peak to 2065.
These three sectors that largely make up Asia peak at 2055 at 4.86b, with South Asia at about half of that. Note that by 2100, South Asia at 2.22 billion is larger than East Asia (1.30b) and Southeast Asia (740m) combined. China will have fallen from a peak of 1.47b to 1.07b and India from 1.65b in 2060 down to 1.45b. India will be the largest country in the world and Pakistan fourth or fifth at 403m. Hence, South Asia will have 2 of the top 5 countries in the world.
Here’s the Bottomline
South Asia will be the largest region of Asia and the most dominant by 2065 when the next winter season sets in globally…
Hence, our strategy is obvious: focus for stocks and real estate in Southeast Asia and India/South Asia for the spring and fall booms of the next four-season cycle which will be shorter than the last one, more on the historical 60-year inflation rhythm. (For more on this, see the July 2019 issue of The Leading Edge.)
The next fall bubble boom will hit between 2046 and 2064, likely with a blow-off bubble between 2060 and 2064, and be focused most in India and Pakistan in South Asia.


December 24, 2019
I (Sort Of) Want an Airstream for Christmas
I’ve written for years that I want a towable trailer, but not just any one. I want an Airstream. My wife thinks they look like rolling baked potatoes due to their aluminum outer skin, so she calls them Bak-o-Foil.
As long-time readers and those who attend our conferences know, I’m not dying to camp in national parks, or join the legions of “Airstream Addicts” that go to the Albuquerque Balloon Festival. I want a trailer so I can park myself in front of my kids’ homes when they produce grandchildren.
It hasn’t happened yet, but I’m a planner.
I don’t think my wife is on board because I don’t see a trailer under the tree, or even in the yard. She’s pretty smart, so she probably knows the truth. It’s not really the Airstream I’m after. I want time.
When my kids were young, I was always aware that they were with us for just a brief amount of time, and even then, they were pulled in many directions by sports, clubs, and friends. I never wished for them to be older. I often told my youngest that I was going to take her back to the store and trade her in for a younger version. I knew we had just a few short years before they’d become young adults and have commitments of their own.
Eventually, they’d plan their visits home by the day, or by the hour, or not at all. Not out of ill-will, but out of necessity as they created their own lives.
Through luck and some odd timing, all three are home today, it’s the first time we’ve gathered in a year. I intend to spend every minute with them, even as I devise ways to get more of their time in the future.
Time is one of the love languages, or the ways in which we show we care for others. I hope that you share the gift of time with those you care about this Christmas even if, like me, you don’t get an Airstream.
Merry Christmas!

December 23, 2019
Global Growth Falling: First China, Now India
The central banks’ job of keeping this big, fat ugly bubble going is just going to get harder. Not only are they fighting record debt and falling demographic trends in the developed world – with my hierarchy of indicators all pointing down – they are fighting record debt in the emerging world and slowing growth there near-term, despite favorable longer-term demographic trends. For 2018, the growth rates in the leading emerging countries were lower than we’ve seen for a long time: China 6%, Indonesia 5%, and India 4.7%.
China has clearly been both the biggest contributor to global growth and to the eradication of poverty. But they have also been the greatest polluter. China has been on a highly stimulated urbanization explosion since the early 1980s, from 20% to 60% urban at a very rapid rate of just over 1% urban gains per year. But they have seen the greatest explosion of debt of any major country, and overbuilding that makes past orgies in Japan and Southeast Asia look lame.
China’s peak growth rate was 15.3% in the 1st quarter of 1993. After falling off into around 2000, it surged again to 15.0% in the 2nd quarter of 2007 with a growth rate of 11.4% for that full year. After the global financial recession (GFC) into 2009 and a fall to 6% (a recession for China), it had one final surge to 12.2% growth into the first quarter of 2010. It has fallen steadily ever since now back to 6.0%, the lowest since 2009. Forecasts are for a fall to 5.6% in 2020. I think it’s likely to be lower than that, and then I see negative rates by 2022. That will be a depression for sure for China.
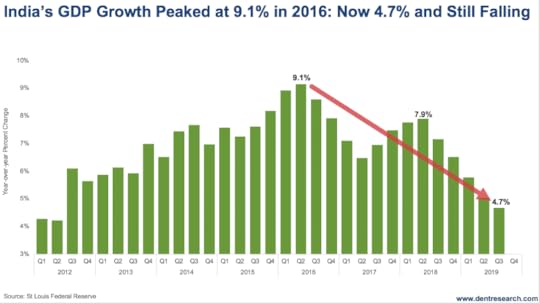
But India took the mantle after the GFC and reached a peak growth rate of 9.1% in 2016. Now that has fallen to 4.7% in the 3rd quarter of 2019. That certainly looks to fall further, although Modi is pushing a $1 trillion infrastructure plan for the coming years to help stimulate.
China has the highest debt of any major emerging country, especially its whopping 168% of GDP in corporate debt – the most likely to default with $17 billion per year already in 2018 and 2019, and looking to rise rapidly. India is now having a lot of unrest over Modi’s anti-Muslim immigration policies; that can only weigh on its economy and consumer sentiment.
My number one trigger for the next larger global crisis or great financial depression is corporate and government debt defaults in the emerging world…
That’s even harder for developed country central banks to fight. How is the Fed going to stop a real estate crash in the most overvalued market in the world when first-time, naïve Chinese households realize that their speculative empty condos are going to fall and panic selling sets in? Have they been able to stop the hyperinflation crisis in Venezuela or the currency crash in Argentina? There are more of these coming until China succumbs, and then it’s game over.
I say this bubble peaks sometime in 2020 and what I now call the “tipping point” for short-term and long-term trends – and as early as late January or February. Trump’s the wild card that could attempt to stave it off the latest into the election. Even in that case we will be crashing by early 2021 at the latest.
Get ready for the failure of the biggest something for nothing experiment and Ponzi scheme in monetary history. I’m rooting for that, as it’s the only way to get back to a deleveraging, or detox, and a natural cycle of innovation and growth again…
No more debt and financial bubble denial!

December 20, 2019
Forecasting Financial Asset Bubbles
Today’s rant is a preview of January’s Boom & Bust, which we’re putting out to subscribers early this round because of the holidays beginning next week. I believe that this upcoming issue is one of the most essential and all-encompassing reports on the current financial bubble, both in terms of how we got to this point and what it means for our future.
So if you are a subscriber to the newsletter, I hope that you read it. And if you’re not, I hope you are enticed enough by this preview to subscribe today. It may actually be in your inbox by the time you read this email.
Anyway, the focus this month is on the difference between quantitative easing and its impact creating financial asset bubbles, and how the central banks’ risky stimulus policies ended up creating this particular bubble even though that was not at all the intent.
Normal stimulus policies focus on expanding bank lending through money supply expansion – and that didn’t work this time with our economy at peak debt. This is why we got financial asset inflation instead of the consumer price inflation gold bugs expected from such massive money printing.
Now we’re near the top of the greatest financial asset bubble in history, and paradoxically in a time of the weakest economic recovery in history. Those two things go together like oil and water, so we’d be best served to move forward trepidatiously and with some serious caution.
Watch this week’s video to learn a little more, and click here to subscribe to Boom & Bust if you have not already.

December 19, 2019
We Need More Global Shopping
Years ago, I can remember my mom coming home from a day of shopping around the holidays and announcing that she’d saved over $600. My dad immediately asked the obvious question. How much had that savings cost?
As we peruse the online and brick-and-mortar malls this last week before Christmas, we’re barraged with seemingly great deals that announce how much we’ll save if we simply part with some of our cash or agree to take on debt. Even though I expect a strong holiday season due to low unemployment and a strong stock market, there’s one big data point that shows, on a longer trend, we’re just not that into it.
Americans are saving more money than in years past, and we’re not alone. While this helps us individually, it comes with some obvious (and some not so obvious) side effects.
According to the Organization for Economic Cooperation and Development (OECD), in the early 2000s Americans saved between 3% and 4% of their income. That number shot up to almost 9% in 2012, in the aftermath of the financial crisis, and then settled into a range between 6.75% and 7.75% through 2018. Now, it’s creeping higher. The OECD expects Americans to save just over 8% this year, and maintain that rate in 2020 and 2021.
While that might sound like a lot, consider that the Swiss will save 17.65% of their income, the Swedes 17.14%, and the Germans 10.95%.
On the face of it, money we save is money we don’t spend, which reduces economic activity and GDP. That’s one of the reasons the Fed lowers interest rates, to induce us to spend more by lowering the return on our savings. Today, the average interest on a savings account is 0.09%, while inflation is running about 2%. Every year that we leave $1,000 in a savings account, we earn $9 but lose $20 in purchasing power.
And yet, we’re still socking it away faster than we did in the mid-2000s.
Obviously, we have a different set of priorities than the Fed. We’re preparing for the future. With the huge Baby Boom generation squeezing through the retirement door, millions of Americans are trying to save as much as possible to fund their golden years. And finding opportunities to grow those nest eggs is exactly what Harry and I set out to do for our Boom & Bust readers.
At the same time, the Millennial generation isn’t buying homes at the same rate as previous generations, which keeps some of their cash on the sidelines. Overall, we’re getting older, following the footsteps of the Europeans. If our birth rate and family formation cycles don’t turn up soon, we can expect to look a lot like Germany in years to come.
But we’re not putting our extra cash into savings bonds. We like things a bit more exciting in the U.S., so we’re opting for equities.
While the Fed isn’t doing a good job of persuading us to spend, the central bankers have done a great job of pushing down interest rates so far that we’re moving out on the risk scale with at least a portion of our savings. We’re doing whatever we can to earn returns, which means buying longer maturity bonds, lower-quality bonds, and equities. As more money chases each category, the prices go higher.
At least, for a while.
Japan serves as an extreme example of where this eventually leads. The country posted sky-high savings rates in the 1970s, typically socking away more than 20% of their income. At the time, they were a nation of households with few children. Now they’re aging, and the savings rate dipped below zero in 2014 before recovering to just over 4% this year. Seniors represent more than 25% of the population and are dis-savers, they spend more than they earn. They’re also price-sensitive, which is why Japan has been in a deflationary funk for decades, with no end in sight.
To be sure, our birth rate is well above that of Japan and Western Europe, so we won’t have the same level of population imbalance that exists in those countries. But we’re not the only other country facing issues.
China will transform from a global growth engine to drag.
The Chinese regularly save more than 30% of their income, which fuels domestic investments through bank lending. But like Japan, they’ve had an exceptionally low birth rate for decades. When the aging Chinese become a nation of dis-savers, they will curb domestic economic growth and make China even more reliant on exports than they are today. Without a growing world economy to buy more of their stuff, things might not go well.
So while you peruse Amazon or the local mall to get those last few gifts, consider bumping up your spending limit a little bit for the greater good. And then when you gather with family at Christmas, encourage the younger generation to have kids. We’ll need the extra workers, and shoppers, in the years to come.

December 18, 2019
Housing Bubbles Are Bad for the Economy…
How can the same houses go up far faster than inflation for decades, and that possibly be good for an economy? It only benefits older people who bought earlier, and the affluent who buy the most expensive ones that tend to bubble the most.
I was just in Australia speaking to my favorite country and people. Their only fault is that they are currently “high” on their real estate bubble: Their bubble is greater, and 67% of their net worth is in real estate vs. 25% here. Only China is higher at 75%.
So, I asked them the same question that I posed to you at the top of this letter: How can this be good beyond the speculative gains that cannot be possibly be sustained and more than debt bubbles? People, especially younger ones, have to spend more of their budget on mortgages and rents – leaving less for their kids’ education, vacations, dining out and entertainment. Companies have to pay higher salaries to offset and that makes them less competitive with other countries.
Despite my clear stand on this topic, even I was surprised at this chart. The median age for home buyers since 1981 has risen from 31 to 47. Most buyers today are over their kid-raising cycle when they most need those houses and more space. That doesn’t make sense… except in QE and “Bubbleland.”
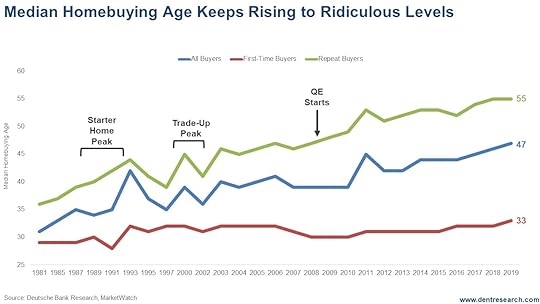
In the 1980s, home buying was dominated more by the Boomers in their starter cycle that peaked in a plateau between 1988 and 1992. It started at age 31 for the typical or median buyer in the middle (blue line). But the trade-up or repeat buyer trend (green line) was also ascending… and caused a spike up to 38 into 1993. As the starter home buyers fell off in the 1990s forward, it was natural for the peak buying age to stay higher.
But then the first housing bubble from 2001-2006 caused it to continue to rise to 45-46 as the young could even less afford. Since QE from 2009 forward, the median age continues to rise as homes continue to get less affordable, even though the Millennials are rising into their starter home peak into 2024. Note that their starter home median has risen from 31 to 33. (Zillow pegs it at 34 and still rising.) Many Millennials are waiting so long with high prices, low inventory and tighter lending – that they just skip the start trend and buy their trade-up home to start.
Their will be pent up demand for starter homes for the Millennials after the great crash ahead. But it won’t last long. Meanwhile rentals will hold up the best in the great depression ahead, as even fewer younger people can buy in a downturn with near non-existent credit available.
Healthy real estate prices are 3–4 times income. Up to that, it is a good sign that a city or area is attractive. Beyond that, and especially at levels of 8-10 times income and higher, it is an impediment to the economy and to the people who live there, especially the young new families…
So, knowing all this, let me put another question to you: Who’s more important for our future: aging Boomers like me, who own appreciating real estate and are set to die over the next two decades, or the rising young generations?

December 17, 2019
Seasons Greetings, Unwilling Lender
I haven’t worked in a traditional office in a long time. I miss some of the camaraderie, the ability to bounce ideas around, and the occasional happy hour. But I don’t miss some of the personnel issues that pop up, like friction among co-workers, bad-smelling lunches wafting through the office, and the annual Secret Santa.
I’m not a Scrooge by any stretch. Christmas is my favorite time of year. But forced gift giving always had a bad vibe. In big offices, those participating often cut straight to the chase. Under things they wanted, they simply listed “gift card.” Awesome.
If you’re like me, then I’ve got bad news for you. In the world of finance, you’re the Secret Santa, and hedge funds are the gift recipients. You’ve been forced to give them gifts for almost a decade. When you stopped giving in September, it sent the credit markets into a tizzy, so the Fed dipped into your pocket and made you give some more.
The term “hedge fund” hasn’t meant a fund that only makes hedged investments for a long time. We use the term very loosely to apply to private capital firms and those that only take accredited investors. They come in all shapes and sizes, but many of them have one thing in common: They use borrowed money, or leverage, to turbo charge their returns.
If a fund has $100 million to invest and earns 8%, then it earned $8 million. Not bad. If the same fund borrows an additional $40 million and makes 8%, then the fund earned $11.2 million. That’s better. The fund has to pay for borrowing in the form of an interest rate, which is where we come in.
To borrow the cheapest money possible, hedge funds and others that run leveraged (or levered, as it’s called) portfolios borrow money on a very short-term basis. As in, overnight. This drives their interest cost close to the Fed Funds rate. They simply re-borrow, or perpetually borrow, every day with a one-day maturity.
Recently, these funds were paying 2% to borrow overnight. If the fund in the above example paid that price, it would be $800,000. Netted against the $11.2 million gain, the fund would have earned $10.4 million on a principal balance of $100 million, for a 10.4% gain. That’s a lot better than 8%!
But someone has to lend the funds the money. That’s where you and I come in as unwilling lenders.
Typically, the money comes from banks that use their excess reserves, the amount of money they have in excess of what’s required by the Fed. The banks built up huge excess reserves as the Fed printed money and bought bonds from 2009 through 2015. This created a big pool from which hedge funds could borrow at rock-bottom rates.
While we earned near zero on our deposits and fixed income thanks to the Fed, hedge funds have been able to borrow for a song and goose their returns in the equity markets. The process distorts the fixed income market because the Fed crams down rates, and distorts the equity markets by providing almost free cash that hedge funds use to drive up equity prices.
The entire process creates weird financial bubbles, as I outlined in the December issue of Boom & Bust.
But like all parties, this one came to an end in September… at least for a moment.
The banks that had been lending reached a threshold in their excess reserves and weren’t willing to lend anymore. The hedge funds panicked and bid up the cost of borrowing to 10%. They needed the money to make good on trades.
You’d think this would be a good thing. If the hedge funds want to borrow to invest, they should pay for the privilege, and it should be at miniscule rates. But the Fed was having none of it. They want the party to last forever, so they did what they know how to do, and started buying bonds again. Since September, the Fed has pumped about $200 billion into the market, buying up Treasury bonds and making cash available to hedge funds so they can keep driving up equities.
As for you and me, we’re the ones footing the bill in the form of paltry earnings on our savings and below-inflation interest rates on 10-year bonds.
We do get to piggyback on the hedge funds as they push the equity markets higher, but that won’t be much comfort when the bubble finally busts and prices fall in line with economic growth, which are two scenarios Harry’s been predicting. By that time, many of the hedge fund guys will have cashed a bunch of bonus checks and be spending time in the Hamptons.
Chances are, they won’t even send us a thank you card.

December 16, 2019
Growth of the Asian Tigers
I always remind people and economists that Japan was the first Asian Tiger – the first to urbanize rapidly on an S-Curve to $40,000+ GDP per capita PPP and DC (developing country) status in just under 30 years. When I speak in South Korea, I tell them: You are Japan on a 22-year lag for the peaks in your Baby Boom generations and near full urbanization. And they have done the same.
Japan’s Spending Wave peaked in 1996. South Korea peaked recently, in 2018… 22 years later. Taiwan will be the last to peak in a plateau between 2023 and 2026. Basically, the unique and rapid Tiger trend is over.
But now these are the fastest aging DCs in the world, followed closely by many countries in central, southern and eastern Europe.
 After flattening for the last two decades, Japan’s workforce is projected to fall 50% by the end of this century, 2100. It will lose 20%, or about 13 out of 68 million, just in the next 20 years, by 2040. Taiwan’s trends are similar.
But the surprise here is South Korea as they were born, urbanized and peaked 22 years later. They will decline by 61% by 2100, and 24% by 2040.
The least aging occurs in Hong Kong and Singapore, as they are both high English-speaking and magnets for professional immigrants. Hong Kong will fall only 26% by 2100, all of that by 2065. Singapore will be 31% with most of that by 2065.
The flip side of such rapid demographic booms and urbanization is that the Baby Boom there went through baby shock. People who move to urban areas and become more affluent have fewer babies. They are much more expensive to raise there, and you want them to go to Harvard! So, you have one or two, and more professionals have none, especially the Millennials there. This happened so fast in these Tiger countries that they had a bigger reaction, and hence faster aging to follow.
There is one country that I call a late blooming Tiger: Malaysia. It has recently broken the DC barrier by reaching $32,000 GDP per capita PPP. It is not as rich as its other Tigers at $40,000+, and it urbanized at a more normal rate on a linear path like most developed countries. It is 77% urban and has 10% or so urbanization potential left and still has positive workforce growth into around 2035-40.
I don’t see any other emerging countries of substance following that S-Curve GDP path from urbanization, not even China. Malaysia is more the model for other Asian emerging countries like India and China that have the potential to become borderline DCs on a straight line GDP/urbanization path – and that’s going to be the biggest thing to happen in Asia as it continues to ascend to dominance on my 165-year East/West Cycle into 2150.
The main point here: All of this important stuff is highly predictable! The next global boom is going to see the West fade faster, especially Europe, East Europe – and Asia lead the ascension of the emerging world even as it’s “star” Tigers fade fast.

December 13, 2019
Gold’s Big Bottom
I’m finally caught up on sleep after Australia, but I’m still thinking about all the good times from that trip. You get to meet so many smart, innovative people when you go out on these speaking tours, and I always love Australia because that country never fails to bring out these great types of crowds.
Anyway, I was talking with a subscriber after one of my presentations over there, and she introduced me to a technical analyst she uses for trading who employs some real original indicators combining shorter-term time cycles and patterns. This was really impressive stuff, and I talk about it all in this week’s rant.
To make it quick: He’s seeing high probability signals that both gold and silver are bottoming out right now and heading higher again into 2020, maybe as late as the fall. How high? Say 80%. That’s Adam O’Dell territory. Only Adam can find short-term probabilities like that!
That’s serious, but the good news? The smart money is already buying the beaten-down mining stocks, so gold and silver should be next to run and look to already be starting with a minimum target of $1,720 on gold, maybe even $1,900. This also has implications for Treasury bond yields continuing to rise a bit which will be good for locking in that safe haven play in 2020 when we finally see stock peak.
Also in this week’s clip, a preview of the January 2020 Boom & Bust, which, for your subscribers, should hit your inboxes just before the holidays and your snail mailboxes a few days before the New Year. If you haven’t yet, right now would be a great time to make sure you have access to our critical market research and analysis, as we enter what could be the wildest year in economic history.
You’ve seen me talk about Money Velocity before. Well, now I’m looking at Money Velocity around the world. So, keep an eye out for that.
And have a great weekend.


December 12, 2019
Avoid the Boring Hack
Years ago, Samsung came out with a voice-controlled television. My wife was appalled. Who in the right mind would want a device that sits in the house and listens to everything that goes on?!
As it turns out, lots of people do.
Her issue was that someone, somewhere, could listen in, and probably already was. Her fears were confirmed when the company acknowledged the televisions sent some recordings to the mother ship for analysis so they could perfect their voice recognition software. But don’t worry, they don’t record much and they keep it really secure. Right.
Since then, tens of millions of people have added smart speakers to their homes, specifically inviting devices that listen to every word. Ostensibly these devices wait for their “wake up” phrase, but as Amazon was forced to admit, they have lots of recordings of our everyday lives, and some of those playbacks would be quite embarrassing.
These corporations might be tone deaf to privacy concerns, or even behaving badly, but they’re not the biggest threat. Your best chance of getting hacked comes from old stuff that’s probably sitting close to you right now, like your printer.
You can fix it, but chances are, you won’t.
There’s a phrase in the tech world that’s supposed to be funny. “The ‘S’ in IoT stands for security.” IoT means the internet of things, referring to devices connected to a hub, like your home network, which is then connected to the internet. Obviously, there’s no ‘S’ in IoT, which is the point. There’s no security.
One estimate puts the number of IoT devices at 7 billion today. That number’s expected to more than triple to 21.5 billion by 2025. Many manufacturers of home cameras, internet-controlled lighting systems, and other devices try to build in security measures. Many don’t.
The cheaper devices use off-the-shelf security approaches and commonly borrow from other applications. When bad actors find a security flaw in one, they can access all of them. Paying a bit more for better equipment can help you avoid this, but it only goes so far.
The real problem is that all devices are hackable, it just takes time. The longer a device is on the market, the more time hackers have to find a way in. Printers are a great example.
As long as my printer spits out what I want, I don’t think about it very much. Even though it’s a couple of years old, the thing can be connected to the internet so that I don’t have to fuss with messy wires. That’s convenient for me as a user, but it also offers a point of entry for hackers.
They’re not interested in what I print. They want a point of entry to my home computer network. Once there, they can rummage around looking for passwords and userIDs for bank accounts, investment accounts, and other things that I might have stored in my contacts or on a spreadsheet. Sound familiar?
Or it could be that the hackers don’t want my stuff at all. Instead, they run programs in the background of my network, posing as me through my IP address to launch malware and attacks on other systems around the net.
It turns out that I have the power to stop most of the attacks on my devices and networks, and so do you. We just need to follow two simple steps, which most of us won’t.
Set and update the passwords for internet-connected devices. Most people never change the passwords that come with their equipment, and those that do rarely update them. This makes passwords easy to figure out and makes the equipment immediately vulnerable.
Update the software for any internet-connected device on a regular basis. Software updates are annoying, but that’s how manufacturers fix security loopholes in their products. If we don’t update, then we’re leaving ourselves vulnerable to known flaws.
As for passwords, they come with problems of their own. If we keep them online, then they’re part of our cyber security issue. To fight this, we can write them down, which is something most security experts warn against because anyone who comes across them then has the keys to our kingdoms.
Thinking about the endless possibilities can make any efforts to fight hackers seem futile, which is exactly what they count on: inaction. Don’t let them win. Set aside a little time to inventory your connected devices and consider if you’ve set and updated passwords, as well as updated the software recently. Spending a little time on it today might be boring, but it could save you from huge headaches down the road.
P.S. Over the next few weeks, keep an eye out for Harry Dent’s Cyberterrorism Survival Manual, where he’ll expand on a few of the issues I brought up today and provide you with an excellent resource to protecting your most personal and financial information.


