
Harry S. Dent Jr.'s Blog, page 7
January 22, 2020
Dark Window Update: Nasdaq 11,000 by Late May or 13,500 by Late September
I almost always have two shorter-term scenarios, as there are more cycles and politics matters much, much more in the short-term. My megaphone vs. continued blow-off scenarios kept staying in play, back-and-forth, until the Fed repo crisis injections forced the blow-off scenario to win. The final confirmation came last Friday with the end-of-day rally to break out of a channel pattern to the upside.
My original dark window scenario from the January Boom & Bust issue played out, just having taken a little longer than my first expectation for a late 2019 peak.
I thought the final blow-off, orgasmic phase of this unprecedented bubble bull market started when Trump won by surprise in November 2016… nope! It started after that 25% sharp correction into late December 2018 – just as the last tech bubble final blow-off started after a similar sharp correction into late 1998.
That final and steepest fling occurred from October 1999 into March 2000, with the $120 billion Fed injection for the Y2K scare. That would have been more like $300 billion in today’s economy. But unlike the late stage crypto bubble today, the internet stocks were a part of the Nasdaq index, and hyped it much more back then.
As I covered last Wednesday, the repo crisis forced the Fed to reverse its tapering, and it has injected $425b (billion) just between mid-September and mid-January with plans from February forward to inject $60b in T-bill purchases, $20b in bonds and $30b+ in repos. That’s $110b+ a month compared to $106b average since mid-September and $60 billion at peak QE in 2014. And it’s likely to be more on the repos.
Look at the correlation between the final rally in the 2000 tech bubble vs. the one today on a logarithmic chart as these are in two different realms of numbers and percentage gains.
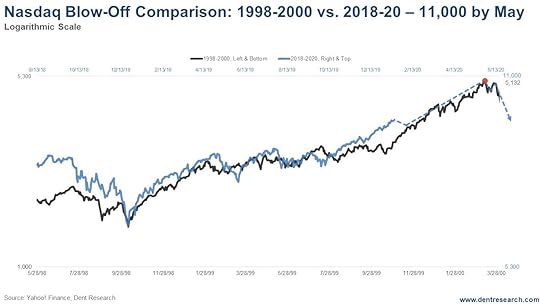
The current pattern would project a peak around late May near 11,000 Nasdaq. That’s just above my top trend-line projection for the Nasdaq, around 10,400 with a classic overthrow finale.
As long as the Fed continues this new twice as aggressive QE out of the repo crisis excuse, this should be the minimum this finale should last. If the market peaked in late May, the distance between the 2020 and 2000 bubble top vs. the 2000 and 1987 one would be a perfect Fibonacci ratio of 1.618.
The next chart looks at the entire two longest bull markets in history: Oct 1990 to March 2000 vs. March 2009 to now.
This rally up through the final sharp bottoms in late 1998 and late 2018 is tracking to be about 22% longer – 11.5 years vs. 9.4 previous. If the peak follows that track, the projection would be near 13,500 Nasdaq by late September…. holy crap! That would not be hard if the Fed keeps up the repo madness gravy train.

So, strong sailing ahead, and definitely not time to be selling stocks yet, or even putting on hedges. Some may want to add a bit on a likely near-term 3% or so correction.
We’ll look for bigger shifts more likely into May. It will depend on how long the Fed can keep up this super-charged new QE and what Donald gets passed for direct to consumer stimulus if need be.
I’ll have a full report in the March Boom & Bust issue.
P.S. If you missed the live broadcast the Delta Profit Summit, where my colleague here at Charles Street Research Michael Coolbaugh, pulled back the curtain to reveal one of Wall Street’s very own algorithms and how you can use it yourself to generate impressive returns and give your portfolio one more big boost in this bull market. Click here to catch a recording of Michael’s presentation for free.


January 21, 2020
Robbery, Social Security, Inflation, Drugs, and Politics
On Monday, January 13, Gilbert Ware walked into a bank in Greenville, South Carolina, with a gun and demanded money.
The teller complied, and Ware made off with an undisclosed sum of cash. As he left, Ware saw a man in the parking lot sitting in his car. As Ware approached, the driver hit the gas. Ware shot at him, shattering the driver’s window and damaging the dashboard, but missing the man. Ware escaped the scene but was arrested nearby as he drove cautiously along a major road.
None of this is terribly interesting, until you learn that Gilbert Ware is 86 years old.
The idea of an octogenarian robber slowly leaving the scene of the crime makes for a funny meme, but it’s probably not terribly humorous to the bank teller at the other end of the gun, or the bystander at whom Ware took a shot.
Ware’s motives haven’t been disclosed. Maybe he was bored, or wanted a little extra pocket change. Maybe he was losing touch with reality. Or perhaps he needs to pay for prescription drugs.
In December, the Social Security Administration declared the cost of living adjustment (COLA) for the next 12 months. Social Security checks will increase by a whopping 1.6%. The day after Gilbert hit the bank, the Bureau of Labor Statistics reported that both headline and core inflation increased 2.3% last year. Drug prices were up 3%, and medical service prices increased 4.6%.
The difference between the 3% rise in prescription medicine costs last year and the 1.6% increase in Social Security benefits isn’t that big. But it’s just one year.
Over the last 10 years, prescription drug prices have increased 3% on average every single year, whereas Social Security benefits have increased in a range from zero for 2010 and 2011, to 3.6% for 2012. Through the power of compounding, over the full decade COLAs increased Social Security benefits by 16.2% while drug prices jumped 38.4%. As time goes by, the difference grows larger.
With millions of Baby Boomers retiring, benefits and costs for the elderly will play a bigger role in our national politics. Over the past week, presidential hopeful Bernie Sanders has taken aim at rival Joe Biden for supporting cuts to Social Security over the years, a charge that Biden vehemently denies.
At the same time, California has outlined the broad strokes of a plan to create its own prescription drug label that will manufacture drugs commonly used by those on the state Medicaid program. The new entity would charge the state much lower prices that it currently pays to buy drugs for beneficiaries. With one-in-three Californians signed up for the state’s Medicaid, this could create huge savings.
And who can blame them?
In the same week as the robbery, the release of the inflation numbers, and the proposed new drug company by the State of California, BioMarin Pharmaceutical told attendees at the J.P. Morgan Health Care Conference that it expected to price its new hemophilia drug, valrox, between $2 and $3 million per patient. The drug would surpass Zolgensma, at $2.1 million per treatment, as the most expensive drug in the world.
BioMarin acknowledges sticker shock, but said the cost of the drug should be compared to the lifetime existing therapies for hemophiliacs, which the company estimates at $25 million. Maybe those numbers are right, but several million dollars for one treatment of a drug sure sounds expensive.
The growing population of Americans on fixed incomes who use increasing volumes of prescription drugs is bringing the issue of cost to the forefront, and it should play a significant role in the coming elections.
With President Trump calling for importing cheaper drugs from other countries and most of the
Democrats supporting some form of government intervention in the current process, it looks like the question will be who promises the bigger benefit?
But then a more important question will follow. Will the next president follow through?
There’s been a lot of talk about making prescription drugs more affordable, especially for seniors, but so far, we’ve seen little more than pharmaceutical companies offering limited rebates and assistance.
If the industry doesn’t do more to ease the cost burden, especially on common drugs, we could be facing serious government intervention. It might be better than having octogenarians robbing banks, but it rarely leads to the efficient delivery of goods and services.

January 20, 2020
We’re Seeing Frothy Stocks
Here’s an interesting divergence. Just as stocks head straight up since early October into what looks like the final blow-off phase of this bubble, 97% of corporate CFOs see a recession starting by the end of 2020.
Tons of Silicon Valley start-ups are looking to go public this year to beat a recession expected by 2021. That’s perfect to occur into a tech bubble top as into 2000.
This rally since the biggest correction since 2009 into December 2018, is tracking with the blow-off rally from 1998 into 2020 to peak around late May at as high as 11,000 Nasdaq. I’ll have more on that on Wednesday…
But here’s another divergence. The ISM Manufacturing index is a good leading indicator, and it is pointing down 10% while the S&P 500 has surged 30% recently. Here’s the chart…

This is the biggest divergence since early 1996, at the early stage of the first tech bubble. The other similar divergence was in late 1989/early 1990, before 1990’s 20% crash, the largest between 1987 and 2000.
Why? The largest monetary injections by the Fed, as I covered last Wednesday. By the way, we had some erroneous data from a Wall Street Journal article, and the cumulative “repo madness” money printing since September has been $425 billion instead of $505. But plans are still to print $80 billion a month ahead in normal QE, plus repos as needed, which means likely $110-$140 billion a month vs. $60 billion at peak QE in the past.
The put/call ratio at 0.45 is the most extreme since January 2018, just before that bubble-like peak, so stocks are short-term overbought. So, we could see some sort of correction any day…

But stocks just keep melting up with record flows of funny money into the financial asset pool on Wall Street. Forget the excuses that “this is just a temporary repo imbalance.” This is a full-out, even more aggressive form of QE. Any money injected into the financial asset arena – repos, T-bills, bonds, etc. – ends up with more money chasing the same assets and always migrates most to the highest gains from stocks, creating financial asset bubbles – period!
Repo madness, IPO madness, bad news doesn’t matter… This is all a clear sign of the final mania phase of this bubble, which started in early 2009 and is now the longest and most globally pervasive in history.
Best projection at this time: stocks continue up strongly into mid-year, then the volatility starts when economic slowing becomes more obvious than it already is now to corporate CFOs.
Stay tuned: I’ll have an update on those projections on Wednesday.

January 17, 2020
A Worldwide Whirlwind
We’ve just endured an exceptionally busy stretch of weeks as far as world news goes, and that’s not looking to let up any time soon. But just think about all of the geopolitical shifts we’ve seen lately, all of which had the potential to seriously shift the financial markets: Brexit, Iran, the China trade deal, the USMCA, and of course Trump’s impeachment and next week’s beginning of the Senate trial.
Iran was certainly top of mind when I dropped in here last week, and you’ll recall that I was worried Trump had brought us to the brink of war. That’s sort of dissipated over the past seven days – the Iranians blinked, which may have come as a relief to Trump – but it’ll still be a few weeks before things shake out enough to know what sort of threats could be on the markets… even though right now a seismic shift isn’t looking so likely.
Elsewhere, locking down Phase 1 of the China deal and getting Congress to sign off on the USMCA, Trump’s remodel of NAFTA, are both modest positives, and good for his political prospects. Of course, the impeachment isn’t, though that won’t be too bad so long as he doesn’t get thrown out of office.
Which brings us directly to the markets. We had a big look Wednesday on what repurchase agreements are doing to quantitative easing (complete with a numbers update after we got some bad figures from the Wall Street Journal). My two scenarios have favored the more bullish one: a continued blow-off rally into the middle of this year.
That’s all for this week. Thanks, as always, for reading and tuning in.


January 16, 2020
China’s Dilemma
It’s been almost two years in the making, but the U.S. and China finally agreed on at least part of a new trade deal, called Phase 1. But there might be less to the deal than meets the eye.
Phase 1 calls for a number of changes in how the Chinese deal with intellectual property and technology, and for China to increase purchases of U.S. agricultural products by $32 billion over two years. That’s more than the total amount of agricultural products that China bought from us in 2017, $24 billion, before all of this started. What will the Chinese do with all that extra stuff?
The same goes for pledges in the energy market and the services sector.
If the Chinese actually buy as much as they have pledged to purchase from the U.S., they’ll either need to reduce domestic supply, which seems unlikely, or buy our stuff at the expense of other foreign suppliers. One approach that seems wildly improbable is that China will grow fast enough to absorb the extra goods and services. The country is slowing down, which is probably why they signed the deal in the first place.
The Chinese economy is bumping along at the lowest GDP growth rate in three decades, hurt by the fading impact of heavy stimulus spending at the start of the 2010s, an attempt to reign in massive debt at the local level, the trade war with the U.S., and the general aging of its population.
The outlook has turned negative to the point where the government pumped more money into the financial system at the start of the year, and is restarting coal plants to support heavy industry.
In the first week of January, China reduced the reserve requirement for banks, which allows them to lend more of their deposits. The move freed up $115 billion in the financial system, but that doesn’t mean the money walks out the door and gets put to productive use. Chinese banks aren’t blind to the fact that the local economy is losing steam, so they choose to lend mostly to state-owned enterprises (SOEs), which are backed by the government.
Traditionally, SOEs pursue goals other than profit, such as full employment, which makes them popular with provincial governments but not very likely to run efficiently or turn a profit. That’s fine with banks because the SOEs carry the imprimatur of the state, so the lender knows he’ll get his money back.
On the industrial front, China signed up to the Paris Agreement and pledged to cut carbon emissions. The country reduced its dependence on coal from 2014 through 2016, but then increased its coal consumption from 2017 on. Now the country is building or restarting a massive number of coal-fired energy plants.
According to the Financial Times:
“China is set to add new coal-fired power plants equivalent to the European Union’s entire capacity in a bid to boost its slowing economy, despite global pressure on the world’s biggest energy consumer to rein in carbon emissions.”
The Global Energy Monitor estimates that China is adding 148 gigawatts of coal-fired energy capacity, which is almost exactly the same amount of coal-fired capacity in all of Europe, 149 gigawatts. While this might sound like bad news for anyone worried about the climate, there’s a strange silver lining to the cloud. China doesn’t need the electricity, so it’s likely the plants won’t operate at capacity.
Chinese electrical use expanded by 8.5% last year, but the electrical grid remains oversupplied. Local Chinese governments, typically through SOEs, don’t build coal plants just to sell electricity; they also
build them to ramp up local employment during the construction phase as well as during operation. So yes, China is using more coal and will probably increase its use in the future, but not by as much as it would seem.
The bigger picture is that China is doing many things to stimulate growth in the face of what looks to be a long-term slowdown. It’s still a command economy, so Chinese officials have more options at their disposal than authorities in other countries to try to turn the tide.
But that doesn’t mean they’ll be successful. It looks like they’re headed for a tough time.
The only question is, will they muddle through with a soft patch of low growth, or will it be an ugly economic shock to the system?
There’s no way to know for sure, but I’m keeping a close watch on companies with a lot of exposure to the Middle Kingdom, which could take a hit if things get ugly.

January 15, 2020
It’s Repo Madness
Heard any good news about global growth, earnings forecasts, Trump’s impeachment, the China trade impasse, or American relations with Iran? No need when the Fed is pumping money into the financial markets at two times the rate of peak quantitative easing.
Oh, QE was halted in late 2014, then the Fed stopped it and then tapered by selling off bonds in 2018 into 2019…
Then that suddenly stopped in mid-September, when overnight repo rates shot up to 10% from 1.5-1.6%. The large banks that normally fund overnight loans for banks, and leveraged investors who need to meet margin or reserve balances, just simply and immediately stopped lending.
Why did this happen? The Fed thought it could taper its balance sheet and QE stimulus… and the financial system is telling them, “No way! We need this liquidity to survive as we are still largely insolvent.”
This just shows that central banks didn’t fix the 2008-09 financial crisis, they just covered over it and kicked the can down the road. Now the Fed is caught funding this repo market and they have had to inject $505 billion now since mid-September, with the latest injection a whopping $83 billion in early January. Peak QE was at $60 billion a month. This is averaging $127 billion, or more than double that!
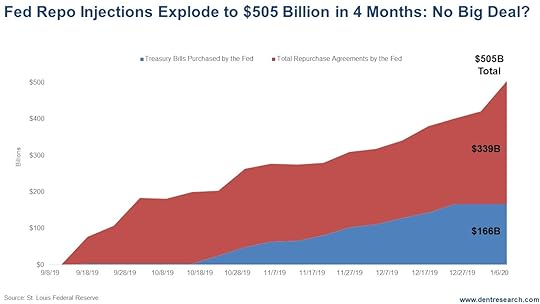 Note that $339 billion of this is directly funding repo agreements that the banks were no longer funding. But in addition to that, they added $166 billion in T-bill purchases through mid-December – good old-fashioned QE. Their balance sheet peaked in late 2014 at $4.52T (trillion) and it fell to $1.76T – a drop of $754B (billion), or 17% – in September.
But the reserves at banks held at the Fed for liquidity dripped from $2.72T to 1.26T, $1.46T or 54% – much more than the balance sheet. There was that point where the larger banks simply were not comfortable using their funds for repos creating too low reserves… and what happens if we get another Long Term Capital Management hedge fund that blows up overnight?

But the real point here: The system is telling the Fed that it can’t handle its tapering, and the Fed is goosing its balance sheet rapidly. Just another $300 billion or so will take it back to its peak in late 2014 – late 2017, before it started to taper. At this rate, that would happen by the end of March.
Central banks keep erroneously assuming that if they stimulate long enough, the economy will grow strongly again on its own. That only happens if you allow a deleveraging of debt, financial bubbles and unproductive banks and companies…
Bad, bad central bankers!
When do the alarms go off here? When we’re at new highs on the balance sheet? When cumulative repos and QE hit $1 trillion?
I’ve always said that you can’t keep pumping up a dead economy and financial system without creating bubbles that burst of their own extremes and losing control over a repo crisis like this.
The Fed injected $150 billion into January 5, 2000, to offset Y2K problems. The Nasdaq exploded in that very time and then crashed by 41% three months after they finally backed off – and that was just the beginning of a 78% crash.
This blow-off rally since September is directly related to this and nothing else. We could see this continue into the first few months of 2020 and then peak for good…
I have a few scenarios in this political-laden year. But look out if this repo crisis and stock market continues to run full speed, as it is currently. A 40%+ crash could be coming sooner rather than later.

January 14, 2020
The Trump/Powell No-Love Fest
Maybe it’s like the movies, where bickering parents stick it out for the kids. Or maybe both of them are simply comfortable in their positions of power, free to do what they want in their respective worlds.
Whatever the reason, the fact that President Trump still sits in the Oval Office and Jay Powell remains at the helm of the Federal Reserve is great news for investors. Long-term they might be driving us over a financial cliff, but for the moment they’re unwilling co-conspirators pushing us higher.
On the day of Trump’s inauguration, I wrote “Welcome to the Revolution,” and laid out why I, and many people I know, voted for him. It wasn’t out of love for everything he says, or even support for some of his social programs. We wanted fewer regulations, a modified tax code, and more power pushed down to the states instead of centralized in Washington. Some of that has happened, and it’s been fabulous for American business.
Cutting corporate taxes from 35% to 21% gave American firms a sudden windfall. This wasn’t the tax change I had in mind, and I wrote in the days after it passed that the change would put cash into a lot of pockets, but wouldn’t boost growth very much.
Unfortunately, by cutting taxes without also cutting revenue, the move put us on the path to trillion-dollar deficits starting this year and stretching as far as the eye can see. There’s no way we’ll actually allow the tax cuts for individuals to phase out in the mid-2020s. It will take an act of Congress to increase the corporate tax at least halfway back to where it was to bring things back to a semblance of balance.
On the regulation front, Trump has given most businesses an ongoing Christmas present. Trump now holds the single-year record for the fewest regulations added by any president since we began keeping records in 1975. He also holds the second and third spots. Trump rolled into office promising to cut two regulations for everyone he implemented. He didn’t.
Instead, he’s cut 8.5 regulations for everyone he’s put in place. He’s also redirected the EPA and other regulatory agencies and now wants to limit the time allowed for an environmental study to two years. Such studies have been used as a weapon to stop everything from pipelines to roads.
And then there are the judges. Trump has appointed a full 25% of all U.S. Circuit Court judges and appointed 187 judges overall, plus two Supreme Court Judges, all of whom will presumably, but not guaranteed, take a softer stance on business. Because these judges are appointed for life, this legacy will live on for decades.
You don’t have to love, or even approve of, the man to recognize the benefits for Corporate America and investors.
As for Chair Powell, he hasn’t pushed interest rates below zero, earning the ire of President Trump. But he’s still been a friend to business and the markets. By turning about-face in early 2019 from a rate cut in December 2018, Powell put the world on notice that he was willing to turn dovish at the drop of a hat. The three rate cuts during the year gave the markets a little boost, and then Powell went even further.
In September, the Fed intervened in the repo markets where borrowers had to pay a steep price, around 10% when lenders decided to turn off the taps. Repo borrowers use the money to invest, so a breakdown in this area would have sent jolts through the equity and bond markets. Powell was having none of it. He lent more than $100 billion.
In early October, Powell and his fellow Fed Governors pledged to offer $65 billion per month in repo money to quiet the markets. Unless it’s not enough, in which case they’ll lend whatever people want to borrow.
In the last four months, the Fed has lent more than $400 billion in repo money. It’s not QE in their eyes because they aren’t buying bonds all along the yield curve to lower interest rates to boost the economy, but it adds more firepower to hedge funds and other large investors who then chase stocks and bonds. The economy might not benefit directly, but our investment accounts certainly do!
The deficit-inducing Trump tax cuts, along with the bubble-blowing money printing from the Fed, can’t be good for the economy or the financial market’s long-term.
Eventually, we’ll have to get the budget deficit under control, which means cutting spending or raising taxes, and stop giving nearly-free money to hedge funds. Eventually… but not today.
Jay Powell is relatively untouchable on his perch. And, for all of his foibles, Trump looks like he’ll hang on at least through the end of his first term. If his re-election starts to look questionable, expect the business community and markets to take it hard, which will be bad news for your investments.
I don’t think Jay Powell, as a single parent of the markets, would be able to keep it going.
P.S. On January 22nd at 1 PM ET, my Charles Street Research colleague, Michael Coolbaugh is hosting a live event called, The Delta Profit Summit. This is where he’ll use his expertise as a Certified Market Technician and experience trading on Wall Street to walk you through how you could use one of Wall Street’s own algorithms to grow your wealth and build a seven-figure retirement. Click here to reserve your seat.

January 13, 2020
The Great Stock Overvaluing
In the past, I have shown that we were at the highs for key valuation indicators even though we were not for the current favorite: the Shiller CAPE P/E Ratio. That was 44 at the top in early 2000 and has been as high as 33 in 2018. CAPE means “cyclically adjusted for 10-year average earnings,” which is better, as earnings can be so volatile, especially around tops and downturns.
But I have in the past adjusted that further for the 10-year average GDP growth rates, as this bull market and recovery are far inferior to past ones, especially that 1991-through-2000 boom that saw 4% growth rates instead of 2%. Stock valuations are and should be higher when growth is higher. That adjustment showed that the market is currently substantially more overvalued than in 2000.
My other two favorite indicators are so because they can’t be manipulated as much by earnings and earnings per share. The first is often called the “Buffett Indicator.” It simply measures the total market capitalization of stocks vs. GDP.
The Wilshire 5000 is used as the broadest measure. In this case, reducing the number of shares outstanding does not directly affect total market value. But when stock buybacks do accelerate price/earnings ratios from higher EPS growth, then that does tend to raise the overall market capitalization to some degree. But this is still a better indicator than P/E ratios.

This indicator now at 151% and rising fast is clearly higher than the last all-time high at 141% in 2000, at the top of the last tech bubble peak. Hence, this tech-driven bubble has not gotten bubblier. And this indicator looks to go a good bit higher if my minimum targets for the Nasdaq of 10,000 are hit in the next few months.
This could hit 160%+ easy. And note how low this indicator got after the last tech crash – down to 56%. The real target on longer-term cycles would be down more to the 33% low in the early 1980s… One bad-ass crash coming, in that case.
The next less profit and EPS-oriented indicator is simply the S&P 500 Price to Sales Index. This again cannot be rigged by earnings manipulation, although stock prices will lean higher due to stock buybacks leading to higher valuations overall. This indicator is also at new highs, a bit higher than the 2000 bubble top.
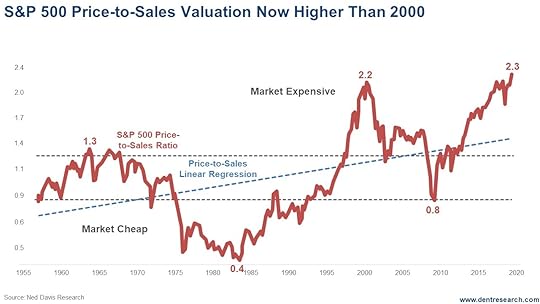
On this chart, the trendline regression is helpful. Stocks at 2.3 are not quite as high above that trend line as they were in early 2000. They would be at about 2.45, not that much higher and something that could be hit in early 2020 if this rally continues with the massive unprecedented repo infusion (now over $500 billion in 3 months), which I will write about in the next week. Using the regression line, I would forecast that this indicator falls to about 0.4-0.5 by 2022 or so… much more than the prior two crashes.
This market does not look like it wants to peak yet. But the burst will be monumental when it finally does…
If anyone tells you the market isn’t that overvalued… just give them a little slap and keep walking.

January 10, 2020
Gold Repos, Iran, and Puerto Rico
It’s been a busy week around the world, and particularly here at home in Puerto Rico, where we were without power for a bit after the string of earthquakes on the southern coast on Wednesday. Luckily, we have since recovered and are stabilizing pretty quickly. That was no Hurricane Maria, I’ll say that much.
And in Iran, where geopolitical tensions are simmering at a near-boil after the United States’ assassination last week of Qassem Soleimani. As you know, Iranian forces responded this week, firing missiles at a U.S. base in Iraq. The fact that they failed to hit any soldiers is a good thing, obviously, and it looks to have been intentional. My thinking here is that Iran blinked first in this standoff as I recently advised they should, given the instant win of having Iraq vote to kick the U.S. out.
Nevertheless, the fluctuations we were expecting in the markets as a result of the Iranian conflict haven’t come to fruition quite yet. We’re still in this holding pattern, where two scenarios are possible, but the near-term blow-off top looking more likely after Iran’s tepid response. What we do know is that markets haven’t been given any specific reason to go down now, so it’s likely they’ll continue to climb a bit through the first few months of 2020 and that could form a top by March.
Remember, this is a different type of global conflict, one raised over geopolitical tensions, not the pursuit of a commodity, so we should expect to see markets and entities like precious metals move differently than usual. That goes for gold and silver, especially — neither of the two have changed course much in response to this week’s news. They’re still moving in those bullish trends, but silver is not advancing faster than gold, as it usually does.
I have more on all of this, as well as a breakdown of the mess we’re in on repurchasing agreements, in this week’s Friday Rant.

January 9, 2020
Millennials Are Finally Buying Homes
The holidays are over and we’re finally getting our home back in order. We had 16 people in the house for Christmas dinner, including our three children and our son-in-law. The youngest was our 21-year-old daughter, so it was a home full of adults.
Our kids stayed with us for several days, which filled the house will conversation, laughter, and joy, as well as trash, noise, laundry, and general craziness. I know the refrigerator, liquor cabinet, and pantry will recover, but it will take time. We’re definitely part of the group that loves to see them show up, and is grateful when they leave. Given that two of our children are Millennials and one is part of Generation Z, we’re even more thankful that they have somewhere to go, because other parents aren’t so fortunate.
According to the Bureau of Labor Statistics, almost 32% of young adults between the ages of 18 and 34 live with their parents. I think I’d rather have them live in the driveway in a motorhome than be in my house, but luckily, we don’t have that problem.
But judging by recent numbers, parents with adult kids at home might be getting some relief, which is good news for all of us.
The percentage of first-time home buyers jumped in recent quarters and reached 39% in the third quarter of 2019, well above the long-run average since 1994 of 35%. But that average includes the dark days in real estate, after the financial crisis, when the share of first-time home buyers dropped to 30% for much of the 2010s. Those tough times dragged down the average of first time home-buyers from its previous mark of 40%, which means the latest figures show a return to normal.
It can’t happen fast enough.
Over the past 12 months, mortgage rates dropped a whopping 1.2%, from near 5% to less than 4%. While that might not sound like a lot, it would drop the payment on a $160,000 mortgage by $120 per month, or $2,440 per year. In the 20% tax bracket, it takes $3,000 in gross income to take home $2,400, so this seemingly small savings can make a difference.
Over the life of the loan the difference is even more impressive, with the lower mortgage rate shaving the interest cost by more than $35,000.
With unemployment bumping along at 50-year lows of 3.5%, average hourly earnings increasing more than 3%, and very low mortgage rates, now is the perfect time for Millennials to get out of their parents’ houses and stop blocking their driveways.
On the supply side, it looks like we’re finally getting some love from the builders. In the first three quarters of 2019, new home sales in the entry-level price range of $250,000 to $300,000 rose 31% from 2018, a larger increase than the sales in all other price segments combined. If builders can keep up the pace, then we might just have a decent 2020 in real estate, at least at the lower end.
And to be fully transparent, as a society we need the Millennials to get going. Buying a home is part of the traditional path toward marriage and starting a family, and we need more kids.
According to the Center for Disease Control, Americans had the fewest kids per capita on record last year, which dropped our total fertility rate per woman to 1.73 children. We need at least 2.1 kids per woman to keep the population steady. We haven’t seen that level since 2007. Women have 15% fewer kids today than they did just over a decade ago.
We’re not losing people yet, but if the trend continues, our population will go flat and age as the existing
large generations get older. We’ll look more like Germany and Japan, and not in a good way.
So if you have adult kids, or even grandkids, still milling about the place, consider putting a few strategically-located brochures from home builders on the table. It’s time they got on to the next stage in life, for the good of us all.


