
Harry S. Dent Jr.'s Blog, page 6
February 5, 2020
Today’s Scary Investment Prediction
I just saw an update of John Hussman’s infamous model that shows a very clear correlation between stock valuations, defined as stock prices over U.S. economic gross value-added, and 12-year total investment returns.
This indicator is similar to stock market capitalization over GDP, which I have shown recently, except it is more predictive and specific for future performance.
The update explains that the indicator is higher than ever, including the 2000 tech bubble peak.
Hussman is seeing around a 67% crash following this bubble – and given the strong debt levels and downward demographic trends, I see worse.
But the real truth, by this model with a great past correlation, is simple: expect an average annual return of 0% per year after dividends and interest (total return) over the next 12 years. Look at this indicator that I have been following for decades.
First, look at the correlation on this chart from one simple indicator – that’s my type of research! The blue line is the indicator, and it leads the red line, the actual 12-year average returns, by 12 years.
Over the last century, the only time worse than today was 1929, when the 12-year predicted total return was -1.3%. That was only slightly worse than the current readings and was followed by an 89% stock crash.
It was 1.4% in early 2000 and 2.9% in late 2007, both more favorable than today – and look what followed both of those extreme valuations!
Hussman uses the S&P 500 price over U.S. gross value added in the economy. He is predicting returns on a standard 60% stock/30% bond/10% cash portfolio. Hence, stocks alone would only fare worse here.
To quote Hussman directly: “The more glorious the bubble in hindsight, the more dismal the investment returns become in foresight.” I simply call it: “The greater the bubble, the greater the burst.”
Hussman also states: “Investment is not independent of price. Whatever they (investors) are doing, it’s not investment.” That means, to me, Dr. Lacy Hunt and money velocity indicators, that it is not about productive investment, but rather speculation, which never ends well.
Does this mean stocks top now? No, and my shorter-term indicators suggest another 10% plus coming in a matter of months before such a peak. That means this indicator is likely to end up even worse than the 1929 reading before this is over.
But again, what I love most about this model is that it is simple and allows investors to see implications well into the future.
This is why Hussman is one of my trusted “go-to” analysts. He goes after the truth, not the hype. He focuses on the big picture, not the complexity of the economy and investing.
The post Today’s Scary Investment Prediction appeared first on Economy and Markets.


February 4, 2020
Congress Gets Deeper in Debt
Remember when t-shirts were cool? In the late 1970s and through the 1980s, high school and college kids got a kick out of wearing shirts with pithy sayings.
We’d go to the mall and have them printed with things like “He who dies with most toys wins.”
As with all trends, this one ran its course. You can tell you’ve reached the end when the late adopters jump on board. With t-shirts, it was grandparents, and shirts that said things like “I’m With Stupid.”
Before you knew it, custom shirts were out of favor with Gen X.
But there is one that everybody seemed to like: When grandparents would return from vacation, they’d bring back shirts for their grandkids that read, “My grandparents went to [insert location here] and all I got was this lousy t-shirt.”
There must be 10 billion of these shirts circulating around the planet, with most of them now sent as surplus clothing to Asia. But the sentiment lives on!
That phrase came to mind last week as I looked over some economic data.
My Congress went $1.1 trillion further in debt last week and all I got was lousy 2.1% GDP growth.
OK, it doesn’t quite roll off the tongue, but you get the point…
The Bureau of Economic Analysis reported last week that the U.S. economy expanded at a 2.1% annualized rate in the fourth quarter. I had expected growth just under 2%, but the measure was propped up a bit by weak imports, a positive for GDP. Still, 2.1% isn’t an eye-watering number.
For the year, GDP expanded by 2.3%. Another yawner.
Now compare that with the figures from the non-partisan Congressional Budget Office (CBO). The CBO announced that we ran a deficit of just over $1 trillion in the fiscal year 2019, which ended in September, and through the next decade are expected to run 13-digit deficits!
It wasn’t supposed to be this way.
When the Tax Cuts and Jobs Act (TCJA) passed in 2017, the administration told us that cutting corporate taxes from 35% to 21% would put billions of dollars into corporate coffers (which has held true), which they would then spend to grow their businesses and expand the economy (which, not so much).
Instead of pushing GDP growth to 4% or even 5%, Corporate America pocketed the cash and, in many instances, used it to buy back their outstanding shares. The markets soared, but the economy remained stuck in a low gear. Growth peaked at 3% in 2018, the first full year of the new tax regime, and then fell away.
And it gets worse.
As with most things, the tax reform passed with a simple majority in Congress as part of budget reconciliation. All of that might sound really boring, but it’s important. Anything passed through budget reconciliation must be deficit-neutral over the next decade.
To accomplish this, the administration assumed strong GDP growth that would increase tax revenue, and also higher individual taxes in 2025. Notice that 2025 is just outside the window of a second Trump term if he wins again.
When the measure passed, I didn’t think it would perform as advertised. For businesses to invest, they need to be confident in the demand. Without a significant ramp in consumption, banking on a huge increase in fixed business investment made no sense.
Tax reform supporters claimed the bill to be revenue neutral, or maybe even good for the budget, meaning that we might run lower than previously estimated deficits. Detractors said we could add another $2 trillion to the deficit over the next decade.
They were both wrong.
It looks like the TCJA will add an additional $4 trillion to the deficit over the next decade, in addition to what we would have run without it. And that’s before we deal with the likelihood that Congress won’t allow individual taxes to jump up in 2025.
We’ll reach $30 trillion in national debt before we reach 2030. And all we got was this lousy t-shirt!
There’s no doubt that corporate taxes needed reform. We weren’t competitive across developed nations in attracting international companies. And the TCJA did entice some large companies to repatriate foreign profits that were sitting overseas. But we overreached, and our expanding national debt is the price we are paying.
By digging a deeper hole in our national finances, we put ourselves at risk when interest rates turn higher.
The cost of our national debt will skyrocket, crowding out spending on other priorities. Then we’ll have to make hard decisions about prioritizing how we spend our resources and raising taxes.
P.S. Michael Coolbaugh has spent the last decade designing trading systems alongside megabanks like JP Morgan, Goldman Sachs and more. Today David Stockman is calling him, “one of the most important people in finance you’ve never heard of.” And now, he’s sharing the same algorithms he used to generate $85 billion a day on Wall Street to help you grow your retirement during one of most volatile periods ever… when most investment strategies tend to fail. Click here to find out more.
The post Congress Gets Deeper in Debt appeared first on Economy and Markets.
February 3, 2020
The Coronavirus and the Markets
This new coronavirus has now surpassed the impact of SARS in 2002, with more than 360 dead and 17,000 infected. I hear underground rumblings that the number of infections is closer to 90,000. Wuhan, the town of origin, is completely shut down, as is the case with significant parts of 12 other cities.
This has been and will continue to affect China’s economy and its Asian trading partners.China’s stock market had been on holiday since January 23, due to the outbreak.
The Shanghai Composite opened down 9% Monday morning and closed down 7.7%. This was despite $174 billion in reverse repo injections that raised the net balance sheet by $22 billion. But that balance sheet would have fallen by $152 billion, which is tightening, if China’s central bank had not injected that much. And that is on top of the U.S., at $404 billion injections since mid-September.
U.S. stocks had its big fall on Friday, down 600 points on the Dow, but bounced this morning up 200 points to open. We are holding and China is folding.
Ralph Acampora, called the “grandfather of technical analysis,” sees this likely turning into a 10%+ correction and possibly the beginning of a major crash, more like what I am looking for. But I don’t see that yet unless this crisis really accelerates.
The recent Fed injections are bigger than the strongest at its peak QE – and this gives an excuse for even more – and in China, as well. The antibiotics for every ill is “print more money!”
Here’s my best new indicator. I just chart the surge in the Fed balance sheet since the repo crisis in mid-September on a 3-week lag for stocks and the correlation is very close.
Here I show the Nasdaq which is rising the fastest, but the correlation is very similar with the broader S&P 500…
[image error]
This chart shows that stocks would be due for a minor correction, which we have seen thus far, of 4% for the Nasdaq.
This indicator gives us a nice three-week lead, and it says that as long as this correction can stay more in this 4% to 6% range, it would not be a sign of a deeper crash. The Dow starts to get in trouble down 7% below 27,300; the S&P 500 at about 3,000, down 10%; and the Nasdaq at about 8,300, down 12%.
I will be monitoring the Fed balance sheet every week, as it is updated on Thursday after the close. The demand for repo injections has abated for now. But last week’s T-bill purchases – good, old-fashioned QE – were $22 billion, or about $90 billion a month, and their declared intentions have been for about $80 billion a month plus repos when needed. If that continues, as I expect, stocks should be exploding up until the bubble blows between late May and the election, by my best calculations in the last two weeks.
Now would be a good time to review my articles and rants since mid-January…
I’ll keep you updated on this virus and these new injections that are just proving that the Fed can’t taper without the system blowing up – we’re hooked on “the crack.”
This repo crisis is not a short-term problem that will go away. And this virus may or may not be. It likely will get worse before it gets better, but it won’t affect the U.S. nearly as much as it’ll affect China and Asia, as the markets have thus far shown.
The post The Coronavirus and the Markets appeared first on Economy and Markets.
January 31, 2020
My Presidential Endorsement
I usually take this opportunity to talk about the markets and where they’ve been and where they’re going, but today I want to use this space to dive straight down into politics. We’re obviously at a critical point here, barreling into the 2020 presidential election, and who we choose to lead our nation through these next four years.
Now, I know that most of our readership leans Republican or Independent, but I’ve made clear in these pages that I’m not nuts about the idea of Donald Trump continuing as our president. I think he has a significant chance to win, especially because he can deploy a few trump cards (to steal a phrase) to boost the economy even more – or slam its eventual demise, should a far-left candidate be nominated to run against him. But I don’t think we’ll get one, and for my sake and yours, I hope that’s not what we see.
So I’ve been thinking for the past few weeks about who I’d like to see run against Trump, and who I think would be the best candidate for our subscriber base. As I said, I don’t think it’s a far-left candidate; with Trump being so polarizing, the party will want to be able to sweep up the independent and moderate voters.
That’s why I’ve arrived at Mike Bloomberg as the right guy. The former mayor’s been on somewhat of a hot streak lately, gaining in polls (he just topped Warren in one this week) and getting his message out to the right markets. What I like about Bloomberg is he’s the ultimate centrist. He’s barely even a Democrat – just doesn’t like Trump, and he’s made no effort to keep that quiet.
Mostly I think Bloomberg will be the best candidate for your money, which is something he knows a lot about. But that’s what makes my pick for vice president so surprising. Because I can’t think of anybody better for that role than Elizabeth Warren. Yep, the candidate running almost closest to Bernie Sanders on the far left. But here’s the thing about Warren: she’s a bulldog, and she’s whip-smart about the banks. She understands the financial industry’s ins and outs like few others, and she knows what needs to be reformed to get the focus back on prosperity for everyday Americans. People call Warren a socialist, but she’s not. She doesn’t hate capitalism; she just wants to reform it.
So there you have it: a centrist who understands business but is sensitive to things like climate change and a pitbull to remake the banks. I have more on all of this in this week’s video…

January 30, 2020
Blackrock’s Dereliction of Duty
Like much of the rest of the world, investors are focused on the spread of the coronavirus and, to a lesser degree, the impeachment proceedings in the U.S. Senate.
Both are important, but in each we risk letting immediate concerns crowd out long-term risks.
The disease sweeping through parts of China and cropping up in various other parts of the world is a threat we must contain, and we will. We’ve learned from SARS in 2003 and H1N1 a decade ago.
The latest virus might spread, but no one appears to be taking it lightly, so there’s every reason to think we will get it under control and the economic impact will be short-lived.
As for the impeachment, nothing revealed so far looks like it will sway anywhere near the 20 Republicans required to convict the president and remove him from office. It’s historical, but the outcome is almost pre-ordained.
With those two things hogging the airwaves, we’ve little bandwidth left to discuss one of the biggest revelations of the last two weeks: Money Management behemoth Blackrock will divest from any company that earns more than 25% of its revenue from thermal coal.
This is the first move, not the last, and your money is at stake.
In an annual letter to clients, Blackrock CEO Larry Fink wrote:
In a letter to our clients today, BlackRock announced a number of initiatives to place sustainability at the center of our investment approach, including: making sustainability integral to portfolio construction and risk management; exiting investments that present a high sustainability-related risk, such as thermal coal producers; launching new investment products that screen fossil fuels; and strengthening our commitment to sustainability and transparency in our investment stewardship activities.
The letter went on to say (with emphasis in the original):
Given the groundwork we have already laid engaging on disclosure, and the growing investment risks surrounding sustainability, we will be increasingly disposed to vote against management and board directors when companies are not making sufficient progress on sustainability-related disclosures and the business practices and plans underlying them.
Blackrock manages almost $7 trillion. The company invests money for governments, pension funds, sovereign wealth funds, and endowments. In other words, they control the assets that are supposed to provide retirement benefits for tens of millions of people.
The company is shifting its focus from growing asset value while taking prudent amounts of risk, to enforcing its view of what companies should be doing to fight climate change.
The new direction of Blackrock follows on the heels of the announcement of the 181 CEOs of the Business Roundtable last summer. The group declared shareholder capitalism dead, with “stakeholder” capitalism the new order of the day.
Stakeholders include shareholders, workers, the community, and the environment. These businesses pledged to run themselves, that means deploying your capital as investors, in a way that’s good for all groups.
Just as with Blackrock, this brings up the question of, “According to whom?”
The largest money management firm in the world and almost 200 CEOs of leading companies just told us that they will use our investment dollars to affect social changes however they see fit.
That’s not their job.
If they want to use their personal funds to pursue social issues, great. But company resources are meant to be dedicated to running the business in a way that benefits the owners of capital. The only shared goal that management can identify is maximizing shareholder value, then individuals can use their gains to pursue whatever social goals appeal to them individually.
Increasing shareholder value doesn’t mean breaking the law or doing anything shady. That would break the main tenets of capitalism, which are the free exchange of labor for income and the free exchange of wealth (income) for goods and services. Anyone cheating on either side of employment or consumption is denying the other party of their free exchange.
This isn’t a free lunch.
I have to think that Fink and the managers at Blackrock do their best every day to increase the returns to investors. By changing their investment decisions based on something other than returns, they must be choosing less attractive investments or else they’d already be in them. Put another way, if the companies that Blackrock is targeting for divestment were already out of favor, then Blackrock wouldn’t own them in the first place.
The same goes for the CEOs. They must be changing their management decisions to include concerns beyond the prudent management of capital for the highest growth of the business. Every dollar they move from that effort is an investor’s dollar used for something other than the original purpose.
There’s very little pushback against these moves. Few are willing to stand up and be seen as acting against climate change initiatives or stronger communities. But that’s not the issue. The question is, who gets to decide? Should each of us be able to put our capital where we think it is best served for growth, protecting the environment, and improving our communities, or do we hand the last two responsibilities to unelected CEOs who are using our money?
If recent trends are any indication, the decision has already been made. We’re giving up returns in our individual stock investments and mutual funds so that investment managers and CEOs can pursue what they think is best.

January 29, 2020
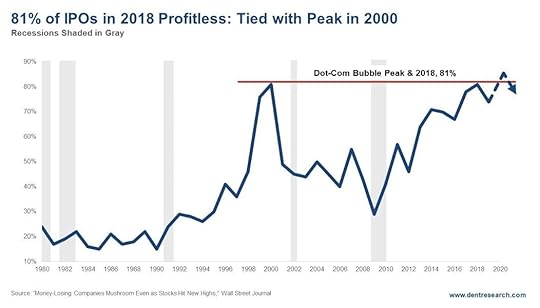
Percent of Money-Losing IPOs as High as 2000 Tech Bubble Peak
John Thomas at The Mad Hedge Fund Trader used to speak at our Dent Advisors’ Network sessions and currently speaks in Australia for my promoter there, Greg Owen at Goko. Thomas just put out a good newsletter article on the recent slew of IPOs and why he sees them mushrooming to a major peak this year, which could coincide with a tech bubble blow-off top – and that blow-off phase is already occurring from my view, starting in early October.
But first, I saw a chart that was similarly ominous. 81% of the IPOs in 2018 were profitless – the highest since 2000 also at 81%. Such questionable IPOs always appear near speculative tops like this one.
This is worrisome on its own. But Thomas brings a more impactful insight from his ear to the ground in Silicon Valley. He says there are about 220 companies valued collectively at around $700 billion that are looking to go public in 2020.
Why? Most there see a recession after the election and want to get in while the sun shines on high valuations and speculative offerings – and yes, those without profits. I showed in a recent article that 97% of corporate CFOs expect a recession to start by the end of this year.
His best estimate is that around $100 billion of stock could be actually sold from these companies with $700b billion+ collective valuations. That would be just a tad higher than the all-time peak, also back in 2000, of $96.9 billion.
Thomas astutely states that the big problem is that such high amounts of money going towards primary speculative offerings sucks money from the secondary traded markets like the Nasdaq and the high-flying FAANG stocks.

$100 billion or so would be a bit more than double the value of IPOs sold in 2018 and 2019 – a classic sign of a blow-off top. Also, note that tech stocks peaked in March of 2000.
So, most of those IPOs came after the peak and only contributed to the crash to follow – especially that first and typical 41% Nasdaq crash between late March and early June.
So, if we see such an explosion of profitless IPOs – and most won’t be big names like Facebook or Uber – then it’s time to start looking for a tech bubble peak.
I am currently expecting that to occur somewhere between late May and the election at the latest, just from the chart patterns vs. the 2000 bubble and blow-off phase.

January 28, 2020
The One Thing
In the 1991 movie City Slickers, Curly (Jack Palance) gives Mitch (Billy Crystal) a gift. Curly tells Mitch the secret of life. Curly tells him that the secret to living is, “One thing, just one thing. You stick to that and everything else don’t mean…” well, you get the point.
Mitch, being the inquisitive city type, asks what that one thing is, and Curly tells him, “That’s what you’ve got to figure out.”
It makes for a poignant scene in a comedy, but it’s a cop out. Rarely is there a time when situations beyond those experienced by three-year-olds are driven by just one thing. But there are times when just one thing can sway an entire situation, like when one of my daughters broke up with a guy because of bad breath. Was it really just that? Probably not, but the guy lost a great girl for lack of dental hygiene.
When it comes to the equity markets at the start of 2020, we’ve got a lot going on. From Phase 1 of a trade deal with China, to earnings, GDP, and low interest rates, many things are pushing on the decisions that investors make every day. But if we step back a bit, we can see that there is one thing, just one thing, that rises above the rest. If we understand that, then the rest of it falls into place.
Today, it’s just the Fed. More specifically, it’s just the Fed supporting the repo market.
The major stock indices gained around 30% last year, but not in a straight line. Or, rather, it wasn’t in a straight line until late September.
In late April, the market rolled over and lost more than 6%. After recovering, the markets dipped again in late July and early August, down another 6%.
Stocks wobbled a bit in late September, but then found their footing on September 30 and began a steady march higher with almost no volatility. We didn’t even have a scare in the normally rocky month of October.
We have one person, or group, to thank for that: Chair Powell and his band of Fed governors, and how they are dealing with the repo market.
Repos, or repurchase agreements, are contracts to lend something, like a Treasury bond, to someone in exchange for cash, with an express agreement to reverse or unwind the transaction the next day. That might not sound like a long time frame, but if someone does it every day, then it can start to make sense.
They are stringing together daily transactions that can stretch into years, allowing them to borrow at overnight rates even though they use the funds for much longer. If you own a 30-year Treasury bond at 2.3%, but can lend it to someone overnight in exchange for cash at the overnight rate of 1.5%, then you’re still earning 0.8% more than you’re paying, and you have money to buy something else. The loan needs to be repaid in the morning; just borrow again.
Individual investors don’t play this game. Hedge funds do, along with other large investment funds. They use borrowed money to increase the size of their portfolios, banking that they can earn more than the cost of borrowing. With interest rates at very low levels, this isn’t a high bar to clear.
There’s only one problem: banks aren’t required to make such loans.
In September, large banks began turning away repo business, which led the borrowers to offer ever higher interest rates to get the money. At one point, borrowers offered 10% at a time when the going rate was 2.375%. The huge jump showed that few, if any, banks wanted to lend overnight. This left the large investors in a pickle. They’d have to pay very high rates if they could get the money at all, or pare their investments.
The Fed stepped in to calm the waters, lending $120 billion in late September to get investors over the
hump. Then the Fed announced in early October it would offer about $65 billion per month in the repo market, to keep the peace. If the hedge funds needed more than that, no problem, the Fed stood ready to make good.
Since mid-September, the Fed has pumped a cool half-trillion dollars into the short-term markets specifically to keep repos flowing. At the same time, the S&P 500 is up about 11%, in almost a straight line.
We still have other things to consider.
Corporations are earning plenty of money, but earnings aren’t growing quickly. Fourth-quarter GDP is expected to be just under 2%. Phase 1 of the trade deal doesn’t remove any existing tariffs. The coronavirus could affect everything from the travel industry to international trade. And there’s always the political show in Washington.
But, as Curly told us, there’s that one thing. If the Fed decides to curtail its repo QE and large investors have to curb their purchases or even trim their portfolios, none of the rest of it will matter.

January 27, 2020
Housing Bubbles and Bursts
The biggest bubble blindness doesn’t come in stocks. People know that stocks can bubble and burst. The 1929-32 crash was most infamous, but we’ve seen two just in the last two decades: 2000-2002 for tech stocks and 2008-09 more broadly.
The next will be the worst by far.
But real estate has only seen one bubble burst of significance for well over a century: 2006-12 at 34% on average. Even 1925-33 was only a 26% crash, with a strong rebound to follow. But the demographics for real estate have changed for a long time, as a larger generation is followed by a smaller one in ultimate magnitude for the first time ever.
Most cities have recovered to slight new highs in this second bubble, driven by cheap, endlessly printed money just like stocks and bonds. But many are now much higher, from San Francisco to Denver. I was in the Miami bubble when South Beach beachfront condos were going for $800-$1,000 per square foot. Now, it’s $2,000! Manhattan is double or more the 2006-07 top.
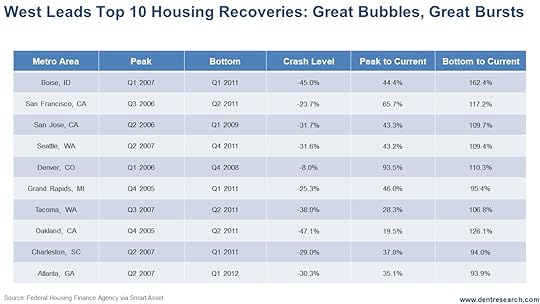
Here’s the top 10 metros that have appreciated the most from their bottoms, typically between 2011 and 2012.
I would not have guessed that Boise would be the hottest right off the bat, at a 162.4% rise since 2011. But it is a hot town with good weather (for the upper Rockies) and good jobs in the tech industry.
The other really hot cities have been mostly on the west coast: Oakland at 126.1%, San Francisco at 117.2%, Seattle at 109.4%, San Jose at 109.7%, and Tacoma at 106.8%.
For decades, migration has moved from north to south and east to west. The difference is that the western states have less developable land – often, mountainous or desert. So, there’s more demand pressure vs. supply.
Dallas is a great example of a city with endless flat land. The joke there is that “you can watch your dog run away all day.” So, despite lots of growth, prices stay more reasonable. Dallas only went down 14% in the first crash and has appreciated more this time. But it is still more reasonably priced.
Denver is another new exception. It only went down 9% last time, but has become a very popular place to live since. It has appreciated 110.3% this time and now does have much more downside. It’s the second biggest boom city in the Rockies.
The general rule of bubbles is, the greater the bubble, the greater the burst. So, these cities and more, like Manhattan and the beaches and downtown area of Miami, will burst bigger this time.
Nine out of 10 of the worst recoveries came not in the Midwest, but in the Northeast. Both regions are losing jobs and often have negative migration. But the Northeast came in more overvalued. They will tend to have much less dramatic crashes, as will the Southwest and much of the Southeast.
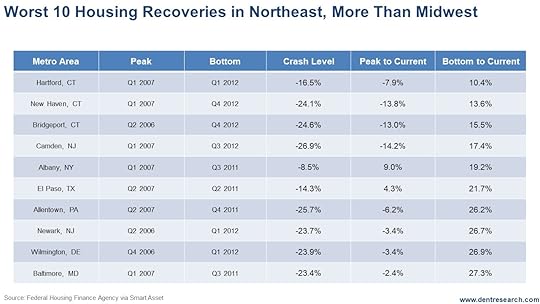
Look up your city. How much did it decline in the last bubble burst? How much has it boomed in this final bubble? The minimum downside for most will be the last lows, typically between 2011 and 2012. They could go as low as early 2000 prices at the worst.
How much do you love your real estate? All we can do is point you to the downside risk…
But the worst news: You can’t expect a big rebound next time, as boomers dying will outweigh Millennials buying in general until around 2040.
Yes, falling net demand for decades.

January 24, 2020
Eyes on the Fed
This week, I want to keep talking about the most important thing that’s been happening since mid-September of 2019: the way the Fed has had to step and combat the repo crisis, which came in directly from the Fed selling their own bonds in 2018, which drained reserves and caused banks to stop lending to each other practically overnight.
The initial thought when it happened was that it was really no big deal. Just $60 billion to start, a temporary crisis. But three-and-a-half months later, by the end of December, that figure had jumped up to $380 billion, twice the pace of peak quantitative easing in 2014.
The Fed’s been trying to taper these markets off the crack they’ve been feeding on for years now, but the markets keep saying, “No! We need this crack!”
I’ve been monitoring this weekly with my senior research analyst Dave Okenquist. What we’ve seen is that the Fed’s saying one thing, but it’s what they actually do that counts. And what they’ve done is taper off a bit. Repos have slowed down since the recent peak, a sign that there’s less of a movement to inject money into thin air.
And what has the stock market done as a result? Well, for a little while, it went straight up. Now it’s pausing, while the Fed injections actually down from the $424 billion peak to $396 billion.
So repos have gone down a bit, that’s good. But the Fed’s still going straight up on the Treasury bills, claiming it’s not really “QE.”
That’s something we’ll need to continue to watch. Short-term, stocks may back off a bit, but if repos start to accelerate or the Fed comes through with commitments, markets will go back to going straight up.
As always, we’ll keep you updated.
 P.S. Earlier this week, my Charles Street Research colleague, Michael Coolbaugh held a fascinating webinar, the Delta Profit Summit, which revealed some really impressive findings. Calling on his experience working on Wall Street, Michael showed viewers how unfair the game of trading stocks has become… but shared unprecedented insight into an algorithm Wall Street has used for years, that everyday investors can now use themselves. Click here to catch a recording of Michael’s webinar and see for yourself.

January 23, 2020
One Way to Shore Up Retiree Benefits
As the impeachment of President Trump continues and we gear up for the primary season to select a Democratic challenger, it’s worth remembering one of the biggest issues facing America that no one talks about: healthcare costs for state and local government retirees. You might be getting such a benefit as a retiree, or paying for it as a taxpayer. Either way, they’re important to you, even if you don’t think about them.
These aren’t pension costs, which occasionally we’ll hear someone say are out of hand. Once a year, the Pew Trusts or some other group will “tsk, tsk” states for not setting aside enough money to pay their pensions, and point out Kentucky, New Jersey, and Illinois as the states with the worst funding ratios – with 34%, 36%, and 38% of the assets they need to make good on the pension benefits they’ve promised, respectively.
Retiree healthcare benefits are different. Typically known as other post-employment benefits (OPEBs), healthcare costs for state and local government retirees can change along with healthcare costs in general, just like premiums change for the rest of us. This puts the governments who promised these benefits in a bind as they watch their costs march higher.
You’d think that our cities and states would fund OPEBs like they do pensions, or even more so because the costs grow faster than inflation. But they don’t.
In fact, 19 states don’t put away a single dime for OPEBs, even though their liabilities for benefits run into the billions of dollars. Only eight states have an OPEB funding ratio higher than 30%, and the total unfunded liability across the country is $700 billion. Which leaves many OPEB administrators hoping for the same thing: a Democratic win at the White House in November.
New Jersey, California, and New York essentially have zero dollars set aside to pay for retiree healthcare, while their unfunded liabilities sit at $85 billion, $78 billion, and $91 billion. Somehow, Illinois has managed to achieve a negative funding status of 0.2%, or -$106 million, against its $53 billion liability.
While each of these states lean Democrat anyway, a presidential victory in November will give them a better chance of some form of “Medicare-for-all” becoming the law of the land. With a new government healthcare option, the city and state governments could push their retirees onto the new program and hopefully reduce, if not eliminate, their OPEB costs.
Even if the governments were required to fund the premiums, the retirees would likely qualify for subsidies, which would significantly reduce the state and local government liabilities by transferring part of them to the national government. Otherwise, they’ll have to make some hard choices.
Just as with pensions, the fixes are easy to see but hard to implement. Cities and states must raise taxes to pay the benefits, lower the benefits to retirees, or some combination. But this is where cities and states have a little wiggle room.
Unlike pensions, in many states the governments can unilaterally change the benefits, which can lead to unwelcome surprises for retirees as those in Ohio are finding out.
The Ohio Public Employee Retirement System (OPERS) estimates that its healthcare program will go bankrupt by 2030. To stem, but not end, the flow of red ink, the program is dramatically cutting benefits to the more than 200,000 retirees in the system, as well as the way active workers accrue retirement healthcare benefits.
Among the changes, if a retiree is eligible for Medicare, he could lose between $600 and $1,200 in annual benefits. For retirees not yet eligible for Medicare, OPERS offer a group health program. In 2022, OPERS will eliminate that group program and instead give retirees a stipend of roughly $360, which they can use for healthcare they find on the open market. The average Silver Plan for a 55-year-old through the Affordable Care Act costs about $500, which will leave these retirees short by $140 per month, or more than $1,600 per year.
Just as with pensions, the longer we go without working on a long-term solution, the more expensive the fix becomes. But it’s political suicide to bring this up, so instead, state and local government officials sit back and wait, hoping the federal government will somehow bail them out.
P.S. In case you missed it, yesterday was a special day here at Charles Street Research with the broadcast of an unprecedented event, The Delta Profit Summit, where my colleague Michael Coolbaugh shared a wealth of extremely valuable knowledge and experience from his time on Wall Street. This includes letting viewers in on one of Wall Street’s very own algorithms and showing them how they can use it to generate impressive returns in 2020. Make sure you catch a recording of the presentation here.


