
Harry S. Dent Jr.'s Blog, page 12
November 13, 2019
The Best Immigrants
I love to ask people who they think are the highest-earning ethnic or immigrant group. They almost always guess Japanese or Chinese…
But those guesses are not even close. It’s the Indians.
Look at this chart of median household income… the average numbers would be even more skewed.
The median U.S. household income is $63,179. So, all of these Asian groups are higher. India’s is off the charts at $110,026. That is 74% higher than the U.S. average, 69% greater than the Koreans, 48% above the Chinese, and 41% more than the Japanese.
I have always attributed this to the greater English influence in the India culture over many decades. More speak English, and more are familiar with English systems and the tradition of rule of law.
I had three Indians in my Harvard Business School class – all highly analytical and great at finance. I also find they have an edge as entrepreneurs over even the Chinese.
They also end up more in the technology, scientific, and technology fields that are the most valued: 28% vs. 18% for the Chinese, 8% Korean, and a mere 5% for the U.S.
70% have bachelor degrees or higher vs. 53% for Koreans, 51% for Chinese, and 28% for the U.S. average.
I have heard no one anywhere in the world complain about Asian immigrants. Australia, where I most often travel to for speaking engagements outside of the U.S., is the largest relative beneficiary of Asian immigration.
But Indians are the best, even though we get more of their top 1% to 10%, as we do with other Asian countries. We are not seeing their average citizens, so we overestimate their cultures.
It’s always strange to me that when I say India will become the next China, most people just look at me like… “what are you smoking?”
I covered that topic in depth in the October edition of my flagship newsletter, The Leading Edge
Follow me on Twitter @Harrydentjr.
P.S. I’m excited to pass along an opportunity for those of you looking to take advantage of this bull market, while it’s still roaring… my colleague, Adam O’Dell is holding a live webinar on Tuesday, Nov. 19th, where he’ll reveal his innovative timing strategy that has earned an average of 46% gains on every trade recommendation. You can sign up for free, here!


November 12, 2019
Get In the Holiday Spirit
I peruse at least two newspapers, three blogs, and one financial news program before breakfast. Once I get the official workday underway, I dive deeper into research on the Fed, consumer spending, or whatever happens to be the topic du jour.
Using my knowledge, I write mostly about economic trends and work to bring you the best forecast of where our economy is headed. In return, hundreds of thousands of readers sign up for our daily and monthly missives.
I thank you, but I also recognize that, collectively, we’re just a drop in the bucket. And that’s not uncommon.
The Wall Street Journal is among the most recognized newspapers in the world. The paper serves as something of a counterweight to the New York Times, but is clearly geared toward economics and investing. As of August of this year, just 2.6 million people subscribe to the Journal, which includes 1.8 million digital subscriptions (many subscribers read on both mediums). That’s about 10% of the adult population in the U.S., even though the numbers include people in other countries.
The Investor’s Business Daily goes to great lengths to tell you how great things are, but isn’t quite forthcoming with subscription data. Whatever the numbers, they are less than the Wall Street Journal.
And CNBC? The channel fails to capture more than 200,000 viewers on a regular basis, and its most successful segment has nothing to do with money. It’s Jay Leno’s Garage.
Few people in this country consume financial news, and we should all be thankful.
Reasons to be Thankful
If more people read about slowing business investment, they might be nervous about what could happen in 2020. If people understood the asset bubbles created by the Fed, they might start hiding cash in their mattresses. If the regular man on the street could see how the U.S. will struggle financially no matter who gets elected in 2020, he might snap his wallet shut and refuse to spend a penny.
But that’s not the world we live in.
Instead, most people get their news from the local television station, with news websites and talk radio coming in second and third. Even social media news ranks above newspapers. As for their economic outlook, the typical American has one metric: Am I employed?
On that score, things look awesome! The national unemployment rate ticked up a bit to 3.6% in October, but it remains near 50-year lows. If you want a job, you can get a job, and that makes most people feel pretty good about their personal situation. Who are we to tell people any different?
Over the next 45 days, Americans will spend an estimated $730 billion on holiday gifts, according to the National Retail Federation, a 4% increase over last year. That’s almost double the holiday spending growth in 2018, which was marred by a government shutdown and a huge selloff on Wall Street.
This year we have impeachment, but it’s hard to tell if people on the street are paying much attention. The farther we get from D.C., the more it looks like partisan posturing. I doubt it will it interfere with holiday cheer.
A Bit of Holiday Cheer
One-fifth of annual retail sales happen during the holiday season, and for many retailers, the number is closer to one-third. If you’re part of this group, bulk up and prepare for a banner year.
Americans have paychecks, the variable most closely correlated to consumer spending, and average hourly earnings increased by about 3% this year. They aren’t reading my words as I warn about looming financial storms created by central banks, and they don’t care that businesses are spending less on the factors of production. Those are stories in papers that other people read and worry about.
The wheels might come off the economic bus in 2020, but for now, it’s the most wonderful time of the year!
P.S. For those investors looking to take advantage of this bull market while it’s still roaring, Dent Research’s Chief Investment Strategist, Adam O’Dell is holding a live webinar where he’ll pull back the curtains on his innovative timing strategy that has earned an average of 46% gains on every trade recommendation. Sign up for free here!

November 11, 2019
What Does Wall Street See that These Charts Don’t?
Wall Street continues to be convinced that the economy is edging back up again after a stall following the tax cut boost and near 3% GDP figures in 2018.
I talked last Monday about how there were some key indicators like industrial production growth and construction spending that were not confirming such a resurgence… at least not yet. And such falling trends tend to be a leading indicator of falling profits.
This chart is more disturbing, as it comes from those very CEOs that got the direct benefits from the tax cuts at the beginning of 2018. Their confidence in the economy is not just slowing, it is plunging!
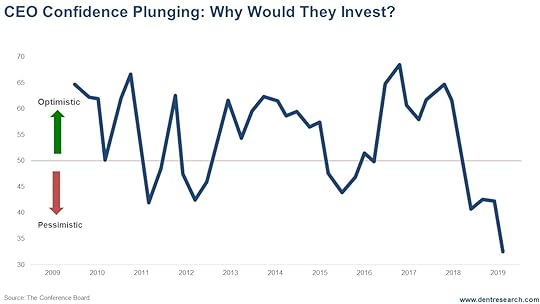 They clearly and haven’t been making significant investments in new capacity as they don’t need it. The publicly-traded ones are buying their own stocks to goose earnings per share instead.
But are they seeing signs of declining demand from their customers? Are they worried about Trump getting impeached and ending the corporate tax and deregulation gravy train? All, legitimate concerns, which could accelerate the pending financial crisis. Wall Street is clearly not reacting much to that threat yet.
The next chart also clearly shows that earnings per share are cratering as well. Part of that is to be expected as the surge from the tax cuts does not continue forward. But the actual 4% decline in the third quarter should be alarming.
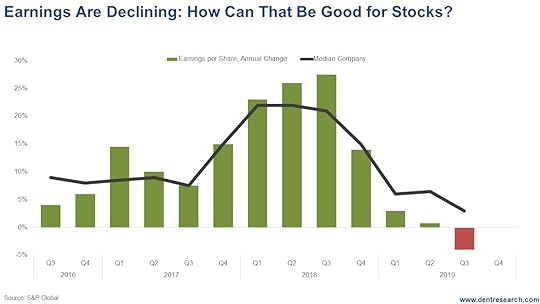 This combination of indicators simply does not bode well for the stock market, yet it keeps edging up. How long can the markets continue to be divorced from Main Street and the real world?
So, what does Wall Street see that these charts don’t?
Good question…
I say it simply sees “more crack” from lower rates and more QE.
How much longer can that last?

November 8, 2019
Manipulating the Megaphone
I’ve been harping on this megaphone pattern for quite a while now, but you’ve got to remember, there’s a reason why these megaphones are so important for predictions: They tend to occur at the major tops before a fall.
Think 1965, 1968, and again in 1972. Three tops to what’s clearly now a megaphone. What happened after that? Surely you remember 1974.
Now we’re in a bigger one – a megaphone pattern that takes a little longer for the highs to get to new highs and the lows get to new lows. But we’re in it, and have been since 2000… 2007… now 2019.. We’re building tension, raising the stakes with every turn. It’s something I’ve been covering often in the 5 Day Forecast.
So, what do you do? Well, you can ride things out a little longer; there’s always a chance we’ll get more tension, higher stakes (and a better time to cash out on your investment). But there’s always two scenarios: markets can go up and quickly as they can go down.
By the way, Adam O’Dell is the best trading expert I know at pinpointing these types of swings before they happen. His Green Zone Stocks service is light-years ahead of the rest on this kind of stuff: maximizing the wins and minimizing the losses, allowing wins to run longer and cut the losses shorter.
That’s how you beat it, but it’s not exactly easy.
Maybe the better question is, what do you do if you’re not Adam O’Dell? I talk a bit more about that in this week’s Friday Rant.
As we approach a critical time in the markets, it’s important to ask how the megaphone pattern is being affected. Harry Dent warns of higher highs and lower lows while noting that now is the optimum time to lighten up, sell or hedge your stocks with put options.Sign up for Boom & Bust here: https://pro.dentresearch.com/m/1051908
Posted by Economy and Markets on Friday, November 8, 2019

November 7, 2019
Wasting Money on CEOs
Last weekend McDonald’s dismissed CEO Steve Easterbrook for having a consensual relationship with a subordinate. The relationship broke the rules, which Easterbrook admits. The company obviously fired him for cause. For his troubles, he walks out the door with $700,000 in severance, plus a potential $70 million in stock and options.
It must be terrible to hang your head in shame while driving a Ferrari, eating in nice restaurants, and vacationing in Davos.
The pot of gold Easterbrook inherited upon his exit brings up the wealth at the other end of the rainbow, when CEOs are hired. If you want to find an example of compensation inequality run amok, look no further than the corporate boardroom.
For a bunch of people who are supposedly good at math, corporate boards of directors follow a logic that contains a serious flaw. Wanting to hire “great talent,” or “visionary leaders,” or whatever buzzwords they use that day, the boards appoint compensation committees to create pay packages for CEOs. The committees probably hire consulting firms, which survey similar companies to determine the going rate.
McDonald’s Wasted Money
But no one wants to pay the going rate. It would get you a run-of-the-mill, same-as-the-other-guy executive. So they set the compensation just above the average.
Seems reasonable, until you realize that every time this happens it moves the average higher because each company sets the bar a little higher, driving up the overall number.
And for what?
Did McDonald’s really need to pay Steve Easterbrook $1.3 million in salary last year, plus another $15 million in stock and options? Is there no one qualified to run the company who would work for less? Did Easterbrook bring some incredible knowledge of hamburgers and fast food service that no one else possessed?
I’m not picking on Easterbrook, I’m just pointing out that most large companies are ongoing concerns with many functioning parts run by division heads with exceptional knowledge of their areas. They aren’t Apple relying on Steve Jobs to bless the next iPod or iPhone. Tomorrow, McDonald’s will still makes fast food. It might try out meatless burgers. It might tweak the breakfast menu. But, surely, there’s someone who would take the management helm for a wee bit less than $16 million.
And What About General Motors?
Mary Barra earned $21 million last year, with more than $2 million in salary. This is a car company that was able to jettison its debt in 2009 and then have the U.S. government create demand by offering the cash-for-clunkers program. The “new” GM went public almost exactly nine years ago at $34. Today it trades just over $38, a whopping 12% gain when the S&P 500 gained more than 120%. Why are General Motors shareholders paying millions for that?
Why do companies treat CEOs different from every other employee, where they try to get the most work for the lowest amount of compensation? I’d imagine there’s a person or two at GM – or Ford or Fiat Chrysler, for that matter – who would take the helm of GM for, say, $1 million. Maybe throw in a company car. But $20 million in stock? Not a chance.
In the 1950s, the typical CEO made about 20 times what the worker on the line made. Last year, that number was 287 times. It’s hard to argue that we’re almost 15 times better off for paying these people that much money.
Accountability Is the Hard Part
No one wants to rain on the compensation parade. Why would board members, many of whom run other companies, want to kill the goose that laid the golden egg? And stockholders? The largest stockholders are institutions run by some of the very same people who benefit from the circular system.
But this is where we need to be careful. In an election year with the word inequality thrown around, we’re likely to get a government solution to a private sector problem. The only thing worse than effectively letting CEOs set each others’ compensation would be to require government approval. If that happened, we’d likely see many companies go private and IPOs dry up as managers and owners did their best to avoid the bright lights of big government.
We wouldn’t be able to complain anymore but was also wouldn’t have many stocks in which to invest.
Maybe I’ll just fill out my corporate voting ballots as they come in over the next year. I’ll cast my vote to throw out as much of the board as possible. It won’t help, but it will make me feel better.

November 6, 2019
What’s Driving Gold?
I have shown conclusively in my ebook on gold, How to Survive & Thrive During the Next Gold Bust , and past newsletter issues that gold correlates primarily with inflation rates – not just in the past century, but back to the 1700s!
I have also shown that inflation correlates most with workforce growth. We will not see inflation rates like anything in the 1970s again, or at least not for many decades as births and workforce growth are slowing everywhere. It was a global baby boom that caused inflation rates to go the highest outside of war times in modern history into 1980. The U.S. saw as high as 16%.
I have also claimed that commodities and gold could see the greatest boom yet into the next 30-Year Commodity Cycle into 2038-40. But how does that happen for gold if inflation rates will be lower in the future, even in emerging countries that have better demographic trends?
Consumer Demand… That’s How!
Virtually all of the demographic growth will come in the emerging world after this boom – and most of that in the developed world in the last 30 years came from the U.S. and its large immigration patterns into 2001.
Emerging countries spend disproportionately more on commodities – more like 60% of income in India today and 40% in China. This is why I see a strong commodity boom and bubble in the next cycle despite lower inflation rates (yet, still higher than in the current deflationary period).
I have also projected in the October Leading Edge that India, not China, will be the largest country in GDP in the world by 2065, and even more dominant by 2100 when Asia will rule more completely on a 165-year East-West cycle.
Just guess which consumers spend the most on gold – for jewelry and investment?
India! And by a lot.
Keep an Eye on China and India
Here’s the top 10 countries in consumer purchases of gold as a % of GDP and household spending. This table ranks by the highest % of GDP.

China has the largest overall spending on gold due to being the largest emerging country in GDP by far and the second largest overall. But China at 0.30% does not even make the top 10 list on gold spending here as a % of GDP, although Hong Kong does at o.59%. India is a whopping 1.14% and 1.91% of household income. I’ve always said that Indians wear gold in places we can’t even imagine.
Vietnam and Thailand come next at 0.99% and 0.65%. Southeast Asia is my second region for stellar growth in the next global boom.
Just for reference: The global average is 0.16% of GDP and 0.29% of household income.
Note that all of the top 10 here are in Asia or the Middle East. The U.S. is a mere 0.03% of GDP, and Germany, second only to Switzerland in Europe, comes in at only 0.11%. Developed western countries do spend much less relatively on gold and commodities.
Conclusion: The next global boom will be dominated by emerging countries, especially Asia and India. China and India together are already 53% of global consumer gold demand…
Imagine what happens when India grows nearly as fast as China did in the last boom and spends 3 – 4 times as much on gold with Southeast Asia and much of the Middle East chiming in at high rates.
Gold production only grows historically at about 2% a year. The demand from emerging countries led by India will be much higher than that!

November 5, 2019
Oilmageddon and the Global Economy
I grew up on the Gulf Coast, beginning in Florida, then over to Texas, then part way back to Louisiana. We weren’t testing beaches, we were following boats. My stepfather joined our family when I was quite young, essentially becoming my parent. He took a job on a shrimp boat in the Florida panhandle and eventually migrated to the oil boats, which took him, and us, to other port towns.
It was the late 1970s, and the oil field was booming.
About the time I went to college, the oil field went bust. My dad, who’d moved up the ranks, was an anchor captain, which meant he could lead the team of ships that move oil rigs and set the anchors. At one point, he was one of just eight captains working in the Gulf of Mexico, and the only anchor captain. But it didn’t matter, there was nothing to move.
The problem wasn’t with the domestic industry, it was thousands of miles away in the Middle East. In response to the oil crises of the 1970s, the Sauds and others developed more fields and flooded the market with oil in the 1980s. It took years to absorb.
Over the next couple of years, we might get a condensed version of the same story.
A New Landscape
On our current trajectory, the U.S. will become the largest oil producer in the world by 2021. We’re already the largest energy producer, which includes natural gas, and have been increasing our crude exports since President Obama opened that market in 2015. In a role reversal that has given me great joy, we’ve become the thorn in the sides of Middle Eastern countries as they struggle to hold back supply to support higher prices.
The less they produce, the more we produce. Prices remain stable, and yet less money flows to that region of the world.
But now there are new forces on the horizon.
In addition to new pipelines in North America, we’re also about to get more oil from deep water projects in Brazil and Guyana, which could add one million barrels of oil per day to the world supply in 2020, and another million barrels per day in 2021.
That additional supply would be on top of whatever increase comes from countries like Iran and Venezuela, where government policies have dramatically constricted the flow of oil.
Added together, we could see global oil supply increase 2% to 3% or more over the next 18 months, just as the world economy slows down. The IMF recently downgraded its world GDP estimate for this year to 3%, and lowered its estimate for 2020 to 3.4%. The bank cites things like the trade war as a hurdle for growth this year, but also notes that stubborn factors such as aging populations and low productivity growth are also to blame.
No Fun in the Oil Patch
The colliding forces will create a backlash that rips through the energy market, taking out marginal players who can’t survive as the price of oil drops through $40 per barrel.
The pain at home will be felt among oil producers, but refiners will be sitting pretty. The middlemen who make gasoline out of the raw stuff always seem to move gas prices down slowly even as the price of oil drops in chunks. The widening spread gives them a bigger profit.
It might not be a fun time in the oil patch, but it will be much worse overseas, where oil revenue flows into national coffers. Across the Middle East and North Africa, low oil prices can lead to geopolitical instability.
Earlier this year, the IMF projected that Saudi Arabia needed oil at $73 or higher to balance its books. Iran needed oil prices at almost $100, and that was before tough U.S. sanctions squeezed their exports. Now that number is north of $190, which won’t happen.
Countries including Angola, Libya, Nigeria, Qatar, and the United Arab Emirates depend on oil prices well north of $60 to balance their budgets. A prolonged drop south of $50, and even some months in the $30’s, will be so difficult that it might cause civil unrest, exacerbating already slow economic conditions.
OPEC just announced that it expects to lower oil supply by 2.2 million barrels over the next two years to counterbalance the increased supply from other producers. As the OPEC countries sell fewer barrels, they need to receive higher prices to get the revenue necessary to pay their bills. Those countries are in a tough spot, to say the least.
And Then There’s Russia
Russian President Vladimir Putin said last summer that Russia’s comfortable with oil around $60, and can function well, replacing its gold and forex reserves, with oil at $40. We’ll see if that’s true.
The one group that will do well as a whole is the energy-consuming public. Lower oil prices put a little more jingle in the consumer’s pocket, which allows them to spend more on other things. As long as they’re still employed during the global slowdown and their countries don’t suffer with civil unrest, they’ll have a little more cash to spend on other things.

November 4, 2019
Some Indicators That Don’t Confirm Economic Resurgence
When David Stockman spoke at our IES conference in October, he had a whole slew of charts that showed that the main street economy had nothing to do with the Wall Street one – and that there were more signs of weakening growth than strengthening.
He recently showed some updates and these were the two that most caught my eye. Both of these are from the more cyclical sectors that most often cause recessions.
Look at the year-over-year change in Industrial Production.

Industrial Production Decline
This indicator just crossed zero again and would suggest a recession sometime next year. More interesting to me is the overall pattern. The first peak came in late 1997. It was followed by a modest fall into 1998 and then a tepid bounce into early 2000. Then came a more substantial decline into the mild recession of 2001 to -6%. And then a bigger, longer bounce back to positive, followed by the dramatic decline to -16% into the great recession into the latter part of 2009.
The final bottom came almost 12 years after the peak.
The next peak came very sharply with the dramatic first QE steroid shot into mid-2010 That was followed by a mild drop and more sideways bounce into 2014. Then there was a larger drop to -5% into early 2016 – a near recession, now that QE was countering any such thing. Then a bounce back positive again and now a potentially final drop that has already crossed zero.
I fully expect this decline to go much lower than the last one at -16% to 20-25%+. A 12-year lag on the 2010 peak would put this bottom into 2022. I expect late 2022+.
Construction Spending
The next indicator has more of a megaphone pattern with slightly higher highs and progressively lower lows – mimicking the pattern I have been seeing in the stock markets, longer and shorter term.

There was a modest dip in construction that didn’t go negative from 1994 into 1995. After a rebound into late 1999, the next dip came into mid-2002 and went to -1% in that mild recession. And then there was another slight new high into late 1995 (when I called for a housing bubble top) and then the dramatic plunge down to -18% from late 1995 into 2009.
Since, we have seen another slightly higher growth peak in 2018 and a decline that has thus far fallen to -3%. A lower low this time would suggest a plunge to -25%+!!!
So, the big question is: When do the ever-optimistic “markets on crack” get the picture?

November 1, 2019
The Chinese Real Estate Dilemma
Today’s rant covers an unusual topic: China. No, not Chinese trade. We talk about that plenty. Rather, today I want to talk about a new angle on Chinese real estate.
Chinese Real Estate
The Chinese are strange real estate investors, largely because its communist government had not broadly allowed real estate ownership until recently in history. It’s really only been the past 30 years or so, and during that time we’ve seen this massive urbanization project that has created the biggest bubble in history, and paradoxically amidst very high vacancy rates..
And all the energy thrown into real estate has only been self-perpetuating, with the nouveau-riche class now hell-bent on acquiring more real estate since they’ve seen its value and appeal increase.
They’re about to find that they’ve been very, very wrong.
Eighty-nine percent of Chinese real estate is owned, not rented. There’s not much of a rental market, only 2% of all housing in dollar value.
What’s that mean? It means we’re about to see a significant uptick in renting. It’s simple economics really: Real estate’s getting ever more expensive, making it harder to buy a home. Also, lots of people in China already own two or three homes, meaning there’s an abundance of housing stock with 22% of it empty. Many households have to inhabit jointly to afford and that is not what most would want.. So renting will have to get more popular, while those who bought so advantageously thus far will find that they’re the ones at the disadvantage.
Renting will be the big trend going forward at much more affordable prices freeing people to live without all of their relatives with them!
Strangest Real Estate Investor Ever: China
89% of Chinese real estate is owned, not rented…and 75% of Chinese net worth is in real estate. Harry Dent dives into the numbers behind Chinese real estate investment market, breaking down just how perilous speculation of empty housing developments could be…. even if it comes with a silver lining of self-correction. Sign up for Boom & Bust here: https://pro.dentresearch.com/m/1051908
Posted by Economy and Markets on Friday, November 1, 2019

October 31, 2019
Americans Need to Move
It’s been two days since my movers met my contractors. I don’t mean a “Hey-nice-to-meet-you” kind of greeting; it was more of a “get-out-of-my-way-I’m-working-here.” My planned extrication from my old digs into my partially-renovated new home didn’t go like I thought it would. The exercise brought to mind the paraphrased wisdom of Von Moltke: “No battle plan survives first contact with the enemy.”
My contractor has been fabulous. And my mover was pretty good. But the flooring suppliers and others couldn’t seem to get materials out when they promised.
I’m now hiding in my home office amongst a sea of boxed and unpainted walls, putting off the many jobs that will take up my nights and weekends for months to come.
But that’s alright. I chose this. Many people ask why we moved, and sometimes I lay out the same answers I’ve written here before. The move accomplished several things for us, so we’re making progress in the grand scheme of things even if the details keep getting in our way.
The better question people should ask is, “Why aren’t other people moving?”
Stuck in First
The U.S. economy remains dynamic, even if stuck in a low gear. Employers struggle to find workers in some areas of the country just as firms lay off workers in others. But over the last 20 years, we’ve become sedentary, choosing to stay in a location even if we’d be better off packing up and heading out, and it’s holding us back.
From August 2017 to August 2018, the Census Bureau reports that only 10.1% of adults moved homes. That’s down from 15% in 2000, and almost 20% in the mid-1980s. The recent number of adults moving is the lowest figure recorded by the Census Bureau since it began keeping records in the 1940s.
And it’s not that we’re getting older. Yes, Boomers are aging and we’d expect them to move less, but the Millennials aren’t getting across the nation for their next gig.
In 1963, 26% of the Silent Generation was on the move; in 1990, 27% of the Boomers were packing up and moving out; and in 2000, 26% of Gen-X changed addresses. In 2016, just 20% of the Millennials made a move.
From 2017 to 2018, only 3.8 million people listed looking for work or a new job as the reason for their move, well off the 5 million people who reported the same in the early 2000s. That’s a 24% drop, but it’s worse than it appears. Since the early 2000s, the population expanded by more than 30 million people, or about 10%.
No Easy Answers
The reason people choose not to move isn’t clear. Unemployment and moving aren’t highly correlated, so it’s not a matter of people finding what they need around the corner. We still have a substantial mismatch between available labor, both unemployed and underemployed – and jobs that would best utilize their skills.
Housing costs are one factor that could be gumming up the works. If your best prospects are near a large city, but you worry about finding affordable housing that’s of a level you’d actually like to live in, then you might be persuaded to stay put, where at least you’ll be comfortable. That might make sense for you personally, but it’s holding back the nation.
If you’re considering a job change, you might look farther afield than your immediate area. Maybe you want warmer winters, or perhaps a view of the mountains. If you know a young person stuck in a job they don’t like, show them job listings in Denver or Dallas.
And if they need boxes, give them my email address. I’ll be happy to send them as many boxes as they need in exchange for an hour or two of house painting.


