
Harry S. Dent Jr.'s Blog, page 15
October 3, 2019
Home Price Index Moves Toward Zero … What’s Your Plan?
The real estate industry must have the best lobbyists in the country. How else can you explain that a data-driven transaction – buying or selling a home – has become more onerous, and more cumbersome. And overall more painful even as information becomes cheaper and easier to get?
These guys are protecting their turf, and we’re paying for it.
My Next Home
As I prepare to buy our next home, I’ve had to jump through a million hoops not once, but twice, proving who I am and where my funds originate.
I’m thinking of inviting the title company to our next holiday gathering. They know so much about us, they’re like family now.
But we’re in the final stretch. In ten days, I’ll buy the new home, and then I’ll sell my current house about two weeks after that. I’m hoping to get a little renovation done before we move in, but that requires cooperation from a contractor, which is always a question.
As we get near the end, I’m dealing with questions about appliances and tile at the new home, and last-minute, minor repairs on the old house. While these are moving targets, one thing remains consistent: Once we move, we will have accomplished several of the things I’ve preached for years. We will shrink our taxable footprint, step out of the way of rising flood insurance costs, and lower our exposure to an extended real estate market.
Given how the economy is unfolding, our timing is pretty good.
The State of Current Affairs
The ISM Manufacturing Index just came in at 47.8, well below the expected reading of 50, which happens to be the dividing line between growth and contraction. The low number is the second consecutive reading below 50, and the lowest reading since 2009. New export orders were the worst, pushed lower by the strong dollar and the trade war.
But if we suddenly lifted tariffs tomorrow, would export orders explode? What major country is doing so well as to want so much more of our stuff? China has its own set of domestic issues while the European Union fights over Brexit and falling German exports.
A weak economy could be President Trump’s undoing, which could drive political change in 2020. I don’t doubt for a minute that such change would drive up my tax bill.
As for flood insurance, those of us who live in nice houses in coastal areas have been subsidized for a long time. The cost of national flood insurance was supposed to move toward market rates in 2013. However, President Obama declared a moratorium when the proposed changes put waterfront real estate in the deep freeze.
The moratorium ends next year, and President Trump has already declared that new rates will be set in April 2020, and will be charged in October.
Location, Location, Location
As for real estate in general, well, there is no such thing. Real estate is always local.
Except for Austin, the Texas market never seems to get too far out of control. But as I’ve gone through the process of selling my home, it’s become clear that higher-priced homes move achingly slow. While homes at the median seem to come and go quickly. Being in a large home on the water, with the economy potentially dropping to a lower gear and flood insurance rates moving higher, seems like a bad plan.
Last week the S&P CoreLogic Case-Shiller 20-City Home Price Index came in flat for the month, and up just 2% over last year. The growth rate has been trending lower for more than a year, moving in a steady march from 6% toward zero.
This is happening with unemployment under 4%, long-term interest rates under 3%, and economic growth muddling along between 2% and 3%.
Manhattan home prices dropped 8% in the third quarter, and prices fell over the past year in some of the hippest places in California, from Cupertino (-11.5%) to Palo Alto (-12.3%).
I don’t live in either of those places, but I pay attention.
Part of our goal at Dent Research is to give you the best information and analysis we can, so that you can make the most informed decisions. That doesn’t mean you’ll follow my footsteps, selling a great home to get ahead of potential economic changes. But it does let you ponder the possibilities. And hopefully give you the satisfaction that you made a well-considered choice… no matter where you choose to live.


October 2, 2019
Miami the First U.S. Real Estate Bubble to Burst?
Earlier this week I read a great article by Kuppy at Adventures In Capitalism. It brought back memories of the last condo and real estate bubble in Miami… I was there. I was moving to Tampa and sold before the crash that I was nearly alone in forecasting in late 2005 .
Kuppy noted that prices had plateaued for a few years and had begun to drop 20% to 35% in South Beach – and worse in the downtown Brickell area. He talks to a friend who makes non-traditional loans against these condos, and he says “it’s about to blow… just give it six to nine months.”
Miami is Bubble City
It’s a part-time vacation town for many, a show-off place that’s big on laundering money into real estate from drug dealers in South America and so on. At night most are empty with no lights on, even in season.
Builders get on a roll at $300 per sq. ft. costs, selling for $700,000+. So, they keep building until it blows. I was there a year ago and saw more than twice as many cranes as at the last top in 2005-6.
Most buyers put 20% or less down and don’t even have to come up with the rest until completion. They borrow, and borrow more if needed as the prices rise. But when they stagnate or fall, they quickly get into trouble… It’s the carrying costs that average 4% to 7% before financing. The property taxes are 2% alone – I know because I paid that.
When people start to default, the non-traditional lenders add penalty interest and the banks refuse to lend further after prices start to drop. Builders just keep adding inventory to a glut as it pays them short term to complete.
Finally, the lenders start to panic and force fire sales. Miami was the biggest bubble crash in the last real estate bust, averaging 52%. It will be higher this time. The market is dominated by even higher “faker luxury” condos. Larger with more flamboyant features. Those are the hardest to unload when prices drop, says Kuppy’s lending friend.
Is this the First Major Market to Blow?
This chart shows how much prices dropped between Q1 and Q2 this year… what?

The broader market for condos fell 13.6%, homes 17.9%. But as is happening around the world from Sydney to London to Manhattan, the high-end market is leading. Luxury condos are down 23.1% and homes 25.4%.
The next chart shows the range for condos in the Miami area. The worst drop was North Beach at a whopping 48.4%. Fisher Island dropped the least at 11.0%. But it was already down starting in Q2 2018 and is down 24% cumulatively from the top. South Beach came in the middle at 21.7%. Going back to Q2 2018, Key Biscayne condos are down 37.2%.

All it takes is one prominent market to have a crash to get investors spooked and lenders downright paranoid.
Based on the “crane indicator” alone, Miami does look like the first major market to blow… and many more will follow.
Do you want to wait and see… and hope you get lucky? Real estate and lending get tight fast!
And to my Australia subscribers: Don’t follow the crowd there that thinks your sharp correction is over and it’s time to buy. You are the “lead dog” in this global crash, like the U.S. was last time.

October 1, 2019
The Law Won’t Protect Your Money
I’m tired of the impeachment talk and it hasn’t really started yet. With the House working on impeachment inquiries in several committees, we’ll get a healthy dose of political doublespeak from everyone involved for at least the rest of this year. It’s already started to crowd other stories out of the news cycle.
But we have to pay attention, because other things are happening that will directly affect us in the months and years to come.
We got a glimpse of our financial future at the end of last week when the first reports about Puerto Rico’s proposed financial settlement came to light. It’s not finished, but we know two things: The law will be ignored, and investors will get crushed.
Get used to it, this is our future.
The Coming of PROMESA
Puerto Rico is arguably the worst financially managed state or territory under U.S. jurisdiction. After gaining independent budget authority from Congress in the early 1980s and promising to be responsible, the island found itself $129 billion in the hole. That includes a pension system with $50 billion in liabilities and assets of exactly nothing.
There’s no provision in the law for a state or territory to go bankrupt. They can only cut expenses (services and pension payments) and raise taxes to make good on their obligations. The Puerto Ricans didn’t like those options, so they went to Congress and asked for a pass. Congress gave them PROMESA, a law that allowed Puerto Rico to pursue bankruptcy in all but name. And it came with an oversight board that can impose its will on the island government.
The creditors lined up and showed their claims, and then pointed to the Puerto Rican Constitution, which clearly states that bondholders are to be paid first. Not after state workers, not after pensioners, not after any other line item in the Commonwealth’s budget.
The Puerto Rican Constitution’s Article IV, General Provisions, Section 8, reads:
In case the available revenues including surplus for any fiscal year are insufficient to meet the appropriations made for that year, interest on the public debt and amortization thereof shall first be paid, and other disbursements shall thereafter be made in accordance with the order of priorities established by law.
Investors are Taking the Fall
Given the clear directive in the document, you might think the government is paying bondholders and that they stand to get a hefty percentage of what they’re owed. Of course, that would be wrong.
In the plan just released by the PROMESA board, the general obligation bondholders, those with a claim on the full faith and credit of the Puerto Rican government and who can claim a constitutionally guaranteed right to payment, will see their investments slashed by 66%. That’s not down to 66%, this investor class will be left with just over one-third of the original money lent.
Pensioners, those counting on the empty bucket that the government used to pay for other things for decades, will see their payments cut 17% overall. With most of them getting more than 90% of what they are due.
This Will Only Continue
There are no good answers here. For decades, politicians borrowed too much and put too little into pension fund accounts. But there’s no method for reaching back to those individuals to make things. And the Fed hasn’t done anyone any favors.
The ultra-low interest rate environment has killed pension funds on both sides of the ledger. Their fixed-income earnings are lower as yields fall, and the present value of their liabilities has shot to the moon. They earn less and owe more.
The bill came due for Puerto Rico, and true to the nature of man and government, the rally cry is, “The law be damned! What about the people?”
Illinois pension funding sits at 38%, while New Jersey has just 36% of what it needs. The worst is Kentucky, at a mere 34%.
When the day finally comes that these states can’t make good on their obligations, they’ll demand that the federal government set up a structure that allows them to renegotiate their debts. Those are not-so-veiled code words that mean cram down bondholders.
As for Puerto Rico, there is one group of winners: those who invested in identified streams of revenue, such as university bonds and water authority bonds. Because the monies weren’t comingled into a general fund, and the sources of revenue are clear, investors still get what they’re due.
We’ve seen this movie before, in Detroit. And we’ll see it again soon in Chicago.
The situation brings the old Ronald Reagan quote to mind, “Trust, but verify.” A government might say they will pay you back, and even show you the legal contract, but it’s your job to verify that the stream of money is sufficient to the task .
If not, you might just end up with nothing but empty promises, because we’ve seen time and again that the law will not be followed.

September 30, 2019
UkraineGate Killed the Immigrant Conversation
Speaker of the House Nancy Pelosi sucked all the legislative air out of the room when she formally announced an impeachment inquiry against President Trump. The charge, of course, is based on a whistleblower’s allegations. This is not an impeachment proceeding, which requires a vote on the floor of the House of Representatives and directs the Judiciary Committee to undertake an investigation. Pelosi’s announcement creates nothing formal and doesn’t start any inquiry. It merely directs existing committees to keep doing what they’ve been doing, scrutinizing Trump’s actions, looking for an impeachable offense.
Maybe they found one in the Ukranian phone call. Maybe not. But there’s no question the latest brouhaha has at least one casualty – everything else on the legislative agenda.
Immigration Will Take a Backseat
It’s conceivable that most conversations on Capitol Hill for the rest of this Congressional session will center on the whistleblower’s identity, intent, and report. There will be Congressmen on both sides of the aisle debating the facts of the case, the level of wrongdoing, if any. And the advisability of moving toward impeachment so close to a presidential election.
Everything else they might have discussed will have to wait, including immigration. That’s not just unfortunate, it’s a travesty.
The health of the nation depends on a vibrant, growing population, and the domestic population doesn’t have enough kids to keep things going. Women of childbearing age are having just 1.7 kids, That’s not enough to maintain the current size of the population, much less increase it.
American women still want children, but for various reasons aren’t having as many as they want. Unless we’re going to start forcing people to have kids, which obviously is a non-starter, we either have to resign ourselves to a flat population or accept more immigrants.
Trump’s Immigration Policy
President Trump just approved the U.S. to accept a mere 18,000 refugees next year, down from 30,000 this year. And it’s a fraction of the 110,000 in the last year of the Obama administration. These are people who apply to the U.N. for refugee status, and then apply for entry to countries that have agreed to accept refugees. They aren’t border hoppers looking for better paying jobs. They’re people whose homes have been bombed out of existence, or whose cultural groups have been persecuted. They have no Truhome.
The Trump administration noted that it lowered the limit to protect the security of the nation. That’s a stretch. Refugees are vetted at least twice, once by the U.N. and then again by the U.S. This is politics, and that’s the problem.
The immigration policy of the U.S. is a mish-mash of administrative directives, laws, and court interpretations. The murder and crime rates in Central America have fallen in the last two years. And yet a record number of asylum seekers are knocking on our door because in 2015 a judge (in the Flores agreement) decided that accompanied children can’t be incarcerated while their parents await a hearing. This led to “catch and release,” where anyone traveling with kids and seeking asylum was released into the U.S. and allowed to legally work while awaiting their hearing. Amazingly, the number of asylum seekers with children exploded.
We Need Registration Reform
I’m not knocking them. If I worried about my family’s safety and saw few economic prospects in my home town, I’d look to move as well. And if I saw the chance to enter the U.S., I’d take it.
But through a court ruling we created an unintended loophole, which adds to the vagaries of the lottery system for work visas, and the uneven enforcement of employment laws.
And then there are the so-called Dreamers, the millions of children brought to the U.S. by their parents, who have known nothing but this country and yet are not legal residents.
Whether we think they should stay or go, they deserve more than limbo.
All of this cries out for legislative reform. We need action on one of the biggest issues that will shape the future of our country for decades to come. The U.S. remains an attractive destination, and immigration has been the bedrock of our nation since its founding.
But instead, we’re going to watch our elected officials fight over something that most Americans couldn’t care less about. While every day we watch our long-term potential growth slide a little bit lower.

September 27, 2019
A Critical Moment
We woke up today to find the markets in a critical place. Bitcoin has had a big fallout, the flashing lights are blinking. All the signs that we could be headed for a big fall are in effect.
But there are a few current events ongoing that the markets don’t seem to be accounting for – primarily, the tremendous dip in approval ratings the president Donald Trump has recently incurred. Trump’s support is imploding, and only getting worse as this situation with Ukraine worsens and his political leverage diminishes. Remember, markets didn’t crash in the Seventies until Nixon’s tapes were released.
But there are other factors in play, including Joe Biden’s fall down the polls and Elizabeth Warren’s upswing in turn. There are already stories out of Wall Street about how horrified investors are of a Warren presidency. It’s only a matter of time before those types of sentiments leave an impression.
To me, the most likely scenario for the markets right now is for the markets to go down – way down – low enough that we see a final strong stimulus plan to re-boost the economy and get that final blow-off rally. The truth is democrats are going to take over at some point, and likely in the next election. The markets will not like that… be prepared.
We’ll have more to say on the subject in two weekends at the Irrational Economic Conference, Oct. 10-12 at the National Harbor in Washington. It’s really a wonderful conference, with some of the best thinkers and innovative minds I know also presenting. Get more information about the conference here, and we hope that we do see you.

September 26, 2019
The Wealth Effect
I predicted in 1988 forward that the massive Baby Boom generation would peak in its spending by late 2007. Simply that 46-year lag for peak spending of the average household. That happened on cue and we’ve been living off of accelerating QE and now tax cuts ever since to compensate.
So, with such a natural decline in spending, how has the economy even grown as slow as it has (2%)?
It’s About Their Peak Age
Two things. First the upper class of about 20% of college educated professionals do not peak until age 57.
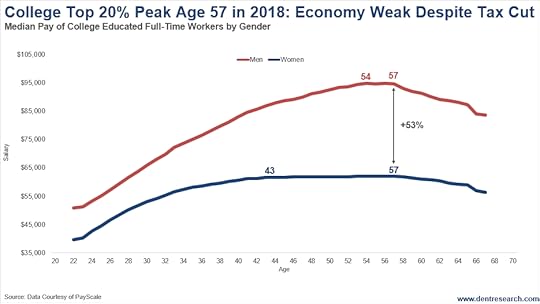
In 2007, the average household peaked and now that’s happening with the elite ones. Who do you stimulate to spend now? Then you could say, “Well, that’s only 20%.” The secret is that they control about 50% of the spending due to their higher incomes.
I covered on Monday how the median income of the top 19% upper class is a whopping $187,872, 2.4 times the 52% middle class and 7.3 times the 29% lower class.
They would have kept their half going through 2018 – and guess what? We are already slowing back to 2% and likely lower even after the big tax cuts in 2018 . These people are most likely the main culprit.
But second, and perhaps most important: This upper class that own 87% of the financial assets in the U.S. have been even more highly leveraged by the “wealth effect.”
When people’s wealth and financial assets rise, they feel more able to spend, especially on big ticket items like cars and houses. Oh, and artificially lower interest rates from QE also lower the cost of financing those. Example: Since QE, auto sales now peak at age 64 (when net worth peaks) instead of 50-54, historically.
Look at the bubble in financial assets outside of financial corporations, largely households and businesses.
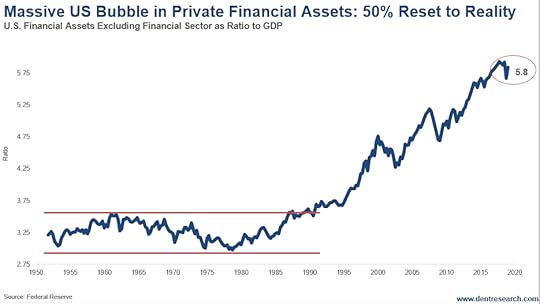
Financial Assets vs. GDP
From 1950 through 1990, the ratio of financial assets to GDP stayed in a narrow range between 2.95 and 3.65 times. The highest was around the top of stocks between 1965 and 1972 before the crash of 1973-74 that brought financial assets down to the bottom of that range.
But since the early 1990s, this ratio has ballooned. It peaked at 5.9 times in 2017 and is presently at 5.8. Now for the numbers: a whopping $123.2 trillion.
What’s obvious to me after the greatest bubble in modern history is that this ratio back down to the low end of that more normal historical range and then trade within that range largely or wholly again for decades to come.
This means that about 53% of financial assets, or $65 trillion, will disappear from our economy within about 3 years and mostly not return for a long time, if ever.
$89 trillion of those financial assets are households alone…
And then there is the $84 trillion in higher leveraged financial assets in the financial sector. This doesn’t crimp spending as much as it contributes more to the bubble collapse.
How much Fed printing would it take to offset this avalanche? $20 trillion, or ultimately $65 trillion? Think they can get away with that after printing an unprecedented $4 trillion that was not enough?

September 25, 2019
Major Bitcoin Break Down Suggests the Same for Stocks
In our 5 Day Forecast last Monday for Boom & Bust subscribers, I highlighted two scenarios – one for stocks and one for Bitcoin – that looked imminent to break up or down sharply.
Well on Tuesday, Bitcoin made its break down out of a large triangle pattern that was coming to a make or break point. This is worse as the more typical pattern would be to break out in the same direction it came into the triangle, i.e., up.
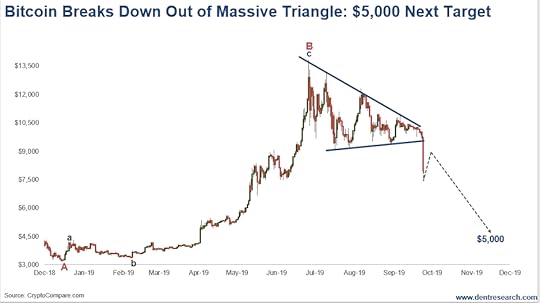
This was no shabby break. Bitcoin was down over $1,500, $1,000 of that in 30 minutes as it first broke key resistance at $9,400. The next move is often as large as the widest part of the triangle, which would be about $4,400, or about a $5,000 target from that break-out point at the bottom trend line.
Why is This Important?
I have been using Bitcoin as the final, steep bubble in this second broader tech bubble, as the young and super-overvalued internet stocks were in the last tech bubble.
This key break after an already too-long correction in my $32,000 final bubble projection strongly invalidates that option and makes this likely a B-wave or bear market rally top back at $13,827 in late June. The ultimate low before a 17-year or so bull market like the internet stocks would be at a minimum the $3,170 low last December. I would project more back to the bubble origin in late April 2017 around $1,250 – $1,300.
No run to $32,000 on Bitcoin, no final blast to 10,000 on the Nasdaq – by my best calculations!
The Megaphone Pattern Continues
So, that leaves my second scenario with a completed megaphone pattern for the Dow and S&P 500 – and a likely final top for them. In last week’s 5 Day Forecast I also showed the chart of the Dow’s mini megaphone pattern that was due to be tested soon – and the markets were not able to push even to slight new highs to complete that pattern.
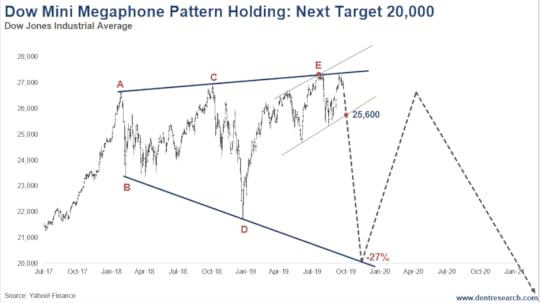
The megaphone pattern is simply one of higher highs followed by lower lows, until you get that third high which now looks like it was back in July at 27,399. This one completes a larger megaphone pattern with peaks in 2000, 2007 and now. The lowest next target would be at that bottom trend line of lower lows at around 20,000. That’s a 27% drop and larger than the September to December crash in late 2018.
But in this scenario, there was always a final run at a new high that fails. Trump has been begging for stronger rate cuts and a resumption of QE. Powell has resisted looking like a lapdog. But a stock crash of this magnitude and more signs of weakening, like continued falling Treasury bond yields and rising gold prices, would give the Fed ample excuse to turn back on the heat big time! What does a “market on crack” most want? More crack!
A Perfect Time to Sell Stocks
Here’s the subtlety that most analysts will not catch if this scenario plays out: The Nasdaq is also in a mini megaphone that is a little broader that just put in the third or C wave top. A crash to around 5,700 would set it up to make a slight new high around 8,500+ on this final all-out stimulus rally while the Dow and S&P fail to make new highs. That would be a classic divergence and sign of a major top.
A break of the light bottom line of the recent channel line-up at around 25,600 would further confirm this scenario and a deeper, but not final crash. The best target for the sharp wave down would be around early to mid-November. The final top of the Nasdaq could correspond with Andy Pancholi’s strongest turn point in late April/early May at The Market Timing Report.
This is a good time to lighten up or sell stocks. A break to new highs in the Nasdaq by early May next year would be the final signal. Put options to hedge would be another good strategy here. And again if we see that final rally at slight new highs for the Nasdaq next year.

September 24, 2019
Girls and Boys Can Be Different
I bet you thought I was going to stomp into the minefield of gender politics with that headline, but I’m not! While I have definite views on the differences between the sexes, having raised both a son and daughters, in this instance I’m referring to something completely different… storms.
Tropical Storm Imelda Wasn’t Like Hurricane Harvey
Tropical Storm Imelda just graced my neighborhood with quite a bit of rain. My little town, halfway between Houston and Galveston, situated on the west side of Galveston Bay, received 11.01 inches of rain. We had flash flood warnings blaring on our phones, which interrupted meals in restaurants and distracted shoppers in stores.
In other words, we didn’t really notice. There were times of heavy rain, but flooding? Not in my neck of the woods.
Hamshire, a small town about 65 miles inland, received just over 42 inches of rain, with 25 inches falling in just 12 hours. The water couldn’t drain quickly, so that area flooded.
Compare that with Hurricane Harvey in 2017. My little town got 42.3 inches of rain… and we were lucky. Totals for almost all towns within a 60-mile radius ranged from 28 inches to more than 52 inches. The storm dropped an estimated 15 trillion gallons of water, or enough to fill 27 million Olympic swimming pools.
We didn’t drive anywhere. Our home was an island on an island. Tens of thousands of people were displaced. It was a local disaster for homes, cars, and lives. But it was a national disaster for energy.
Energy is the Real Problem
I just wrote about oil last week after the drone attacks in Saudi Arabia. That incident drew international news, sent oil up 20% before it fell back a bit, and created anxiety through the energy markets. Tropical storm Imelda didn’t carry the same weight, but it should have made people a lot more nervous than it did.
Energy companies shut down a plant or two in the area during Imelda as a precaution. During Harvey, they all shut down because of leaks and the lack of workers. No one could get to the job site.
As America moves toward energy independence, storms along the Gulf Coast will take on greater significance for us and our trading partners. The less oil and gas we can move through this region, the less fuel we have for area refineries, and the less energy we have available for export.
There’s Good News…
The U.S. is now the largest oil and gas producer in the world. The International Energy Agency estimates the U.S. briefly surpassed Saudi Arabia as the largest oil exporter in the world in June, and should take that title for good within the next 24 months. Fracking drove a stunning reversal of fortune in the domestic energy sector over the last decade, and brought with it a change in how we view the world.
Texas and the Gulf Coast became much more important to our national economy, our trade deficit narrowed, we restarted raw oil exports, built the infrastructure for exporting natural gas, and became less interested in the fate of the Middle East.
Part of the change is down right enjoyable. I’m thrilled that our trade deficit is dropping as we buy less energy from overseas. And it’s not breaking my heart that we’re less dependent on, and less interested in, countries on the other side of the world that were happy to take our money for decades while hoping to wipe our way of life off the planet.
And There’s Bad News…
But there’s always a downside. The dramatic uptick in energy recovery and production means that storms targeting the Texas coast can be more crippling to our economy than before. We need better ways to move energy around the country, which at the moment means more pipelines. By increasing the number of places where we can deliver oil and gas, we can lessen the effects of a disaster in one area.
In Peak Income, Charles has invested in pipeline companies from time to time because they throw off great dividends. The industry has been under pressure along with energy prices, but it’s still worth a look. Pipelines combine two things most of us are looking for in a path to greater energy independence and income.
As for storms, they’ve rolled up on the Gulf Coast for as long as the coast has existed. We plan for them and take precautions, and there’s no difference between male and female names, as Katrina and Betsy proved. The scariest disaster is the one we don’t see coming, like a potential drone attack in the Houston area. Our resources aren’t nearly as concentrated as those in Saudi Arabia, but it would still send a chill through the markets, which is just one more reason to encourage geographic diversity.

September 23, 2019
Upper Class Median Income 2.4 Times the Middle Class
Pew Research is my favorite mainstream firm, and it has just come out with results about the status of the upper, middle, and lower class in America. As you would guess, the upper class has gained ground since 1971 while the middle and lower have lost… But not as much as the top 1% and 0.1%, who have nearly doubled their share of the income.
The upper class at 19% currently has 2.4 times the median income of the middle class in 2016 vs. 2.2 times in 1970. The percent of the upper income has steadily risen since 1971 from 14% to 20% in 2011, as the chart shows. That class dropped back to 19% in 2016.
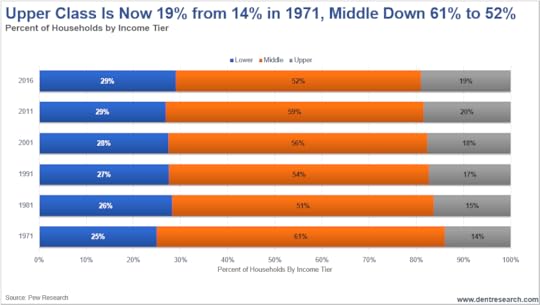
The middle class has fallen from 61% in 1971 to 52%, and the lower class has risen from 25% to 29%.
Median Income is More Telling
The upper class is at $187,872, a bit higher than I would have thought for median. Average incomes skewed by the exponentially richer 1% would be even higher. The middle class is $78,442. The middle class is pretty much unchanged since 2000, but has done a bit better since 2010, growing 6%. The upper income still grew higher at 9%.
The lower class has actually fallen a bit behind from $26,923 in 2000 to $25,624 in 2016. The upper class is now 7.3 times their income vs. 6.3 times in 1970, so more of a divergence than the middle class.
The highest upper-class concentrations are in the New York area and California, while the middle class is higher in the Midwest and larger parts of the Northeast.
Where Do You Stand?
Where do you stand? The minimum income to qualify for the upper class in a one-person household is $78,281; for two people, $110,706; three, $135,586; four, $150,561; and five persons, $175,041.
The minimum for the middle class by household size ranges from $26,093 to $58,347.
But of course, the greatest divergence comes between the top 1%, who have benefited the most from the financial asset bubble, and the middle class. From the Pikkety study in 2014 using average income, the top 1% was $1,391,000, 33 times the middle-class average. The top 0.1% is 30 million, a whopping 719 times.
Hence, the top 1% has run away with almost all of the gains, far more than the top 19% upper class!

September 20, 2019
Trump Wants Something Powell Can’t Give
The big news this week was that the Fed cut rates by around 25%. This was to be expected, though it’s still a relatively big deal, and is something to take notice of with regard to a liquidity crisis on the way. On Monday the overnight borrowing rate for banks shot up to 10% (it’s usually nothing), which means somebody needed some money and is quite a remarkable movement.
This doesn’t mean we’ll have a crisis tomorrow morning, but it’s an early warning sign that things are starting to happen. At this point it doesn’t take much to have a shock to the system, so tread carefully. This will not be easy.
But back to the Fed: Trump is overplaying his hand. He wants something that Jerome Powell simply can’t give. The more the president demands, the more obvious it will be that any acquiescence on Powell’s part is a full surrender to Trump’s needs. And right now Powell has too much pride to make that happen.
That’s why the timing couldn’t be better this year for the Irrational Economic Summit (October 10-12 at the National Harbor in Washington DC). Not only will I have plenty to say about the Fed and what interest rates are doing to the bigger long-term outlooks, but Dr. Lacy Hunt will also present, and he’s an absolute expert on these types of debt and financial bubbles. Tickets are still available and more information about the Summit can be found here. We do hope you’ll make it.
Enjoy the weekend.
It’s melting, melting! What a world!
Harry Dent is seeing early warning signs of a liquidity crisis…just like in 2008. Watch now to find out what the Fed is actually liable to do regarding rate cuts at Trump’s insistence. Harry also reminds us why this year’s conference could be the most important Irrational Economic Summit yet! Register today for IES 2019: https://pro.dentresearch.com/m/1322195
Posted by Economy and Markets on Friday, September 20, 2019


