
Harry S. Dent Jr.'s Blog, page 171
December 24, 2014
Stock Options, Risky or Not?
If you ask many stock-market investors what they know about stock options, you’ll get the same answer:
“They’re risky.”
But that, my friend, is pure, unadulterated misinformation. It’s hogwash.
Like most wives’ tales, there’s a shred of truth, mixed in with gross generalizations, behind the “risky” label that stock options have erroneously been given.
For example, you must have heard the comment: “Most (upward of 90%) option contracts expire worthless.”
Well, that’s one completely false generalization that’s used to persuade investors to NOT buy stock options.
In reality, the Chicago Board Options Exchange has shown that only about 30% of option contracts expire worthless. The 90% figure is misinformation that originally came from an SEC study that was fundamentally flawed.
Still, some investors choose to believe that 90% of options expire worthless (even though it’s a lie). These investors then think that selling option contracts is a better strategy… so that’s what they do, aiming to reap gains when the value of the contract goes to zero.
Yet, this can be a very risky strategy… one with unlimited risk. And it’s these “naked selling” option strategies that lead investors to believe another gross generalization…
That is: “My risk is UNLIMITED when trading options.”
If you choose to employ a strategy that only purchases option contracts, that statement is completely false. In fact, buying an option contract is the ONLY way to guarantee you won’t take a loss more than you’re willing to accept at the onset of the investment.
You get a 100% guarantee that you cannot lose more money than you have invested in the contract. And since you can buy most option contracts for just a few hundred dollars (instead of a few thousand dollars, as with stock shares), you can play the market with only a small amount of capital and risk.
That’s exactly what we do with Cycle 9 Alert. We buy option contracts (mostly call options, which are bullish) that expire about three or four months down the road. Then we watch the value of our option contracts rise and fall as the underlying stock price rises and falls.
Of course, not all trades go in our favor. Sometimes we have to take a loss, which can mean a 100% loss of the debit we paid for the call options we purchase. But we’ll lose no more than that.
And the upside potential of our option plays is often much greater than 100%. For instance, we’ve earned a 196% profit on call options on a large-cap energy producer.
As you can see, our risk is completely limited, while our profit potential is unlimited!
That’s a pretty good deal, if you ask me… and far better than the lazy man’s view of options.
Many of the current subscribers to Cycle 9 Alert have admitted that they had no experience with options prior to joining my service, yet feel perfectly comfortable trading options with my guidance. (Options “pros” also tell me they find the service very valuable.)
Click here to learn more. And next time you hear someone say that options are risky, please slap them… then forward them this email.

Adam


December 22, 2014
Market Crash and High Yield Debt
Since late 2008, the unprecedented quantitative easing (QE) that flooded our economy has produced another terrible consequence — the unbelievable mispricing of high-risk, high-yield bonds.
At the top of the previous boom in early 2008 high yield bonds grew to $710 billion and were yielding 10% after dropping to as low as 7.5% in early 2007.
That’s a more appropriate yield for investors taking such risks in what back then still looked like a good economy.
Those yields skyrocketed to 23.5% in late 2008 as the global financial crisis emerged seemingly out of nowhere with the eruption of the subprime mortgage crisis. As soon as the riskier sectors begin to go bad, the bond markets start to worry about the rest of the sectors.
Investors lost nearly 50% on a basket of high-yield bonds in 2008 and their loss was almost as much as the stock crash.
Next time it’s going to be worse….
With massive QE from 2009 through 2014, junk bond yields mushroomed to $1.6 trillion and went to unprecedented low levels of 5% yields between early 2013 and early 2014. That was just 3% points higher than risk-free 10-year Treasury bonds.
This means that companies are going to borrow money to buy back their own stocks and now risky ventures seem much more feasible, things like fracking.
Earlier this month, I covered the fracking bubble and its similarity to the subprime bubble. The subprime bubble was larger in magnitude but rapidly plunging oil prices could be a more explosive trigger that sets off the next debt crisis.
Before we get to that, the chart below shows the peak in junk bond prices (and the bottom in yields) in early May of 2010, exactly when we gave a clear long-term sell signal in the May 10 newsletter. The HYG ETF peaked there at just above $96.
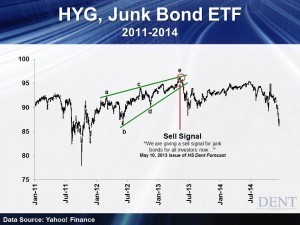
I had been monitoring a rising bearish wedge starting back in 2011 and we couldn’t have called that top better.
After falling to $88, that index rebounded to $95 and has now fallen to $86 on December 16, or 10% from the all-time high. Energy junk bonds have fallen 20%, and there’s much more to come.
If yields skyrocketed from 10% to 23.5% in 2008, they’re likely to blast from 5% to 25%… even up to 30% come 2015 or possibly 2016 in a deeper downturn and bigger overall bubble burst.
That means high-yield bond holders are likely to see 60% plus losses next time around.
By various estimates, the energy sector, largely frackers, accounts for 15.4% to as high as 20% of the total junk bond market. In 2014, 61% of the junk bonds were in the energy sector. That’s the sound of a bubble peaking!
Yes, the subprime mortgage market was larger, but frackers have also borrowed through leveraged loans to the tune of $300 billion and they are even worse. There is a total of $500 billion+ in risky energy debt in this sector, that is still enough to trigger a debt crisis.
What is the real trigger? Obviously rapidly falling oil prices.
Recall that the greatest bubble burst I have seen in modern history was the oil crash from $147 to $32 in just over four months in mid- to late 2008. Oil is highly volatile and traded with high leverage.
Oil traded in a range of $75 to $115 for years and then broke out of that sharply, just like gold did in early 2013 (we had a strong sell signal in gold and silver in late April of 2011 right at the top for silver at $49).
The first sharp drop was from $106 to $54 — $52 or near 50% in just 6 months with most of that in a matter of weeks!
Frackers have created an additional three million plus barrels per day in the recent fracking bubble and it’s been fueled by such cheap debt as it’s capital intensive to find new oil sources. Cheap money would make it far more attractive and create a bubble…
Surprise, surprise!
But here’s the dynamics. Most frackers break even between $55 and $85.
So there will be little or no new drilling or junk bond issuance after this recent drop. But the variable costs of “lifting” the oil out are only $10 to $20.
This means that present rigs will keep producing and the production bubble that took off in 2011 will continue into at least late 2015 before such wells start to max out as they only last two years on average.
This means supply will continue to expand for about a year while global growth continues to decelerate, and it’ll probably expand by even more than we forecasted through our demographic projection. This means oil will fall further in 2015, with another crash likely to bottom by September.
After breaking the key $75 to $80 levels in early November, the only support is at the late 2008 lows of $32. I expect oil to rally a bit into early 2015 back towards $72 to $80 and then to crash again.
This next crash is likely to start by late March, if not earlier.
Many fracking companies will find it very challenging to meet their debt service and will be defaulting — but they will continue their production in order to maintain short-term cash flow.
Once yields spike for high-yield energy bonds, they’ll also start spiking for other sectors.
The student loan bubble will start to crack, as will the subprime auto lending bubble. Then there is $5.7 trillion in U.S. dollar debt to corporations in emerging countries.
That will blow as commodity and oil prices continue to fall and the dollar rises, making those loans more expensive to pay off. The growing slowdown in fracking will also hurt jobs down the road because, as we all know, this booming sector had huge growth in job creation.
The demographic trends show surprisingly slow growth next year in Europe and China and it’ll definitely add insult to injury for those countries.
The Fed can’t do a thing about the falling oil prices. They were the key factor in creating the oil and fracking bubble with their “free” money policies. If oil keeps falling, more frackers (and some foreign countries from Venezuela to Russia to Iran) will go bust.
Just when clueless economists and central bankers think they’ve hit escape velocity, the fall in oil prices may just be the trigger that sets off the next debt crisis and will only continue to spread as global growth evaporates.
The markets see no risk and continue to rally like they are on “crack” — which they are.
I see this stock rally, at the very latest, lasting into mid-March of next year and I see the Dow hitting as high as 19,000.
The key sign of the final peak would be a rebound in oil and a final “risk-on” rally in commodities, gold and stocks.
If oil gets back into the $70s that would be the time to start selling stocks and all risk-on financial assets.

Harry
Ahead of the Curve with Adam O’Dell The Art of SurvivalDecember 19, 2014
Biotechnology’s Cancer Crusher
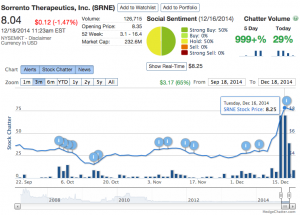
Last week, I wrote about the billionaire Patrick Soon-Shiong becoming the Elon Musk of biotech. And true to form, we saw his impact on the market after Monday’s announcement that a subsidiary of his NantWorks company was partnering with Sorrento Therapeutics (Nasdaq: SRNE) to develop cancer and autoimmune drugs.
As soon as the news of this partnership hit the streets, Sorrento’s stock price soared more than 80%, closing at $8.48 on Thursday.
Patrick Soon-Shiong, currently worth $13.1 billion, has been methodically adding companies aiming for eradicating cancer through high-tech methodology. Once united, this family network of companies will bring together a variety of specialties: advanced semi-conductor technology, supercomputing, advanced networks and augmented intelligence to diagnose and treat cancer patients with efficiency and speed.
Soon-Shiong’s company will buy a 19.9% equity stake of Sorrento at $5.80 (closing price Friday before deal was announced), adding up to a total investment of 7,188,061 shares for $41,690,754. Patrick’s company also has a three-year warrant to purchase an additional 1,724,138 shares at $5.80 apiece.
The joint venture comprises a $20 million investment and the development of a product called immunotherapy antibody IV.
Shortly after locking up the deal, Soon-Shiong issued a statement: “Combining NantWorks’ cutting edge expertise in genomic and molecular profiling of cancer patients and Sorrento’s industry-leading G-MAB antibody technology, we believe will enable us to develop multiple novel therapies for malignant disorders where there is currently a significant unmet need.”
The announcement caused the social media chatter surrounding Sorrento to increase more than 1,000% giving this stock a lot of rapid momentum. There were also some early warning indicators, such as upticks in the volume of social media chatter messages, before the deal was even completed.
This can be seen in the chart below overlaying social media chatter volume (blue bars) over Sorrento’s stock price.
I’m currently tracking trends surrounding Patrick Soon-Shiong’s efforts and utilizing my Social Media Collective Intelligence system and providing alerts in my Biotech Intel Trader service.
As always, I will continue to monitor the market’s social media collective intelligence and keep you updated on the latest trends.

Ben
The Housing Market and Debt
The Federal Reserve recently reported that household debt as a percentage of income has fallen to its lowest level in a decade. After peaking near 135%, the measure has dropped to 108%, a level last recorded in 2003 and far below the levels in Canada and Great Britain.
Some analysts see this as a sign of great things to come. Now that consumers have shed a chunk of debt, they can boost the economy… by taking on more debt.
Hmm…
As a general statement that might be true, but it ignores the details of who carries less debt today than they did in 2007, and why.
It’s not as if every consumer in the U.S. paid off a little debt or gained a little income. The changes were concentrated in two age groups — 45- to 54-year-olds, and the 35 and under set.
But before you get your hopes up, all of the change was on the debt side, neither group experienced a bump in income…
Who’s Buying?Six years ago, the 45- to 54-year-olds were 39 to 48, the prime age for spending in general and for buying a big house. The fact that this group has experienced a significant decline in outstanding debt since 2007 would make sense, because these consumers were most likely to have recently purchased a trade-up home right before the Great Recession.
The aftermath of the crisis was filled with foreclosures and short sales, which hit this age group hard. While it’s not a fun way to do it, foreclosures and short sales serve to reduce debt.
I’ve not seen a study on the matter, but the few people I know who have been through these ugly processes aren’t very interested in taking on a lot more debt anytime soon. They’re very happy to sock away money and remain solvent.
As for the 35 and younger group, their overall debt level dropped the most of any age category, which tracked their falling rate of home ownership. In 2007, 37% of families where the head of household was 35 or younger had a mortgage.
By 2013, this number had fallen to 28%. While it’s true that some of these borrowers went through foreclosure or a short-sale, it’s also true that young adults today are much less likely to buy homes than they were in 2007.
So while part of the debt reduction for this young group comes from shedding mortgage debt, some of it also comes from new entrants into the age group foregoing mortgages in the first place.
At this point in their young lives, how likely are they to run out to buy a home? Again looking at those 35 and younger, in 2007 only 17% of them had student loan debt. By 2013, the figure had jumped to 41%.
At the same time, their median income had fallen from $42,000 per year to $35,200 per year. With four out of 10 people in this age category carrying student loan debt while their median income has fallen 16%, it’s hard to see how this group will be motivated to spend with abandon.
Recent news from the housing industry verifies this point.
A record low was registered in October of this year when 33% of home sales were first-time home buyers. The typical number is 40%.
It’s not that young adults don’t want homes. A report by Zillow found that among respondents age 23 to 34, 83% of renters expect to buy a home one day… just not today.
According to Lawrence Yun, Chief Economist for the National Association of Realtors: “Rising rents and repaying student loan debt make saving for a down payment more difficult, especially for young adults who’ve experienced limited job prospects and flat wage growth since entering the workforce.”
That sums it up nicely.
Before people rush out to spend on credit, they want to have some assurance that they’ll be able to pay it back. With boomers saving as best they can for retirement and millennials trying to pay off student loans with flat wages, we don’t see consumer credit shooting to the moon anytime soon.
This is just one more of those things that has the “potential” to drive our economy higher next year, but it never quite takes off.

Rodney
Ahead of the Curve with Ben BenoyBiotechnology’s Cancer CrusherDecember 18, 2014
Fearless Market Research
Mark Cuban shocked the audience at TechCrunch Disrupt in September when he stated that too many investors in Silicon Valley suffer from FOMO or Fear of Missing Out when it comes to their approaches to investing in tech companies.
Cuban said: “Everyone throws money at everything because they want to find their unicorn, however a 90% fail rate doesn’t work for me.”
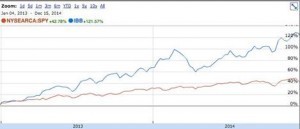
Avoiding the Bear TrapsWith the biotech sector as a whole out gaining the S&P 500 three times over since 2012, many investors are beginning to fall into this same mentality when looking for opportunities in this red-hot sector. Everyone wants a piece of the winning team; however, few understand the large bear traps that loom in this volatile sector.
The risk versus reward ratio in the biotech sector is enormous. That said, what is the best way to avoid the many bear traps in order to downsize your risk?
Today on Wall Street, everyone looks at the diversification of each company’s drug pipelines and then verifies their financials. If a company has a long line of drugs in production and also in various stages of development, many will take this as a good sign, counting on reduced risk if any of them go under.
In many cases, this is true, however the solid companies don’t leave enough gain on the table to pay off for the amount of risk the average retail investor is leveraging.
Another technique used by many biotech traders is mapping out all the expected drug trial release dates of the companies they’re tracking and take advantage of price movement in anticipation of these events. This is the equivalent of making a bet on a company a month before earnings are released because you have a hunch on the direction it will take.
This technique works… sometimes. But it’s still highly speculative for the most part.
Then again, what if you were able to apply some serious rigor to the “hunches” based approach by tapping into the overall sentiment of the community following each company?
Often times, there are thousands of people performing research and writing about companies via blogs, tweets, and other forms of social media that go largely unread if you aren’t directly subscribed to them.
Social AdvantagesHere’s another advantage we’ve found and it’s become a cornerstone — it’s a swing trading strategy. It leverages this data over the course of a few months, not hours and days. Ground swells in human-based momentum truly beat out the day-trading machines when driving the price of a stock.
By capturing these momentum swings through social media, we’re able to forecast movements that typically occur in 60 to 90 days. One added benefit from capturing these longer swing trades is that you don’t have to get caught up in the daily volatility of the market, allowing for more peaceful and methodical decisions that give you peace of mind.
Today, most of us are familiar with the word trending and its relationship to social media. One in particular has created a “financial” adaptation for messages — Twitter.
It’s called a cashtag.
Introduced back in 2012, it’s gained in popularity so instead of using the pound symbol (#), when tweeting about a stock’s activity, a dollar sign is used along with the company’s stock ticker symbol (e.g. $AAL is American Airlines’ cashtag).
It’s these small indicators that are easily picked up and processed by my social media collective intelligence (SMCI) system. And over the past year, (SMCI) has come through solidly on several occasions.
Mark Cuban was right when he stated that many of us suffer from a fear of missing out, but now we have the tools to better assess if our fears are true by leveraging social media for our benefit.
If you’re interested in learning more about how to harness this powerful technique, check out my Biotech Intel Trader service here .
Stay tuned as I continue to monitor social media opportunities across the markets!
Ben
December 17, 2014
Economic Cycle Spins For the Rich
One of the clear historic signs of debt and of financial bubbles is that the rich get richer… at least until the bubbles finally burst.
Janet Yellen recently commented on concerns about rising income inequality and said that it was impeding America’s economic mobility. Ironically, it’s the very Fed and central bank policies around the world that drive and exaggerate that inequality.
The top 10% control over 90% of the wealth and financial assets in the U.S. today. The top 1% controls 42% and the top 0.1% an astounding 22%.
So who gains the most when you have a weak recovery generated largely by monetary injections and zero interest rate?
It’s the rich, and even more so — the ultra-rich…
Just like during Roaring 20s and Roaring 2000s, it’s a natural occurrence that the rich get richer in fall bubble seasons…
Rich Get Richer, Almost AlwaysFinancial assets bubble and they also represent much of the new entrepreneurial class that booms unbelievably when major new technologies and companies move into the mainstream landscape on the S-Curve.
But in this bubble boom, the Federal Reserve and central banks around the world have increasingly amplified the natural bubble and haven’t stopped feeding it since the financial meltdown of 2008.
A case in point is looking back at the top of the last major debt and financial asset bubble in 1929. The top 1% controlled 52% of the wealth in the U.S. Once that bubble burst that number fell by 35% in 1942 (winter season) and ultimately to 23% in 1978 (near end of summer season).
That’s a 56% drop in relative wealth.
The free market capitalist system has its own natural dynamics and one byproduct is that it promotes the rich getting richer when major new technologies are moving into the mainstream for the first time in the fall bubble boom season. It’s at that time when the economy needs investors and entrepreneurs to take major risks and then, rewards them handsomely for that.
In the following seasons (winter, spring and summer), the rich lose their wealth little by little. The everyday worker and middle class end up reaping some of the benefits of super innovative periods like from 1914 to 1929 or 1994 to 2007.
By looking at the chart below you can see that there’s a big difference in this bubble economy, especially since 2008 when the Fed and central banks stepped in with their unprecedented stimulus.
You can see how the top 0.1% has taken most of the gains in this boom and even more since 2002. The 0.1% has taken such a great share that the top 1% pales in comparison.
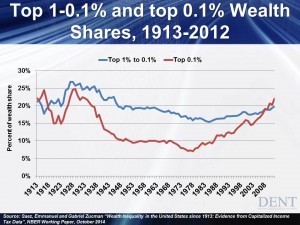
Take note that in the 1923 to 1929 bubble, the 0.1% to 1% garnered a little more wealth than the elite 0.1% — 27% vs. 25%. Obviously, the 0.1% was still about eight times as rich as the 0.1% to 1%… which is still a huge divide.
But the fortunes held by both groups rose together, it was just a little faster for the top 0.1%.
Let me also point out that during the bubble from 1994 to 2012 (it would be even more extreme if this study measured it through 2014) that the top 0.1% took the lion’s shares of the increase in percentage wealth rising from 7% to 22% while the 0.1% to 1% rose from 16% to 20%.
A Revolution Is ComingIn the previous scenario, the 0.1% became 10 times richer than the 0.1% to 1.0%
The whole point here is that the top 0.1% are doing exponentially better than the top 1% who are doing even better than the top 10% — and the top 10% are collectively the prime beneficiaries of the quantitative easing (QE) policies that have launched another huge bubble in an otherwise weak economy — as they own 9% of the wealth.
This is why Homer Simpson is taking it on the chin and seeing little or no recovery and those high on the wealth totem pole are doing better than ever.
History shows us why such vast extremes in wealth and income inequality are simply not sustainable. As I’ve written before, a revolution will come when the poor band together and rise up against the wealthy.
“Income inequality and special interests have created such an extreme situation today that everyday people will begin to revolt in developed countries. It won’t only be those in the dictator-driven economies of the emerging world trying to make themselves heard and forcing democracy for the first time.”
A reminder — during the French Revolution of 1789, royalty was sent out to the guillotines.
Don’t go off the deep end with worry because I see this extreme inequality changing in the decades ahead. Keep in mind that in the bubble of 1929, the top 1% dropped from a peak of holding 52% of the wealth to a bleak bottom when they held only 23% in 1978. That’s a massive 56% decline!
But it was the top 0.1% who took the greatest blow to their wealth. Just imagine a drop of 72%… the peak in 1929 was at 25% but by 1978, it had fallen to a paltry 7%.
The top 0.1% to 1% experienced an overall drop of 41% from their peak at 27% in 1929 to 16%.
What about that broad 90% of people at the bottom? They rose from 15% to 33% in that time period and it climbed to 36% in 1985 before falling again.
Here’s my message to you — the wealthier you are, the more you have to lose when this massive Fed-generated bubble bursts.
Don’t be complacent and get as liquid as you can, sooner rather than later… and please — don’t even entertain thoughts like “the most prime real estate in places like New York, Miami, San Francisco, Vancouver, Sydney or even London… can’t go down.”
History is very clear on that point and it has shown us that such places fall the hardest and take a long time to come back.
I’m writing a more in-depth report on this subject in the January issue of The Leading Edge.
Harry
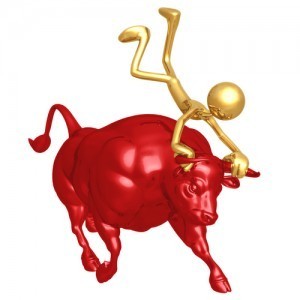
Ahead of the Curve with Adam O’Dell Investing Is Not for the PassiveStock Market, Grab the Bull by the Horns
 Our experiences shape us. We can agree on that, right?
And as much as we’d like to think we learn from the mistakes of others, the truth is… most of us don’t. We learn “the hard way,” through our own personal trials and tribulations.
Financially, the lessons we learn from the school of hard knocks can be costly!
I’m not only talking about dollars and cents. I mean costly in the sense that financial lessons learned the hard way often rob us of years, even decades, of our precious time. They set us back… hold us back… prevent us from reaching our full potential… from living life to the fullest.
Most costly of all, financial lessons and mistakes will rob millions of Americans of the opportunity to retire and live comfortably through their golden years.
The stats are mind-blowing…
“Thirty-six percent of American workers age 55 to 64 say they have less than $25,000 in retirement savings.” — Employee Benefit Research Institute
“Fifty-one percent of households are at risk of not having enough savings to maintain their standard of living after retirement.” — The Center for Retirement Research at Boston College
“Sixty-six percent of Americans said their top financial concern was not having enough money for retirement.” — Gallup Poll
But beyond the research and statistics, I’ve seen this retirement dilemma first hand. And it’s that experience that shaped the way I approach investing in the markets.
React Today, Not TomorrowThe year was 2008.
I was working as an adviser for a Fortune 500 financial planning firm. Each week, I met with dozens of families. Their stories were all different, yet all the same.
Simply put: The goal, for each, was to get to 65 with a nut big enough to last. Although no one seemed to know what that meant — how big? How long? And HOW?
My analysis usually showed a shortfall in savings. Roughly 80% of our clients were behind the curve.
As a licensed financial adviser, I was expected to toe the company line and only recommend strategies and investments that were “pre-approved,” more or less.
I found it odd that our recommendations in 2008 weren’t all that different from all the years prior. The state of the market seemed to make no difference.
And the entire time, I had a sense that there must be a better way, so I read everything I could find about non-traditional investment strategies. And thousands of pages later, I came away with two realizations.
1) “Passive” investing is risky. It requires the investor to give away too much control to the whims of the market.
2) You have to play both sides of the market. The best way to limit your profits and increase your risk is to look only to the long side (i.e. buying).
My only goal today is this: To spur you to make a proactive decision about your financial future. Make it today, not tomorrow or someday. Make it right this minute.
Whether you hire a professional, go it alone, only YOU can decide what you’re willing to do to reach your financial goals.
I personally think you’d be better off taking the bull by the horns. Switch gears and leave passive, long-only investing behind and learn more about my approach to active investing here.
Adam
December 16, 2014
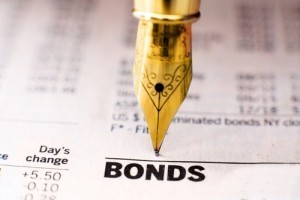
Bond Market Shouts To Be Heard
 I think the idea that cars, sports equipment, etc., can “talk” is a guy thing. I can’t recall seeing a woman talk to a golf ball before she teed off, and yet I know plenty of guys who do this, even before they start drinking!
Guys will ever so calmly (said sarcastically) discuss life with their car if it refuses to start. Even in that statement I used “refused,” as if the car was making a choice not to start.
When it comes to the markets, we talk about them making fools of everyone, or not giving anyone a clear indication of what is coming next.
That’s all nonsense of course, except when it comes to the bond markets. In this instance, I’m sure there’s something to the notion of a talking market, and recently the bond market has not been whispering quietly, it’s been screaming.
Over a month has passed since the Federal Reserve technically exited the bond markets. I say “technically” because the central bank has pledged to keep its balance sheet at its current size, which means as bonds mature, they will buy more to replace them.
That being said, the latest quantitative easing program was shut down in late October. Since then, interest rates haven’t shot to the moon, even though the U.S. bond markets lost a huge player that routinely purchased billions of dollars’ worth of inventory every month. In fact, interest rates have fallen while prices have moved higher.
Some people might count this as a victory, noting that the bond markets can survive and even thrive without the Fed. I think those people aren’t listening to what the market has to say.
The interest rate paid on bonds compensates investors for several things — the use of their money, the loss of value because of inflation, and the risk investors take by lending money in the first place.
U.S. Treasury bonds and others backed by the U.S. government, which are the kind that the Fed was buying, are considered risk-free, so they only compensate investors for the use of their money, called the real rate of return and the expected loss due to inflation or the inflation rate.
No one knows what the real rate of return is. It’s not published in a book or calculated using specific inputs. In general, it’s computed by simply subtracting the long-term expected inflation rate from the current interest rate paid on a bond. What’s left is the real rate of return.
Over many years the real rate of return was near 3%, but not any longer.
This is where the bond market is trying to tell us something.
Currently, the one-year U.S. Treasury bond yields 0.18%. Inflation is roughly 1.7%. Subtracting the inflation rate from the yield (0.18% to 1.7%) gives me a real return of -1.52%. So investors are buying a security that they know will net them a loss of 1.52%.
Hmm.
Longer bonds don’t fare much better. The yield on a five-year U.S. Treasury bond is about equal to the current rate of inflation (1.67%), so buyers of these bonds will break even 60 months from now.
The 10-year U.S. Treasury bond has a yield of 2.10% and after subtracting the inflation rate of 1.7%, it results in a 0.40% real rate of return. The only good thing that can be said about this rate is that it’s not negative!
Even the 30-year U.S. Treasury bond pays a paltry rate of interest of 2.71%, which equates to a real return of 1.01%.
I don’t think bond buyers are blind to these numbers.
I think they’ve assessed the investment and economic landscape, and see little opportunities for growth in the years to come as well as modest inflation at best. In essence, bond buyers are willing to invest for almost no return, as long as they have a strong belief that they will at least get their money back.
How else do you explain investors signing up for a loss on bonds shorter than five years, and accepting a measly 0.40% rate of return on 10-year U.S. Treasury bonds?
The bonds markets are screaming at us. All indications point to a period of low growth and modest, if any, inflation.
The most important factor today when buying bonds isn’t the return on your money; it’s simply the return of your money.

Rodney
Oil Drops, Volatility Spikes
 Markets came alive last week and most of the activity can be attributed to oil prices, which continued to spiral sharply downward.
Seemingly out of nowhere, the energy sector has emerged as the must-watch spot of the global financial system. Oil prices have been sleepy for years, creating the impression of stability.
But as Harry and I have said before: “Stability breeds instability.”
And now that prices have cracked lower, unleashing a torrent of volatility in related markets (nearly everything is affected by oil prices to some degree), investors are beginning to worry about the unknown implications of a possible “new normal” in the global energy complex.
And while the price of oil will have measureable (and forecastable) effects — both good and bad — on various asset classes around the world, these calculations are largely meaningless today.
Instead of making careful calculations, investors are simply leaning toward a defensive stance, in a logical acknowledgement of the future’s unknowns.
Basically, oil is now a huge question mark in the equation that describes the global economy. And until we have a clearer picture of that variable, expect investors to err on the side of caution.
Now, let’s take a closer look at these trends as we go around the market in 10 seconds…
• Global stock markets fell across the board. Interestingly, though, small-cap stocks (IWM) fell only mildly. The Russell 2000 lost 2.5%, while the Dow dropped 3.6%. Typically, in a clearly risk-off environment, as last week was, you’d expect to see the opposite. While it’s too soon to tell, this may be an early signal that small-cap stocks are on the verge of recovering from their year-long slump. I’m keeping a close eye on this development and will let you know if/when small-cap stocks make a bullish break higher.
• Bond markets mostly rose, but performance was split along the “quality” divider. Meaning, high-quality issues — like Treasury bonds (IEF) — traded higher, while riskier quality bonds — like emerging-market (EMB) and junk (JNK) bonds — dropped sharply. The spread between IEF and JNK grew a strong 5.65% last week, revealing investors preference for safety.
• Commodity markets were led lower by a 12% drop in oil (USO), although gold and silver prices traded higher. In general, the commodities complex is still looking bearish under the weight of global deflationary trends. We don’t expect this to change anytime soon.

Adam
U.S. Economy Powered By Everyday People
 Who knows most about the economy? Everyday people. That’s who knows the most about an economy.
I always say that economists don’t understand the most important thing about our economy. It’s not money, stocks, companies or banks.
The most important part is simple: people.
It’s you and me.
There are many crystal clear cycles most economists don’t understand — commodities, geopolitical, innovation and decennial boom/bust. Here at Dent Research, we do understand them but we’re most known for our focus on demographics — the predictable things people do as they age.
Spending is a big part of our research. And it’s not just a broad wall-to-wall mural that we look at… we prefer to look at Polaroid snapshots of every phase of life. We break it down by age group and we see it all from cradle to grave.
It’s all in the details…
As we age, everything about us changes, even things like calorie intake which peaks at age 14 on average, height at 19 and weight at 60.
I’ve found that the propensity to innovate and the power held in society relate to age. The younger generation tends to be more innovative peaking at age 22, as they’re more familiar with current technological advances — but the older generation holds the power especially at age 64 when their net worth peaks.
Young people tend to be inflationary since they “cost everything and produce nothing.” It costs $250,000 to get the average kid through high school. Then for many there’s college. Then there’s the cost for businesses to train and equip new workers at age 20 on average before they become productive. Economists that think the massive inflation of the 1970s was caused by government and oil prices missed the impact of the massive baby boom entering the workforce.
Older individuals are deflationary as they downsize virtually everything. They reduce food intake, spending and even driving. With no effort at all, their physical appearance changes and they lose weight and lose inches in height… it’s inevitable.
They often move to smaller homes when the kids leave the nest or when one of them dies.
When they hit their mid-to-late 40s, they start serious saving and begin dipping into their vault and start spending down those savings from 64 forward. Statistics say they stop earning and retire on average at 63.
So where are we today?
There is one simple graph that summarizes the impact of consumers on our economy.
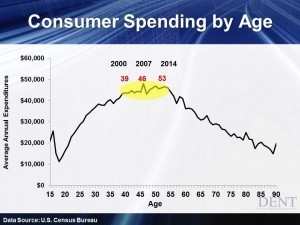
I explored this spending premise in my first book, Our Power to Predict where I featured a graph that we’ve used for looking at 5-year cohorts dating back to 1989. It showed a peak in spending in the 45- to 49-year-old followed by a steep decline.
How do we look back at the previous patterns and apply them to today?
In order to focus on individual spending segments more effectively, we took 10 years of the Consumer Expenditure Survey from the U.S. Bureau of Labor to get enough data to get accurate charts on hundreds of sectors of consumer spending from diapers to nursing homes.
There was another benefit to this in-depth research into the consumer: we could more accurately plot the total spending cycle by year, not just by 5-year cohorts. When we were able to down the exact peak, it was age 46… that had already been our assumption for decades as that was where the correlation with the economy was the best.
It’s important to note that in this version of the consumer cycle of spending, we saw a plateau that landed between the ages of 39 to 53. Spending rises rapidly into age 39 as home buying is surging. Economic growth first slowed down when the baby boomers first hit that plateau in 2000. Stock prices adjusted for inflation have made little progress ever since.
The key turning points in our economy occurred in 2000 when spending first slowed down and then peaked at age 46 in 2007… bringing our next key turning point to late 2014, the last year of this long plateau at age 53.
There are two factors driving this plateau from 39 to 53. First is that affluent people peak in their spending later than the average or below average. While the average person peaks at 46, the most affluent go to school longer, as do their kids.
This is one of the biggest reasons why the Fed’s money printing in late 2008 worked to a moderate degree up until now. Economists who expect this improving trend to continue will be disappointed.
The peak baby boomers born in 1961 are age 53 this year and right at the end of this plateau before spending tapers off rapidly and it’s one of the reasons why the economy looks so good right now.
According to our demographic research and to quote Jack Nicholson: “Maybe this is as good as it gets.”
Let’s delve a bit further into the numbers.
Cars over $50,000 are up 31% vs. 4% for cars under $50,000 because the more affluent dominate car buying in their early 50s. That brings us to the second factor driving this plateau: major consumer durable goods.
On the other hand, home buying has a dual peak at age 37 and 41. On average, home buying slows down in between those two peaks at around age 39. That’s a big deal and it hits its apex before their income hits its high by several years.
At 46, spending on furniture peaks (the next big durable goods area). Those numbers are comparable to 2007. The last to peak is automobiles at age 53 right now in 2014.
These are big-ticket items and the very ones that are most financed with debt. They’re the most leveraged in the consumer spending cycle.
The Fed has no clue that auto sales are very likely to peak right here, neither do the car dealers. They have no idea that the more affluent consumers that have continued to spend and benefit from quantitative easing (keep in mind that these households own over 90% of stocks and financial assets) are getting ready to peak and spend less as we move into 2015, especially in 2016.
Most economists are predicting growth of 3% to 4% next year, extrapolating trends as always.
Yeah, good luck on that.
So, let’s see how quantitative easing, which has been halted in the U.S. since October, works when the baby boom generation goes off the final demographic cliff at age 53 and auto sales start diving like home sales did back in 2006.
No one is going to see this curve ball coming.
But you saw it coming off the mitt… and you’ve already covered your bases.

Harry
P.S.
For those in the marketing, business consulting and investing sector, if you find you’re interested in this data; we have a very affordable research report called Spending Waves . This research covers over 200 different types of businesses and it took many hours and a lot of effort to produce but if you click here … you can get it for $149.


