
Harry S. Dent Jr.'s Blog, page 167
January 28, 2015
Greece’s Economic Trouble
There’s a lot of teeth-gnashing going on in Europe about the Greek election. The Hellenic State put the far-left leaning Syriza party in power, which immediately negotiated a ruling coalition with a far-right nationalist party, which would be like the Tea Party joining up with Elizabeth Warren.
What makes the strange pairing work in Greece is that the two have a common enemy — the euro… or more precisely, all the European meddling in the affairs of Greece. Both parties have called for leaving the common currency and repudiating all debts owed to foreigners, which is striking fear into the hearts of European central bankers.
I’ve got a question. What did they expect?
Greece has been an opaque basket case of half-truths and misdirection since WWII…
The CIA helped install a hardline government immediately after the war to stop Greece from aligning with Russia. This lasted about 20 years until a military junta took power in the late 1960s.
While Greece enjoyed economic growth and increased trade under military rule, the people weren’t so crazy about the concentration of power. In 1974, the junta was kicked to the curb and Greece went on a spending spree of social programs.
During the 1980s and early 1990s, the country used devaluation of the drachma as the main tool for dealing with increasing debt. There were only four short years, 1996 to 1999, when the Greeks had a relatively sound fiscal and monetary policy.
They qualified for inclusion in the euro zone in 1999, and officially started using the currency in January of 2001. By that time, all bets were off. Greece was running big budget deficits and telling no one.
Time to Come CleanIt was the era of free money.
Greece was part of the euro zone, so investors mistakenly thought that government bonds issued in euros were somehow safer — and deserved lower interest rates — than old Greek bonds in drachmas. Since Greek banks paid higher interest rates and capital was free to flow across borders, capital flowed into the country at a rapid pace.
Banks with swollen deposits made loans fast and loose, which turned out to be a problem when the property craze crashed.
Eurostat, the agency tasked with reporting the condition of all euro zone members, regularly traveled to Athens from 2004 through 2010 in search of good data on Greece’s finances, on both the private and the public side. They walked away with nothing but guesses.
Meanwhile, as everyone later found out, the Greek government was busy working with Goldman Sachs to borrow money in such a way that the debt would not show up on its books. By 2009, debt was growing fast and economic activity was stalling.
The 2009 budget deficit was first reported in 2010 at 6% to 8%, but was later revised to 12.7%, which seemed horrible, until it was later revised to an uglier 13.6%. This being Greece, even that terrible number wasn’t reality. When Eurostat finally got good data and calculated the real deficit for 2009, it was a massive 15.7%.
Claiming they wanted to solve their financial issues, the Greeks brought in all new people to measure and report their finances. That did not turn out well. In 2013 Andreas Georgiou, the new head of statistics in Greece, was charged with inflating the deficit of the country in order to make Greece look bad (this is not a joke!).
Eurostat defended Georgiou, pointing out that his calculations were within the guidelines of euro zone reporting regulations. That didn’t matter to the courts. The 2012 deficit was too high, and it was clearly the fault of the messenger!
By this time Greece was already taking bailout funds from the troika, the lending trio of the European Commission, the European Central Bank (ECB) and the International Monetary Fund (IMF). Along the way, Greece defaulted on its government debt that was held by private sector investors.
Oh, strike that. The International Swaps and Derivatives Association, which gets to decide who defaulted and who didn’t, claims that private sector investors “willingly” worked with Greece to lower what would be repaid, therefore no default occurred. This is a story for a different day.
In order to get the bailout bucks from the troika, Greece had to agree to cut government spending on social programs, pensions, and employees, as well as raise taxes and actually go about collecting taxes.
The Greeks cut social programs, as well as government pensions and employees. As for going after huge tax evaders and reforming business dealings that rewarded a small circle of the very rich… not so much.
All of this left Greece with crippling taxes, including a value-added tax of 23.8%, skimpy social safety net programs, falling employment, and shrinking GDP. No wonder they are angry!
The newly elected officials have put a stake in the ground. They’ve called on the troika to renegotiate (which means lower) the amount of Greek debt that must be repaid.
All Bets Are OffLeaders of the ECB and the IMF have both said Greece must repay all they owe, as well as stick to their austerity programs. This is fabulous hypocrisy coming from the same people who applauded Greece when it “negotiated” with private investors to reduce the country’s debt outstanding.
If Greece doesn’t stick with its austerity medicine, the troika has threatened to withhold the next installment of bailout money. The funny part of such a threat is that the next round of bailout money doesn’t even go to Greece. It gets counted as more debt for Greece, but the funds actually flow back to the troika as debt payment.
It’s like a bank issuing you a loan just big enough to make a payment on a different loan you already have outstanding. The money never gets into your hands, the whole exercise just puts you further in debt.
The Greeks are running a primary budget surplus, which means they have a surplus before they make payments on their outstanding debt. From the point of view of Greece, if they simply stop paying their debt, then everything is fine.
What’s not to love about this approach?
I’m not saying Greece should risk exiting the euro by stiffing the troika, but Greece seems to be in a much stronger bargaining position. If Greece leaves the euro zone and doesn’t suffer economic collapse, it would be a roadmap for other countries that fall on hard times… like Spain, or Italy.
Why take all that economic pain when you can simply call for a debt “mulligan,” leave the euro, and start over?
This would shatter confidence in the euro and leave the economic bloc in limbo. The euro might get stronger as weak countries leave, but who knows? If the euro did shoot higher, it would drag down exports from the remaining countries, which would have the biggest effect on Germany.
It looks like the troika will have to negotiate with its unruly child, Greece. Until they’ve worked out their family problems, I’d keep my money well clear of the continent.

Rodney
P.S.
We’re taking hard look at the euro today and Adam has another perspective for you to explore in today’s Ahead of the Curve.


Euro is Down, Not Out
The euro is sucking wind!
It’s down a whopping 18% against the U.S. dollar since May of last year. And once the European Central Bank’s (ECB) stimulus package was announced last Thursday, it only intensified the selling, and the euro dropped another 3% in the wake of the news.
But my analysis shows the euro is poised to bounce.
I’ll be clear: I’m not recommending you go out and buy euros, or bullish euro positions.
We think the long-term trend of dollar strength and euro weakness will persist throughout 2015. But don’t be surprised to see a bounce higher in the euro over the next couple of months.
Intermarket analysis is a form of technical analysis that focuses on relationships between various market prices. Often, when a logical and persistent relationship between two markets is discovered, it can be used as a predictive tool for forecasting future price movements of related markets.
Here’s the 411Germany is clearly the stalwart of the euro zone economy and, thus, the euro currency. So when investors are bullish on the prospects of the German economy and German companies, they’re also bullish on the euro.
Likewise, when investors worry about Germany’s ability to carry the burden of Greece’s struggles, for example, they’re bearish German stocks and bearish the euro – it’s the same thesis, essentially.
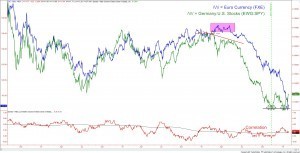
So I want to show you an interesting chart…
In blue, I’ve plotted historical prices of the CurrencyShares Euro Trust ETF (NYSE: FXE).
In green, I’ve plotted a “Germany-to-U.S.” ratio (EWG:SPY). When this ratio rises, German stocks (EWG) are outperforming U.S. stocks (SPY), and vice versa.
In theory, a rising Germany-to-U.S. ratio indicates investors are relatively more bullish on Germany than the U.S., and, thus, more bullish the euro than the dollar.
Empirically, this relationship holds true. The correlation (in red) between the euro (FXE) and the Germany-to-U.S. ratio is positive and often as high as 0.80. Take a look…
Now, here’s where it gets interesting…
The euro peaked in May of last year, but there were signs that the Germany-to-U.S. ratio was turning lower months before. Specifically, the EWG-to-SPY ratio made a triple top formation in January and February, it dropped sharply lower in March, and then it made a lower high in April — all bearish signs suggesting investors’ appetite for German stocks was waning.
That made the EWG-to-SPY ratio a nice leading indicator of the euro’s next move.
Currently, I see another potentially profitable divergence setting up… whereby the Germany-to-U.S. ratio has stopped falling, makes a double bottom formation, and begins trending higher (all bullish signs). Meanwhile, the euro currency continues to fall during this timeframe.
Since the EWG-to-SPY ratio made the turn lower months before the euro, in 2014, I’m watching for the same pattern to unfold now. If German stocks maintain strength in the near term, we’ll likely see the euro get a boost within a couple of months.
Again, this isn’t an unqualified “buy the euro” recommendation. Don’t do that!
However, I will be identifying ways to capitalize on this relationship with specific recommendations in both Boom & Bust and my trading service, Cycle 9 Alert.

Adam
January 27, 2015
Crisis in European Union
It’s not enough that Europe is sliding back into recession and deflation along with the worst demographic trends ahead of them, especially for stalwart Germany…
Now they have a terror threat that is looking more like 9/11 for the U.S.
The attack on French satirical newspaper Charlie Hebdo and more. Hundreds of thousands of troops deployed on the streets and dozens of arrests already, especially in France and Belgium… but also in the U.K. and Germany.
This wouldn’t occur if intelligence didn’t suggest a much greater threat ahead!
Major events like this may be hard to predict near term, but they do clearly come and build in the challenging half of a predictable geopolitical cycle.
And if we go back in history a bit, I wasn’t very happy that the forecasts for our second bubble into 2007 were much less than I expected, even though earnings were as strong as predicted during the rise of the tech bubble from 1995 to 2000…
But out of that divergence I discovered two new, powerful cycles… and it took a few years to figure it out but as I’ve said before, I have to dig deep when something we don’t expect occurs to reveal another important cycle or dimension of the economy.
I found a 29- to 30-year commodity cycle that peaked overall in mid-2008, but also in early 2011. The last one peaked in 1980. Now the commodity price declines are wreaking havoc in emerging countries that have the only strong demographic trends left.
The second steep drop in the price of oil is threatening to trigger the next debt crisis in emerging countries from fracking, much as the fall in housing prices triggered the subprime crisis in 2008 that in turn spread to fragile debt markets all around the world.
But shortly thereafter, I discovered the geopolitical cycle that goes back for two centuries and it’s even more critical as it most affects the valuations or the price-earnings ratios of stocks and all financial assets by 50% or so in adverse cycles.
That cycle ranges from 16 to 18 years wherein things are generally good in the world and then things go bad for a similar period. From 1983 to 2000 there were almost no geopolitical risks and since 9/11, everything has gone to hell.
Rising terror, one political crisis, one civil war and one failed war after the next. Recently we’ve had the scourge of ISIS, the French terrorist attack and the Shiite coup in Yemen, now the new headquarters for a resurging Al-Qaeda. The chart below shows the trends.
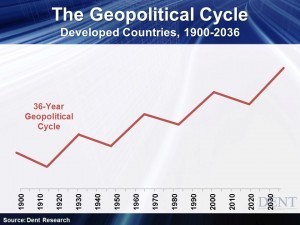
The important point to note: This cycle does not start to turn up again until around early 2020 and will be more positive into 2036 or so, just as demographic cycles start to point up again more often as well.
I’ve been warning that the Arab spring in the Middle East, the Russia vs. Ukraine and Sub-Saharan African crises will continue for another five years or so. Terrorist attacks and insurgencies will grow and current events are proof of that!
But then as with everything cyclical, things will start to get better for no obvious reason. We will be predicting that positive turn when most analysts will be extrapolating the worsening trends of terror, war and civil war years into the future.
So, let’s take a closer look at what’s happening here. The root of this crisis is the same as the income and wealth inequality crisis in developed countries, like in the U.S. Income inequality, the world over, is at high levels between the rich and poor countries, just as it is for the population within developed countries.
Oxfam just came out with a report that shows that the top 1% in the world have controlled between 46% and 48% of the wealth since 2000, almost as extreme as in the U.S. at 51%. Both of these trends have been rising since 2008 due to quantitative easing (QE) policies.
The top 80 billionaires control as much wealth as the bottom 50% or about 3.5 billion people and I just wrote about this inequality issue in depth in January’s Leading Edge. I think that this staggering inequality is proving to be a powerful catalyst to the current power struggle that’s playing out globally.
You can call it Islam versus the West but I would call it the poor versus the rich… and it’s the same all over the world.
The greatest terror insurgencies come from countries that have a very high percentage of Muslim population and are poorer than $5,000 GDP per capita (adjusted for purchasing power or PPP).
Yes, you can argue that the Middle East has older cultural values and are slow to change due to a certain lack of economic progress. But it just seems unfair to them that the western countries are so damned rich at $40,000 plus per capita incomes compared to $2,000 to $5,000 or lower — up to 20 times or more!
If you’ve ever been to any of the emerging countries, you’ll see that many work much harder than we do for much less gain, because they have less infrastructure and have, more often than not, a corrupt government and economic system that favors the few (even more than our more democratic and free market system does).
They don’t just hate us because of our freedom and values, they hate us because they work so hard and yet are still poor and disadvantaged… and yes, since their cultures have been slower to change, they will continue to live so by sheer momentum alone.
What I’ve learned from studying history is very summary and important: Technologies change faster than cultures, and cultures change faster than genes…
That’s what creates this dynamic of change and differences between cultural sectors between countries and within countries around the world.
At a stage in technological change, there is a breaking point where individuals and cultures revolt against the extreme income and wealth inequality that results at times like this.
It’s no accident that the terror revolt is coming from the Middle East, Northern Africa and parts of Sub-Saharan Africa, like Somalia and Nigeria. It’s not coming from South Africa that has fared better economically or from Indonesia where you find the largest of the world’s Islamic population at 12.7%. Or even in the U.S. where the Muslim population is better integrated into our culture as we are a country made up of immigrants.
But there is another aspect to this terrorist revolution from Al-Qaeda to ISIS and others that may be evolving. It is extremely bottoms-up.
This poor and small insurgency cannot compete head-on with the top-down intelligence and militaries of the richest countries in the Western world that they’ve been attacking. So, they’ve been forced to go for the guerrilla model, like the Swamp Fox, Francis Marion, considered one of the fathers of modern guerrilla warfare from the Revolutionary War.
They increasingly organize into very decentralized “terror cells” that have their own missions. That makes it harder to track them and defeat them.
We keep taking down their central leaders like Osama bin Laden and others, and think they’ll weaken. But they keep coming back like cockroaches.
As much as I hate to say this, we could learn from them in their new bottoms-up network model that I espouse for companies and developed countries in the new Internet and network world (Chapter 8 of The demographic cliff).
We’ll figure out how to quell this insurgency from 2020 on when the geopolitical cycle turns back up again, much as the Vietnam and cold wars dissipated after 1983 in the last positive geopolitical cycle until the Berlin Wall and the Soviet Union finally fell in 1989. But falling oil prices and the great boom in the west were winning the Cold War for us long before 1989.
But we’ll only finally thwart this by fighting them at the bottoms-up network level through greater intelligence, as we have already started to learn to do — and not confronting them directly in their own backyard as this tactic has already failed in both Iraq and Afghanistan.
For now, don’t expect the geopolitical environment to get better until 2020. And until then, don’t invest in such afflicted countries from Israel to Iraq to Nigeria as falling commodity prices will only add insult to injury and accelerate the civil wars and conflicts in these poorer countries.

Harry
Ahead of the Curve with Lance GaitanVolatility Spikes in Stock MarketVolatility in Interest Rate Market
Volatility has really picked up in the interest-rate market! I mentioned in last week’s edition of Ahead of the Curve, U.S. 30-year Treasury bonds hit an all-time low. Since then we managed to make another new low before spiking higher ahead of the European Central Bank (ECB) policy decision and statement of last Thursday.
Last week on Wednesday, long-term bonds made a new all-time low below 2.36% before climbing and ending the day at 2.47%. Overnight Wednesday and into Thursday morning ahead of the ECB announcement, the long bond yield climbed to 2.54%!
That is more than a 4% move overnight! Traders must have been looking for another disappointment from the ECB.
As of last Friday morning, the results of the ECB decision sent global yields sharply lower. Many European yields tumbled to record lows. The euro is at the lowest level in eleven years. European stocks have benefited from the ECB action as stocks in the U.S. did during the Fed easing.
Even though fundamentals in Europe remain questionable, traders are seeking higher returns in risk assets by buying stocks. U.S. stocks initially benefited from easing but have since pulled back, maybe because of a stronger dollar. U.S. Treasury bonds moved back toward record lows along with the rest of the globe.
In any case, it’s very apparent that central banks around the globe are manipulating the world financial system. As Harry Dent has mentioned on many occasions, this will end badly for those holding the bag when the central banks realize their efforts have been in vain and they stop their QE programs. Deflationary pressures prompted central banks to initiate these quantitative easing programs.
I was discussing all of this with Rodney Johnson this morning and we both agree that the ECB effort seems to be a last ditch effort to create inflation and goose their economy in the face of demographic and deflationary pressures.
When they figure out the program is ineffective (or when they are pressured to terminate their efforts), how will markets react? When that happens, look out! The bubbles will finally burst and then markets will eventually normalize. Assets will be priced fairly instead of traders trying to “front-run” the asset purchases by central banks.
The stock market has benefited from world-wide central bank tinkering and those who invested profited over the past six years but it’s time to be cautious. Harry Dent mentioned last week that we could see new highs in the markets in the short term but look out below!
We could see a major down-turn as early as March of this year. I agree with Harry, there are so many hazards that could trigger a major sell-off and as inflated as this bubble has become, common sense should tell you it’s time to start taking profits off the table.
If you have an interest in profiting from the rollercoaster interest-rate market, please take a look at the Dent Digest Trader. I’ll show you how to make healthy profits by trading options that capitalize on relatively small moves in interest rates on U.S. Treasury bonds.

Lance
January 26, 2015
Housing Market Looks to Millenials
Housing starts in the U.S. were up 8.8% in 2014. That’s the good news.
The bad news is that the growth rate in 2014 was slower than 2013 and 2012. But that’s OK, because home builders are optimistic that 2015 will be fabulous!
They estimate single-family construction starts will zoom ahead by 25% this year. Not to be outdone, the National Association of Realtors estimates single-family housing starts will grow by 32%.
Those are wonderful projections, but these groups seem to be missing something — clients.
It’s not as if the slow rebound in housing is a puzzle, at least for anyone who’s been looking. It’s not about low interest rates, we’ve had those for some time, and chances are we’ll be in a low interest rate environment for years.
We’ve also had plenty of people who fit the category of first-time home buyers, which would be young adults. What we’ve been missing is the desire on the part of those consumers to buy homes, and no program currently on the table is going to change that.
The exact young adults we expect to buy homes, college-educated professionals, are dealing with two huge issues: limited job prospects and soaring debt. The two work in concert to stymie the natural progression of consumers through their ages and stages of life.
A recent article in the Wall Street Journal sums it up nicely. The article describes a 31-year-old young lady in New York who works for a public radio station and waits tables. She has a master’s degree in acting from Columbia, and $190,000 in debt. She would like to move to New Orleans and buy a home, but is a bit fearful of not finding a job in that market.
In the not-so-distant past, anyone with $190,000 in debt had a house to show for it. Now, it’s a question worth asking: “Did you buy a nice condo with a water view, a modest home in the suburbs, or a piece of paper from a university?”
I’m not knocking student loans or college education. I’ve had my share of both, but at this point the dollars make no sense.
Meanwhile the job market is still very difficult, no matter what the headline unemployment number happens to be. The New York Federal Reserve estimates that 44% of recent college graduates (age 22 to 27) are working in jobs that do not require a college degree.
So while the unemployment rate of recent college graduates might be low, their earnings aren’t necessarily what would be expected after obtaining a four-year degree.
Slow To Get On The TrainBoth of these things are conspiring against millennials who want to travel down the well-trodden path of adulthood, which involves marriage, kids, and a whole bunch of spending.
As I’ve mentioned many times, an old boss of mine in Texas, David Smith, had a saying for every occasion. The week of my wedding he told me: “You’re never richer than the day before you get married.” That bit of wisdom has come back to me often over the past 25 years, but I know David was wrong.
As I found out a few years after I wed, you’re never richer than the day before you have children. I can attempt to reason with my wife as to why we need to spend money on golf clubs instead of furniture, but there is no reasoning with kids.
The money just flows out the door. I’m writing this after dropping my youngest, who’s still in high school, at the airport this morning for a school trip to Washington, D.C. The trip lasts for four days and three nights. Just the thought of the overall cost makes me shudder.
Millennials are proving slow to get on the train of having, and spending on, children because they’re slower to get married. And it has nothing to do with generational attitudes.
A recent Harris Poll survey showed that 21% of millennials believe marriage is very important to Americans, and 47% think it is important. These numbers are almost identical to those for Gen X (21% and 48%, respectively).
However, a report from the Urban Institute shows that today’s young adults are on track to have the lowest rates of marriage by age 40 than any previous generation. If the current pace of marriage continues, more than 30% of millennial women will remain unmarried by age 40, nearly twice the share of their Gen X counterparts.
If it’s not their view of marriage that is causing the millennials to eschew nuptials, then it must be something else. I’m pretty sure I can pinpoint the issues slowing down their marriage rate — income and debt.
As noted above for the home builders and realtors, the problem of a falling marriage rate doesn’t affect just the would-be brides and grooms. A lack of family formation creates a domino effect that touches all of us, and greatly alters the course of our economic future.
The good news is that, by and large, people are predictable. While millennials have pushed out marriage a bit, somewhere in the universe a giant biological clock is ticking.
It’s very likely that our young adult population will still marry in the same percentages as Gen X, and will also have children, which will put them on the same path to spending that the rest of us traveled. This will lead not only to increased demand for housing, but also baby furniture, children’s clothing, child care, and all the other things that go along with starting families.
Unfortunately, this good news generally stops at the shores of the U.S., since we have a significant young adult population and most other developed nations do not.
This means that the U.S. should eventually return to years of growth, while countries like Germany, Spain, Italy, and Japan will spend their years trying to balance the needs of an aging population with the reality of a shrinking working population.

Rodney
P.S.
In today’s Ahead of the Curve, Charles Sizemore explores the valuation of stocks by using the cyclically-adjusted price/earnings ratio and that we just may be trading at the highest P/E ratios since WWII. Take a look below.
Stocks, Overvalued or Undervalued
Last week in the Ahead of the Curve section of Economy & Markets, John Del Vecchio wrote about how the U.S. stock market was expensive by historical norms, using one of his favorite metrics, the price/sales ratio. A price/sales ratio above 1.26 signals danger and at 1.71 we are well above those levels today.
At ratios over 1.26, stocks are priced to deliver returns of about 0.70% per year based on past experience.
Today, I’d like to expand on John’s points using one of my favorite metrics, the cyclically-adjusted price/earnings ratio (CAPE). The CAPE takes the current market price and divides it by an average of the past 10 years of earnings, adjusted for inflation. By taking a 10-year average, you smooth out the booms and busts of the economic cycle.
It’s counterintuitive, but stocks can sometimes look cheap at the top of the economic cycle using the traditional price/earnings ratio when they’re actually very expensive. The CAPE smooths out this noise and gives better perspective.
For the history buffs out there, Benjamin Graham, the father of the investment profession as we know it today and mentor to a young Warren Buffett, used the CAPE extensively and wrote about it in his classic Security Analysis.
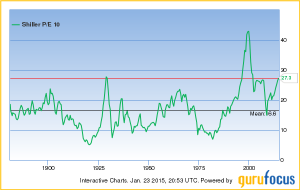
So, what does the CAPE tell us?
Well, at a CAPE of 27.3, stocks today are more expensive than they were in 2008 and about on par with their valuation in 1929. The only time in history when stocks were more expensive was the go-go bubble years of the 1990s.
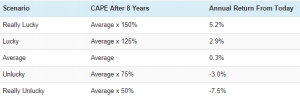
Let’s play with the numbers a little. At these levels, the S&P 500 CAPE is 64.5% more expensive than its long-term average. This implies that we’ll see annual returns of about 0.3% per year over the next eight years.
This needs a little explaining. There are three components that go into the calculation: the dividend yield, expansion or contraction of the CAPE to its long-term average and underlying business growth.
The weakest link here is business growth. The assumptions made by GuruFocus here assume that business growth is in line with past averages, and that’s an assumption I’d rather not make right now given the debt, deflation and demographic issues facing the world’s major economies.
Revising business growth lower would push expected returns even lower. But for our purposes here, we’ll roll with it.
Source: GuruFocus
Let’s look at some scenarios. For the sake of argument, let’s say that this time it really is different and that because today bond yields are so abnormally low, they keep stock valuations artificially high. If we get lucky, and CAPE valuations don’t revert to their means, we might manage to squeak out between 2.9% to 5.2% annual returns over the next eight years, including roughly 1.9% in dividends.
But given that markets tend to overshoot, swinging from overvalued to undervalued, I think it’s more likely we’ll see the negative returns you see in the table.
In John’s piece, he noted that, unlike the 1990s, when you could actually find value outside of bubbly tech stocks, “everything” is overvalued here. And I agree.
I’d add that by one metric the market is even more overvalued today than it was in 1999. The data John and I used covered the large stocks of the S&P 500, which is dominated by a small handful of mega-cap names.
But Dartmouth professor Kenneth French recently found that the median stock—that “average” stock in the middle—is actually trading at the highest price/earnings ratio since World War II.
The easy money was made a long time ago. If you’re investing new funds in equities right now, you’re betting that already expensive stocks will get even more so.
Frankly, I’m not so sure that’s a bet I’d want to make.

Charles
January 23, 2015
Biotech and Double Digits
After a sell-off in December, investors are starting to pour back into the biotech sector this month at rapid levels. At close of business on Thursday, the Nasdaq biotech index (Nasdaq: IBB) was up 5.81% for the month, while the S&P 500 was crawling back to break even at 0.21%.
Even though the biotech sector has experienced double-digit gains over the past four years, investors are continuing to double down due to higher growth opportunities over the rest of the market.
A significant driving factor for the growth is the current innovation wave being experienced in this sector.
Gartner, a technology research firm, has an excellent model for explaining the maturation of technology and its effect on industry called the “Technology Hype Cycle,” as shown in the chart below.
You’ve probably seen this before, but it’s an excellent reminder for gauging the impact of new technology on a market and how long this impact will last. This is crucial in biotech due to the rapid peaks and valleys in stock prices based upon drug approvals and treatment technologies.
Here’s a quick refresher on how the cycle works…
New technologies usually break into the market due to a major need or requirement that has driven them there. Although quite innovative, the Technology Readiness Level (TRL) or effectiveness/maturity of the technology is usually quite low when first entering the market.
Excitement or hype for the technology grows rapidly as people learn about it and start to brainstorm on how disruptive it will be to the industry. As you can imagine, this sudden and immediate hype drives up share price.
After widespread hype, the technology will go through a so-called “trough of disillusionment” after knowledge of the technology is widely known, but before it can be widely implemented due to maturity reasons. This trough is where most innovations die when they can’t be effectively or economically integrated with existing capabilities.
In biotech, this can also be equated to early drug trial phases.
During the “slope of enlightenment” phase innovation is engineered by industry for integration with the broader market by providing a reliable, effective and economical capability. After this is achieved, full production occurs ending in the “plateau of productivity.”
A great example of this is electric cars.
Before Tesla motors, a couple of the big manufacturers attempted electric car manufacturing on a small scale in response to rising gas prices. The fuel-free vehicles were a great concept, however battery capabilities in the mid-90s only allowed for limited range and power. Tesla motors broke these engineering barriers and pushed the 100% electric car into the mainstream.
For the past several months, we’ve been profiling billionaire Dr. Patrick Soon-Shiong and his cutting-edge cancer-fighting conglomerate NantWorks. What makes Dr. Soon-Shiong’s approach so successful is that he is methodically building his conglomerate’s capabilities by purchasing and merging with companies that all have very high technology readiness levels (well past the trough).
The formula for their success has been taking the most advanced and tested technologies in augmented intelligence, supercomputing, and high-speed networks, from industries traditionally outside of biotech and merging it with cutting-edge patient diagnosis and treatment systems from the health care industry.
By integrating together proven technology, NantWorks minimizes time spent in the dead spots of the hype cycle, bringing technology to market at unseen before pace.
To put things in perspective, we’re now seeing technology grow at a pace that is the equivalent of the American industrial revolution.
Before I go any further, let me make something clear. I’m not saying Dr. Soon-Shiong is the next John D. Rockefeller, J.P. Morgan or Andrew Carnegie but he is utilizing the same methodology to consolidate and control technology that these captains of industry utilized to build their empires.
Since NantWorks is a privately held conglomerate, investors have been hungry for an opportunity to associate themselves with this movement. One publicly traded company that presently has multiple partnerships with NantWorks is Sorrento Therapeutics (Nasdaq: SRNE).
Earlier this week, I sent an alert out through my trading service Biotech Intel Trader to purchase Sorrento at a true value price on Tuesday. At close of business on Thursday, just three days later, we’re currently looking at a near 10% return.
As always, I’ll continue to monitor the market’s social media collective intelligence and keep you updated on the latest trends. If you’d like a closer look at my service, you can do so here.
Happy Hunting,

Ben
The U.S. Dollar and Aircraft Carriers
It’s funny how things change when the world takes a turn for the worst.
Frackers that initially looked like the next revolution in energy and U.S. oil independence suddenly look bankrupt and uncompetitive when oil prices fall from $115 to $44.
In 2008, junk bond yields spiked from 7.5% to 23.5% as solvent bonds suddenly look more likely to default. Leveraged traders are getting killed with margin calls as stocks and commodities plunge. They go from heroes to zeros overnight.
Leading IPOs and tech leaders see their stocks plunge after making new records across the board.
Countries like Japan that led the 1980s boom suddenly crash the hardest and lose stature on the world stage for a long time, if not forever. And China is likely to face a similar fate, at least for the next decade, as they work off the greatest debt and overbuilding bubble in modern history.
That’s why it’s so important to see major turning points… and when the next great downturn does come, don’t you think that having 23 aircraft carriers, more than all of the rest of the world combined, would make you a safe haven?
Trend ChangesWe can only guess intelligently at minor turning points like most good forecasters.
I can’t tell you when a tsunami is going to strike Japan, or when the Fed is going to announce the next quantitative easing (QE) cycle, or when Putin is going to invade Crimea… although we do have longer and intermediate-term cycles that predict when such events are more or less likely.
Long-term trends are different… they’re much more fundamental and more predictable. Hence, our calls for major turning points are rarely wrong — just a bit too early or late at times due to such shorter term factors that are hard to predict.
These are the trend changes that are most important to get right for longer term profits in companies and investments. Once these trends change, there are strong negative feedback cycles, just as there are positive ones on the way up in a major boom.
Even though the rising demographics of the baby boom generation were the most important leading indicator of the last great boom from 1983 through 2007, much as the previous generation’s was from 1942 through 1968 — success builds on itself.
The longer the economy booms, the more confidence businesses and investors have and that increases buying and investing in the future. Borrowing goes up, mostly due to the demographic cycle of building durable goods between the late ‘20s and late ‘40s, but also due to increased confidence in the future.
New technologies move into the mainstream with the new generation’s spending power after their innovation cycle gave birth to them in the last downturn. But the productivity from such technologies amplifies profits and wages, and tends to bring interest rates down.
The lower interest rates, the greater the borrowing and speculation.
It’s when people start borrowing more to speculate than to increase their real assets and productive capacity that the economy starts to get vulnerable… and that happens naturally in the latter stages of any long-term boom.
And especially in the fall bubble boom season, which sees both the highest productivity and the greatest falls in interest rates.
That’s the positive feedback cycle in a boom period driven by more predictable fundamental trends in demographics, innovation and inflation cycles.
But then come the negative feedback cycles. When such trends finally reverse, the high debt and confidence also reverses. Interest rates spike up on the riskiest bonds and debt and it spreads wider as the downturn gets deeper.
When the economy drops and more stocks fall, consumers cut back on their spending and businesses minimize investment and lay-offs increase. The situation becomes dire when businesses begin to fail in large numbers and unemployment rises triggering loans to fail and banks get in trouble.
The more foreclosures, the more home prices drop and home loans fail.
In such a downward spiral and crisis, we learn who really has the goods and who doesn’t, especially in a survival of the fittest winter season of deflation. The U.S. dollar has grown through more debt and trade than any other currency, so when the great deflation comes, more of our dollars will be destroyed than other currencies.
That means fewer dollars that are paradoxically worth more. I’ve made this argument in my books and all of our newsletters so I won’t go into that here.
Globally, that is when the strongest countries hold up. In the developed world, the U.S. is still the largest and most innovative country — although we are slowly losing those leads. We have stronger demographics than Europe and Japan ahead. We’re the best house in a bad neighborhood as they say.
We’re printing and stimulating less than China and Japan currently, and now the ECB is printing euros at $70 billion per month to join the party again as a desperate and last response to their weakening economy and competitiveness.
Although we’re no longer the undisputed military power… we are still dominant.
At the Money Show in Orlando last year, Dennis Gartman was speaking ahead of me and he stated that we have more aircraft carriers than all other nations combined. We now have 11 super Nimitz flat-tops (they can carry 60 or more jets and are twice the size of most carriers) and eight of the more normal-sized. That is 19 total. But by 2020, we’ll have 14 Nimitz and nine normal, or 23 in total.
A few countries have two or three, and only a few plan on a Nimitz. Most countries like the French only have one… the infamous S.S. Croissant (just kidding).
This sort of military strength is worth more in bad times than it is in good times — like in our last winter season through the Great Depression and World War II where we first emerged as the sole military power in the world.
That continued into the 1990s, especially after the fall of the Soviet Union. But we’ll not see that again, likely ever.
We have been and will continue to bet on the U.S. dollar for the worst years of the deflation crisis into late 2016 or early 2017 and perhaps early 2020 as deflation favors the reserve currency and there is no one to replace us or our military power, despite squandering it since the early 1990s in wars beyond our reach.
After 2016 or so, the dollar may see its best days as we’ll see the faster rise of the emerging countries and especially the large ones like India in the next global boom.
We will reconsider our view of the dollar then, but for now it’s still the safe haven.
The Swiss franc is also looking better now that they have stopped trying to fight the fall of the euro by printing their own currency in order to keep their exports competitive.
They’re opting for a higher currency rather than higher short-term exports — kudos to them!
Other than that, watch out for all major currencies in the next two-plus years, especially the yen and the euro which have already been crashing… and as for China’s yuan — it’s next.

Harry
January 22, 2015
Cyclical Bull Market
Markets go in cycles. But it seems like many moons ago since we’ve experienced a significant and sustained dip in equities. This cyclical bull market is quite long in the tooth. In fact, it is now approximately 71 months old — and the older this bullish run becomes — the greater risk lies in being late to the game and getting caught holding the bag when equities falter.
For perspective, the typical duration of a cyclical bull market over the last 100 years has been approximately 40 months. We’re past due not only for a correction, but a material decline in equity prices to reset expectations before the next bull market can begin its advance.
Both short-term and long-term indicators that I watch on a regular basis are pointing to the markets operating in the riskier end of the spectrum right now. One key metric I watch is the price/revenue ratio of the S&P 500.
Many investors focus on earnings when evaluating the overall valuation of the market. But, as a short seller and forensic accountant, I have little confidence in the earnings that are reported because in my view they’re highly subjected to financial engineering such as buying back stock to boost earnings per share (EPS), reversing reserves, artificially lowering the tax rate, etc.
While revenue can be manipulated as well, the “top-line” has far fewer variables determining its level rather than earnings.
When viewing the Standard & Poor’s (S&P) 500 from the lenses of revenue, the valuations are reaching nosebleed territory. The following chart shows that aside from the Internet bubble of the late 1990’s, the price/sales ratio of the S&P 500 is at generational highs.
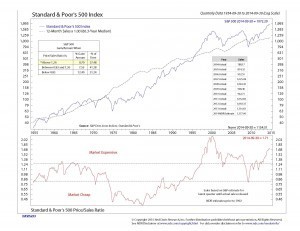
The price/sales ratio of 1.71 which is well above historical norms. That means the market is pricing revenues at a greater level than the biggest bull market of the last 40 years that started in 1982 when many more factors were in the market’s favor.
For example, during that market cycle, baby boomers were allocating to the market through 401(k) plans, companies still operating defined benefit plans which led to increased contribution to equities, real personal incomes were rising at a much faster pace, and the U.S. was more dominant globally.
How high above historical norms are we?
Well, the ratio is above 1.25 (the point considered “excessive”) only 28% of the time with less than 1% annual returns at that level or higher. We’re now at a level nearly 40% higher.
What’s more of a concern to me is that in the late 1990’s technology stocks dominated the S&P 500. Then as the next bubble was created in housing, financial stocks dominated the S&P weighting.
Today, there isn’t a sector of the market that’s a “bubble” which could be avoided. Rather, everything is overvalued here. So while technology stocks led the market lower from 2000 to 2002 and financials cratered in 2008, today everything in the market is vulnerable.
This makes the market extremely risky given that there are far fewer places to hide in a coming correction and the next bear market. Therefore, investors should be cautious as to where they allocate new funds to equities.
The return potential doesn’t justify the risks.

John
Equity Rollercoaster
Over the past several years there were a few things you could count on…
Interest rates would stay low, central bankers around the world would print more money, and momentum stocks would go nowhere but up.
In the equity markets this led to the death of volatility, which was nicely illustrated by the iPath S&P 500 VIX Short-Term Futures Exchange Traded Note (VXX), which tracks futures based on the Chicago Board of Options Exchange Volatility Index. This security is usually viewed as a hedge against the markets falling, which explains why it has done so poorly for so long.
The value of VXX goes up and down with the volatility of the S&P 500. Since stocks have been marching higher with very little retracement until the end of 2014, VXX was a losing bet much of the time since it was introduced at the beginning of 2009.
In fact, the note lost so much value from inception through the summer of 2012 (more than 95%) that in October of 2012 it did a 1-for-4 reverse split. Barclay’s, which maintains the note, exercised its right to recall all shares of VXX and issue one new share for every four shares that were outstanding. This brought the price of VXX from just under $9 up to the mid-$30s.
Unfortunately, that wasn’t good enough…
Tides May Be TurningIn 2013, Barclay’s did another 1-for-4 reverse split of VXX, taking the stock price from around $12 to near $50. Even with this, VXX traded at just under $27 last month.
But the fortunes of VXX might be turning. The rollercoaster ride in the equity markets over the last six weeks has pushed VXX back up to the mid-$30s. At the same time, many of the high-flying momentum stocks have fallen out of favor.
Two of the darlings in the last several years have been Keurig Green Mountain and Apple. Both have had their ups and downs. Keurig was a target of famous short-seller David Einhorn. As he drew negative attention to the company the stock price took a hit, but soon rebounded and shot to new heights as Coca-Cola started buying chunks of the company.
Apple was knocked back on its heels around the time Steve Jobs passed, but has since come back with a vengeance. Since November, both stocks have fallen from grace along with several other high-flying names. Just in the few trading days of 2015, Keurig is off more than 2%, while Apple is down 4%. Other fast-movers have fallen even more, with Priceline off 11% and Tesla down more than 13%.
In my Triple Play Strategy, where I hold three stocks that are trending higher, I let go of both Apple and Keurig at the start of the year and rotated into traditionally less volatile names. I like both of these companies and think they have a lot of potential, but they occupy the rarified air of momentum stocks.
My goal is to book profits, not stick with stocks as they drop because I think they might turn around some day. With all of the gains that have been made in companies like Apple, Keurig, and Tesla in the past several years, it makes sense that as fear and uncertainty creep back into the markets, investors will lock in their gains and head for safe harbors.
The markets are bracing for the last big bang of stimulus from a central bank when the ECB announces its expected bond-buying program this week. But then what?
The Federal Reserve is leaning toward raising interest rates, not printing more dollars and China just popped its latest bubble, which was a huge run in stocks over the past three months.
Earlier this week, the Bank of Japan announced there was no need for additional stimulus until at least mid-year so that previous programs could be given time to work through the economy. With the ECB program announced, and the Fed, the People’s Bank of China, and the Bank of Japan sitting this one out, what is going to lift equities?
It doesn’t appear as if global growth is rebounding, and commodities are still trending lower. It could be that the drug of printed money is finally going to lose its effect. If that happens, be sure to look through your own portfolio to see if you own a stock that is greatly over extended, or perhaps even a market darling that is quickly falling out of favor.
It could be time to move.
Rodney
P.S.
Today is John Del Vecchio’s first time with Ahead of the Curve. He’s talking about market valuation and the S&P 500. We’re very excited to welcome him to Dent Research. He has a lot of experience and we’re sure you will benefit from it. Read on…


