
Harry S. Dent Jr.'s Blog, page 64
February 2, 2018
Blockchain Is the Grownup in the Crypto Playroom
 Last week was a good week at Hidden Profits.
Actually, last week was a great week at Hidden Profits! You see, one of my recommendations was bought out. American International Group Inc. (NYSE: AIG) announced an all-cash deal to buy Validus Holdings Ltd. (NYSE: VR) for $5.56 billion. The stock popped 44% on the announcement.
The best part?
The position was recommended only three months prior, give or take. That’s a tidy triple-digit annualized return in what I considered a relatively low-risk, if not misunderstood, stock with impeccable shareholder yield characteristics.
However, the upside experienced in Validus is nothing compared to what February’s Hidden Profits stock recommendation has in terms of long-term potential.
I’m diving into the cryptocurrency craze head first!
I’ve been watching cryptocurrencies such as Bitcoin very closely in recent months – I mean, who hasn’t?! The rise in the value of these currencies has been nothing short of staggering.
The broader investment public is now paying full attention (and top dollar). Futures contracts started trading on Bitcoin, which some felt legitimized it as an asset class, and now you can find the price of Bitcoin on data services as easily as you can find the Dow Jones Industrial Average.
But the question remains: Do these currencies have value, and is all of this sustainable?
Well, I’m very skeptical in both directions. I wouldn’t be surprised if Bitcoin goes to $1,000 or $40,000. To me, it seems like a vehicle for nothing more than speculation.
Once the general public gets involved in a sector, there’s usually a fervor which lifts all stocks in the space. But, just like with the PC revolution, the internet, and social media, there will be very few winners and many, many of losers. That’s why I am skeptical of cryptocurrencies.
However, I’m not skeptical about blockchain technology, which often gets overshadowed by the currencies themselves.
Blockchain technology is essentially a digital ledger that can record transactions. It’s incorruptible, with the information dispersed across its network and no single point of failure. The data is public and verifiable. These characteristics make the blockchain incredibly valuable.
I think blockchain technology will be huge and revolutionary. I also think that investors don’t differentiate between the currencies, many of which may become worthless, and the blockchain technology.
Recently, I looked long and hard to find investment opportunities that could benefit shareholders from the blockchain.
I’m not talking about lemonade companies that change their name to Lemonade Blockchain and see their stock price rocket higher. I mean real companies. Companies with management teams with real experience in financial services. Companies that are well funded and that have backing from smart investors.
The billionaires. I want to ride on the coattails of the billionaires.
After searching and searching, I think I have found such a company.
Its stock has certainly popped along with many other companies involved in the crypto craze. But it has an experienced management team, backing from some marquee investors, and technology that can revolutionize the financial services industry.
I also think that the economics of the business can be very high margin, leading to tremendous cash flow profits over the course of time. The businesses that survive and thrive will make ripe acquisition targets or benefit shareholders by returning large sums of cash in the form of buybacks or dividends.
We’re still in the early phases of this revolutionary technology, and Hidden Profits plans to jump on that train and take a ride with its February 2018 stock selection.
Good investing,

John Del Vecchio
Editor, Hidden Profits

The post Blockchain Is the Grownup in the Crypto Playroom appeared first on Economy and Markets.


February 1, 2018
Peak Amazon
 The stock is up 2,170% since the March 2009 bottom.
You could have turned $100,000 into more than $2.2 million.
But did you?
I’m not trying to be rude, in asking that – just frank.
You see, a lot of people fool themselves.
Studies have shown that most people think of themselves as “above-average” (mathematically impossible). And most smart, well-educated people think they have a leg up on the competition when it comes to investing… that they have what it takes to identify and ride Amazon’s to lucrative heights.
The truth is…
I don’t think many everyday folks have made as much money on Amazon as Amazon (and Jeff Bezos) has made on us.
And worse, I think anyone who buys shares of Amazon today are setting themselves up for failure.
There are two cognitive biases – aka “mental glitches” – that come into play here.
The first is hindsight bias, defined as the inclination, after an event has occurred, to see the event as having been predictable, despite there having been little objective basis, before the event occurred, for predicting it.
It’s also called the “knew-it-all-along effect,” because that’s the tell-tale claim people will make when their memories and perceptions are under the influence of hindsight bias.
How does this bias play out with regard to Amazon?
In hindsight, the rise of Amazon seems almost obvious. You can order anything in the world, from your couch, and have it delivered to your door in two days, for free. Who can argue or compete with that?!
But Amazon’s plan for world dominance wasn’t so obvious to investors – or even Jeff Bezos – back in 1997, when it IPOed, or even in 2002, after it turned its first profit as an “online bookseller.”
No one really knew Bezos had ambitions beyond books and compact discs (CDs)… or that a decade of cheap oil would make home-delivery shipping so inexpensive… or that automated warehouse technology (aka “robot pickers”) would save Amazon millions in labor costs.
Though now – with the benefit of hindsight – we know all of these things and more.
Looking backward, we can connect the dots and understand why Amazon is so successful, today.
The second cognitive bias at work here is the recency bias – the inclination to use our recent experience as the baseline for what we expect will happen in the future.
Simply put: We extrapolate what’s going on today, for as far as the eye can see… as if it’s a straight-line trend, with no bends and no end.
These two cognitive biases can be a lethal combination.
Hindsight bias tricks us into thinking we have a better shot at identifying stocks with massive return potential than we actually do – leading to overconfidence and imprudent risk-taking. And the recency bias tricks us into buying stocks like Amazon after their incredible run-ups – a practice called performance chasing.
In the case of Amazon, we:
Observe (looking backward) how Amazon has dominated the market and generated enormous stock gains…
Understand the “how” and “why” behind the company’s success (but only with the benefit of hindsight, even though we’ll trick ourselves into thinking we “knew it all along,” or at least could have)… and,
Expect it to continue this way indefinitely (as we’re fooled by the recency bias).
Mark my words: An investment in Amazon will do far worse over the next nine years than it’s done over the last nine years.
If you’re buying shares of Amazon today, as a long-term investment, you’re buying closer to the top than the bottom.
I know it may seem like there’s no end to Amazon’s success… no bottom-of-the-well for its market and earning power.
But history shows there’s always a limit to how much of the pie one company can claim.
Over the last 40 years, there have been only 12 U.S. corporations able to grow their market cap to 2% or more of the total market.
IBM topped out at 4.4% of the total market in 1985 (the highest percentage of total market cap claimed by one company, since 1980).
Apple maxed out at 3.2% in 2012.
And Google hit its wall, at 2% of total market cap, in 2007.
Where’s Amazon today?
1.7%
I’m not saying Amazon’s stock will roll over and die tomorrow. The company will continue to push on with its plan for world domination – and I’m sure it’ll continue to make gains in market share for some time.
But don’t fool yourself into thinking you can join the party now and make the same returns you’ve been eyeing in the stock’s rearview mirror.
It just ain’t gonna happen.

Adam O’Dell
Editor, 10X Profits
Follow me on Twitter @InvestWithAdam
P.S. I first shared these concepts with my 10X Profits subscribers last month. We trade two highly-liquid ETFs, using a system that’s geared to generate 1,000% returns in around four years – no stock-picking required!

The post Peak Amazon appeared first on Economy and Markets.
January 31, 2018
Gold and T-Bond Yields Rising as Expected
 Three trends I’ve been forecasting have been happening in the last year:
The strong Trump rally.
Rising 10-year Treasury bond yields.
And rising gold prices.
They’re all related to late stage inflation and the expected tax cuts, which have materialized.
One thing that still hasn’t happened, and still doesn’t look imminent yet, is the bursting of this increasingly parabolic stock bubble.
Hard for that to happen when we’ve had the QE free lunch for so long, and now the large tax cuts to corporations.
GDP growth seems to be picking up, but not as much as expected. The fourth quarter reading came in at 2.6% instead of the expected 3.0%-plus. The full 2017 reading was 2.3%, just marginally higher than past years that have averaged 2%.
Rising growth suggests rising inflation and rising inflation means higher T-bond yields, which have already been the case as the chart shows.
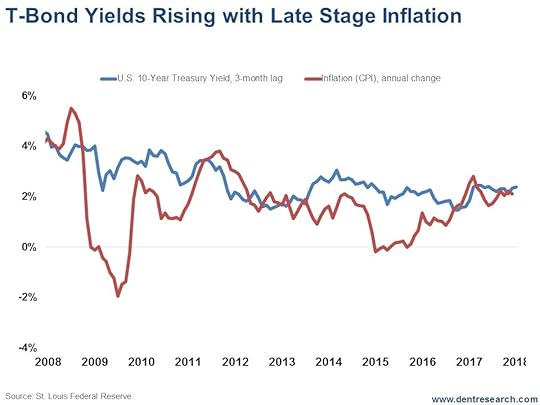 I have also been warning that inflation is a lagging indicator.
The last recession saw inflation rise in the first several months – and T-Bond yields with it – before coming down into late 2008/early 2009. This is typical and comes from rising wages with tighter labor availability and rising commodity prices in the late stages of a boom.
On a related note, I’ve been expecting a substantial gold rally – but not a new bull market for the commodity – from the extreme oversold reaction into the end of 2015, when gold hit $1,050 from an all-time high of $1,934 in September 2011.
Look at this next chart…
 Note that this chart is the annualized percentage change in gold to correlate with the percentage rate of inflation.
Gold is more of an inflation hedge, than a crisis hedge.
It crashed 33% in the midst of the Lehman Brothers meltdown, while silver was down 50%.
With this trend of mildly rising inflation, gold prices and T-bond yields will likely continue moving upward until there are signs of an economic slowdown and/or a bubble burst in stocks. Then deflation will set in, as occurred briefly in late 2008.
The T-Bond channel I’m watching closely has a strong resistance around 3.0% yields – which was the previous high in December 2013 – and we are getting close, at 2.73% on Monday, January 29.
If we break strongly above that, then we are in a new ball game that would be very bad for stocks and real estate.
Gold has resistance at the last major high around $1,375, and the high before that, at around $1,428, is the other strong point of resistance. That’s the range I’ve been forecasting in the last year or so.
Rising T-Bond Yields aren’t good for stock or real estate valuations. Will 3.0% start to be that point? We may find out soon enough.
I see 3.0% as the opportunity to buy long-term Treasurys (30-year are the best) to lock in higher yields and play the inevitable deflation trends ahead when this bubble finally bursts.
And I see the $1,375 to $1,400 area as the opportunity for people who didn’t get out of gold in 2011 when we warned to finally take your money and run.

Harry
Follow Me on Twitter @harrydentjr

The post Gold and T-Bond Yields Rising as Expected appeared first on Economy and Markets.
January 30, 2018
What If Your Gut Is Wrong?
 I got an email last week I was hoping I wouldn’t get.
TradeStops, the service I use to keep track of my stop-losses, sent a message telling me that Albemarle Corp. (NYSE: ALB), which I had recommended in Boom & Bust back in 2016, had closed below the stop-loss I’d specified for readers.
I wrote a quick note the next morning to my subscribers recommending they sell their shares of Albemarle and move on.
Albemarle was a good trade for us, and I have nothing to complain about here. Readers walked away with 50% gains in the stock, even after the recent correction. By any measure, the trade was a success.
But it still hurt me to tell the readers to part with the stock because I just knew the recent selloff was a market overreaction. Nevertheless, I told them to sell. Here’s why…
It’s possible (and probably very likely) that my gut was right and Albemarle’s recent selloff was the result of short-term profit-taking that would quickly run its course. The long-term macro trends supporting the stock were still in place and nothing had fundamentally changed.
But what if my gut was wrong?
As a morality tale of why it’s important to be systematic and not simply trust your gut, consider the case of billionaire hedge fund mogul Bill Ackman of Pershing Square Capital Management.
Ackman made the news this month because he laid off nearly 10% of his staff, including – gasp! – his personal chauffeur.
You know times must be tough when even the driver is getting canned. But that’s what happens when you lack basic risk management. You get burned.
Ackman lost $4 billion betting big – and wrong – on Valeant Pharmaceuticals. At one point in time, Ackman had nearly 20% of his portfolio in that single stock. But because he owned so much of it (and because so much of his identity as a manager had become centered on it) he couldn’t sell when things started to turn south.
From peak to trough, Valeant lost 97% of its value… and Ackman rode it all the way down.
To put that $4 billion loss in context, Ackman’s total assets under management have fluctuated between about $11 billion and $20 billion the past couple years. So, needless to say, that $4 billion loss represented a big piece of his investors’ capital.
Ackman’s cardinal sin was his lack of discipline, and it’s likely he’ll never fully recover from this. Let’s play with the numbers.
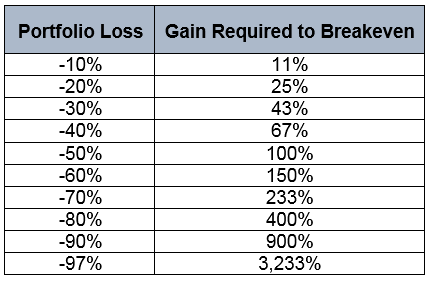 Gains and losses aren’t symmetric. If a stock drops 10% on you, a 10% gain won’t get you back to breakeven. You have to earn 11%.
If you lose 50%, you have to earn 100% to get back to breakeven.
And if, like Ackman, you lose 97% on a stock, you’d need 3,233% returns just to get back where you started.
I don’t know about you, but not many stocks in my portfolio return 3,233%, or at least not in a timely manner. This is why it’s absolutely critical that you cut your losses early.
If you’re a good stock picker, you can easily recover from a 10% or even a 20% loss by simply making 11% to 25% on the next trade. That’s doable.
But you’re not going to recover from a 97% loss. That money is gone forever.
This brings up two critical risk management factors you need to consider whenever you make an investment:
Position sizing
Where to set the stop-loss
I think we can all agree that Bill Ackman had too much of his portfolio allocated to Valeant Pharmaceuticals. But how much is too much?
There is no hard rule here, but in my most aggressive portfolio I limit my position in any single stock to 10% of the portfolio. And in my less aggressive portfolios, I try to limit my exposure to 5% or less.
The way I look at it, if a 10% position were to go the wrong way on me and drop 20% to 25% before I was able to get out, the loss to the total portfolio would be a modest 2% to 3%. That’s an easily recoverable loss.
If you want to be a little more scientific about it, my friends at TradeStops have developed a sophisticated way to set position sizing based on historical volatility.
You probably know by instinct that something like Bitcoin – which can routinely move 20% or more in a single day – should be a smaller piece of your portfolio that, say, staid, boring ol’ Berkshire Hathaway.
But TradeStops will actually crunch the numbers for you and give you an allocation that’s optimized for current risk.
This brings me to the second consideration, knowing where to set the stop-loss.
Here, you’ll find different opinions, none of which are necessarily “wrong.”
William O’Neil’s Investor’s Business Daily recommends using a hard 7% stop loss on any new position, period. One size fits all. And there’s nothing wrong with that. A lot of investors have done well following O’Neil’s advice over the years.
A lot of newsletter writers recommend using a 20% trailing stop. And again, that’s not an unreasonable rule of thumb. It gives your investments a wide berth while also protecting you from large, devastating losses.
But again, my friends at TradeStops have gone a step further and put hard numbers to it. TradeStops will recommend an optimized stop-loss for each individual stock in your portfolio based on that’s stock historical volatility.
A more conservative stock might have a stop-loss set at less than 10%, whereas something like Bitcoin would have an optimized stop loss of around 50%.
In Boom & Bust and Peak Income, I use TradeStops to help me set my stop-losses. As a general rule, I’ll use TradeStops’ recommended stop-loss level as my baseline, though I may tighten the stops based on my market outlook or based on my specific objectives with that particular stock.
With a systematic approach, I take the emotion out of investing and, knock on wood, I’ve thus far managed to avoid taking any major losses in either newsletter.
If you’re interested in learning more about TradeStops, please click here. Me and Rodney recently sat down to talk with its founder and CEO, Richard Smith.

Charles Sizemore
Porfolio Manager, Boom & Bust

The post What If Your Gut Is Wrong? appeared first on Economy and Markets.
January 29, 2018
Get Ready for Bigger Paychecks
 So far in 2018, New England froze over and the government shut down. And it’s only January!
But just like with Christmas, there are some things that never happen fast enough. One of them is any change that gives workers bigger paychecks. With February just around the corner, that change is coming fast!
The IRS has published the new withholding tables reflecting the recent tax reform. By the pay period ending February 15, employers should have built these rules into their payroll calculations.
The end result will be more money in almost every pocket. (There are some high-earners who will feel a pinch.)
There’s reason to believe the lower tax rates will stick around longer than the law allows, and unfortunately, they probably won’t create the economic growth that the president and Congress want.
Tax reform was mostly about cutting corporate taxes, along with mild tax relief for individuals. Without significantly raising taxes elsewhere, the overall effect was to increase the budget deficit by $1.5 trillion over the next 10 years.
But Congress cannot increase the deficit without 60 votes. This tax reform passed, ironically enough, through budget reconciliation, which only requires a simple majority of 50. Because of this procedural dance, the tax reform act had to add back in tax revenue by the end of the 10-year window.
By making personal taxes move higher seven to 10 years from now, the impact of the legislation will be revenue neutral at the end of 10 years. That’s why individual taxes that fall today are set to rise in the future.
While this is the law of the land, I don’t think many politicians will object to maintaining lower taxes on individuals down the road, at least not on the bottom 80% of earners. To do otherwise would be political suicide, and most of the elected class are more concerned with re-election than anything else.
Then there’s this… Even with more jingle in their pockets, I don’t think consumers will rush out to spend those extra nickels.
We still have the same financial issues we had at the end of last year, and a few extra bucks won’t make them go away.
The largest group of Baby Boomers turn 57 this year, which means they’re more than halfway through their empty-nester years. By all measures, they are woefully unprepared for retirement.
Per the 2016 Federal Reserve Survey of Consumer Finances, Americans 55 to 64 years old had about $59,000 in financial assets. This is the median, so half the group had less, and half had more. This doesn’t include retirement accounts, but the news isn’t much better on that front.
From the same report, only 60% of the same age cohort actually had a retirement account, and the median value was a mere $120,000.
Looking at the typical empty-nester with a retirement account and a few bucks in the bank, that person has a whopping $180,000 to use in retirement, plus whatever modest amount they receive from Social Security.
Those numbers aren’t exactly comforting.
That’s why I think the Boomers, along with most people older than 30, will probably save more of their newfound wealth than spend it. Restaurants might get a boost, and perhaps Starbucks will sell a few more lattes, but modest spending growth in a few areas won’t be enough to boost GDP.
For that, we need a major economic change, which won’t happen until the Millennials get fully onboard with forming households and having children. When that trend takes hold in the 2020s, then we’ll be back in growth mode.

Rodney Johnson
Follow me on Twitter @RJHSDent

The post Get Ready for Bigger Paychecks appeared first on Economy and Markets.
January 26, 2018
Coming Soon…
 Well, not literally to a gas pump near you. Let me explain…
Two Thursdays ago, I sent out the first issue of my new service, Energy Profits Accelerator, to our Network Members to preview. Two days ago, I closed out my final “beta test” position that was opened October 30, 2017, for a 231% gain!
Many of you are familiar with Treasury Profits Accelerator and how I use call and put options as a means to leverage volatility in the Treasury bond market. You’ll see the same type of options plays here. Though ultimately I’m deploying a different strategy, rest assured, I’m bringing my same disciplined approach.
Treasurys and the energy sector seem like apples and oranges, but there’s actually a clear (to me!) connection between the two.
The Treasury bond market is one of the largest and most liquid on the planet. It’s there that I discovered how we can make big and quick gains on overreactions.
The energy market is also very large, and trading in that space is very liquid, too. Companies that make their money in this sector usually make more or less depending on the price of the commodity they specialize in producing, exploring for, refining, transporting, and/or marketing.
Energy and energy stock prices have a reputation for high volatility (big moves), and they also have a habit of trending for long periods of time.
First and foremost, my system is designed to jump on established trends when the time is right. I plan to use put and call options in my universe of energy stocks, and I intend to ride out the trend to a target price on the underlying stock. My time horizon for the trades are up to six months.
I also employ risk-management procedures to help cut losses short when the trade doesn’t work out as expected.
I have a watch list of about 30 stocks. While the industry divides companies into three main categories – upstream, midstream, and downstream – I have the list broken down into eight subcategories.
These subcategories identify the company’s core business, and I’ll limit trades to one company in each subcategory. This means we could hold up to eight trades at any one time. However, that’s unlikely. My subcategories are as follows: coal, exploration, oil pipeline, natural gas pipeline, refiner, marketer, integrated oil, and energy services.
In the future, I may add alternative energy companies as a separate subcategory if any meet my share price and volume criteria. My list can also change because of mergers and acquisitions.
Each of the companies in my universe require a share price over $20 and an average trading volume of over 500,000 shares per day. Both criteria are important because we trade options on the underlying stocks. Without liquidity and a high enough share price, trading the options for a fair price would be impossible.
I’ve been beta-testing the underlying strategy for eight months, and that’s on top of the 10-year back-test I ran as well. In April 2017, I opened my first live option position to an internal group, and now I’m unveiling the full strategy to you.
My beta test closed out eight trades, with four winners of 132%, 25.97%, 132.69%, and, from just this past Wednesday, 231%! I had four losers of 23.81%, 18.97%, 25.88%, and 53.78%. Just one of those triple-digit winners would have completely offset all four losses!
In the next few months you’ll be able to gain access to Energy Profits Accelerator. I’m really excited about this new research service, and I hope you are too.
If the idea of juicy triple-digit winners as got your attention, then maybe this’ll interest you: my colleague Adam O’Dell just booked a 400% profit for his readers last week on just one trade in his Cycle 9 Alert trading service – and believe it or not, there’s a special discount out right now for access to Cycle 9, with the price slashed by 57%. But for the next few days only. Don’t miss all the details here.
Good investing,

Lance Gaitan
Editor, Energy Profits Accelerator

The post Coming Soon… appeared first on Economy and Markets.
January 25, 2018
I’m Changing My Name to Charles Blockchain
I saw something last week that brought back memories: Doc Martens boots.
My bartender was wearing a pair of the classic black variety, which, apparently, are back in style after a long 20-year drought.
In case you’re unfamiliar with the brand, imagine something that looks like a combat boot but with a soft rubber sole and distinctive yellow stitching.
Ah, Doc Martens… Along with Seinfeld, flannel shirts, and grunge rock, few things are more quintessentially 1990s. It takes me back to my high school and college years when, for inexplicable reasons, dressing as an odd combination of British punk and Canadian lumberjack was all the rage among American teenagers.
I don’t intend to buy new pair anytime soon. While I’m as guilty as the next 40-something of desperately wanting to relive my youth, I realize how utterly ridiculous I would look wearing a pair of jackboots that look like they were custom made for a soccer hooligan.
Classic-style cowboy boots are more my style these days. In Texas, where people routinely spend more on a fully-loaded King Ranch Ford pickup truck that they would for a new Mercedes, wearing a pair of fancy cowboy boots counts as growing up and going bourgeoisie.
But beyond footwear, 1990s style seems to be making a comeback elsewhere… most notably in the stock market.
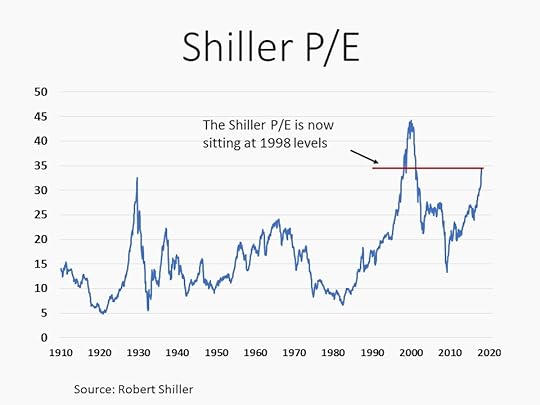
As measured by the Shiller P/E (also called the CAPE), American stocks are as expensive today as they were in early 1998… near the end of the greatest stock market bubble in history.
 And while the objects of speculation are different – back then it was profitless tech stocks that no one really understood; today it’s cryptocurrencies no one really understands – we’re seeing the same bubble excesses.
Back in the 1990s, companies would add “.com” to their names and instantly see their share price explode. In the December 2001 Journal of Finance, researchers Michael Cooper, Orlin Dimitrov, and P. Raghavendra Rau found that changing the name of a company to an “internet-related” name resulted in an average abnormal return of 74% in the 10 days following the announcement.
Keep in mind, nothing in the actual underlying business had changed. It was simply the name on the front door. And that was still enough to send the stock price shooting to the moon.
Well, it’s no different today. Last month, the Long Island Ice Tea Company – which makes bottled lemonade and ice tea – changed its name to Long Blockchain, and instantly saw its shares soar by 500%.
It’s crazy, but that’s exactly the kind of behavior you see in bubbles, when cautiousness and prudence get thrown out the window.
High valuations like these make me uncomfortable because we all know what came next. The 2000-2002 bear market was one of the worst in U.S. history. From peak to trough, the S&P 500 gave up just shy of half its value.
That was bad in 2000, but it would be far more devastating today. The Boomers are retiring by the millions, and after the epic run we’ve had in the market, many are overallocated to stocks. A report published by Wells Fargo last month showed that the average Baby Boomer had about 60% of their nest egg invested in stocks.
Back in 2000, you could ride out a nasty bear market in stocks because your bond portfolio was likely throwing off 6% or better in current income. But today, you’re getting less than half that yield, which has encouraged a lot of investors to dump more money than they’d normally be comfortable dumping into the stock market.
If experience has taught us anything, it would be that buying and holding stocks at these prices is a dangerous game. But having a large chunk of your portfolio invested in the stock market isn’t necessarily a risky mistake so long as you’re willing to be tactical and sell when the time comes.
In the short term, expensive stocks can get even more expensive. The late stages of a bull market can be some of the most profitable. I mentioned that the S&P 500 is trading at early 1998 levels. Well, in the final two years of that bubble, stocks went on to gain another 60% before rolling over and dying.
You just have to be nimble and be willing to trade rather than long-term invest.
And that’s exactly what Adam does in his Cycle 9 Alert trading service. As you may have seen, his subscribers just booked a 400% gain last week and tripled their money in another recent trade.
So while this expensive market may make me uncomfortable, there’s obviously gains to be had. Click here to learn more about Adam’s short-term system.
Charles Sizemore
Editor, Peak Income

The post appeared first on Economy and Markets.
January 24, 2018
How Long Does This Bull Market Have Left?
We called this explosive Trump rally.
Right after the election…
After Dow futures fell 800 points overnight and the S&P 500 and Nasdaq futures hit their 5% limit, which halts trading, and then everything turned around and opened the day in the green – an extreme reversal on high volume…
We sent an email to subscribers saying we would see a Tramp rally that would see the market gain 20% to 25%, if not more.
I had been cautious up to that point, after an apparent rolling top in 2015. But Wall Street was convinced they would get another massive free lunch… and they recently got what they wanted with the tax reform bill.
Now, this rally is looking very, very stretched.
Yet, there are NO signs of divergences or technical indicators to warn that a peak is near.
So, the million-dollar questions are:
How long does this bull market have to live?
And will any of the usual warning signs appear or be as obvious as they were in early 2009?
It’s an impossible question to answer because this rally is the first in history to primarily be driven by artificial stimulus and not natural fundamentals and “animal spirits.”
This is more than a bubble.
It is an artificial bubble, like the Mississippi Land Bubble in France in 1720 that was driven by a government scheme of finance.
This isn’t a case of a good-times boom that has just gone too far, like 1925 to 1929 and 1995 to 2000… or 1985 to 1989 in Japan.
Given that fundamentals have had little to do with this bubble, and the tools I usually turn to when forecasting market movement are no longer as effective, or may not show up at all, I find that patterns in stock charts are the best fallback.
And what I’m seeing on these charts is that we have some accelerated rising wedges and channels that clearly look like topping patterns in the making.
That’s why, in the January issue of The Leading Edge, I show readers how powerful this pattern can be… and what it’s warning right now.
I shared 10 charts with them, discussing the patterns and the points at which it would be best to take money off the table.
I can’t share all of those details with you – for that you’d need to become a lifetime member to Boom & Bust – but I will show you one chart…
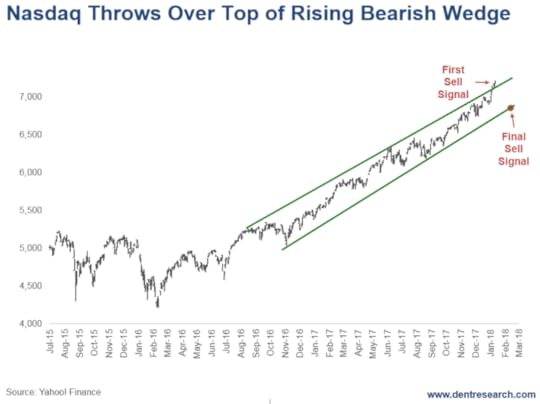
The Nasdaq.
The Nasdaq bubble, from December 1994 to March 2000, was the steepest one we’d seen to that point.
One of the warnings that the bubble was in its orgasmic final stage was the Internet Index (Bloomberg) bubble that only came alive from November 1998 into March 2000. It made more than 8-times gains in just 16 months – more than the entire Nasdaq gain of 6.3 times in 5.4 years.
But that overall bubble came into a final steep channel from late 1999 into early 2000.
Well, guess what?
We find ourselves in an eerily similar situation today!
On Friday, January 12, we got a slight throw-over rally (meaning the top trend line of the rising bearish wedge was broken) on the Nasdaq, with new highs of 7,221.
That was an aggressive place to look to get any passive investments (like those in your 401K) out of the overall market, even if only partially.
The higher probability sell signal would come around 6,600 near term, with a break of the lower trend-line, about 8% to 9% lower.
Here’s what I’m looking at…
 Really, all we need to pop this bubble now is a pin.
And I’ve mentioned several times already that I think Bitcoin is it!
Bitcoin has gone up 20 times in a little over a year! Its bubble is greater than even the infamous tulip bubble. This is the best sign of a major top ahead.
My prediction is that, within a year, Bitcoin will crash 95% or more, down to $1,000 or so. As that happens, investors will begin to question all bubbles, just like they did with the internet bubble crash in 2000.
Buckle up. This could get interesting.
And stay tuned.

Harry
Follow Me on Twitter @harrydentjr
P.S. Another million-dollar question is: Do you get out of the market now or not. The best answer I have for you is to follow the trend for now, and team up with Adam O’Dell, who helped his readers grab 85.9% average profit per trade in 2017!

The post How Long Does This Bull Market Have Left? appeared first on Economy and Markets.
January 23, 2018
The Real Estate Bubble Looks Eerily Like Early 2006
We called the real estate bubble top in late 2005, just before it began to burst in early 2006. So did Jim Stack, a newsletter writer in Whitefish Montana.
Now Jim has a Housing Bubble Bellwether Barometer that’s flashing a sell signal after going up 80% last year. All our alarms are going off as well.
The Confidence Indicator for the National Association of Home Builders/Wells Fargo is at its highest reading in 18 years… higher than it was in early 2006.
The Case-Shiller National Home Price Index is now higher than the peak in early 2006, and looks like a carbon copy of the last bubble.
All of this is to say: things are looking dangerous in the real estate market!
Look at this chart…
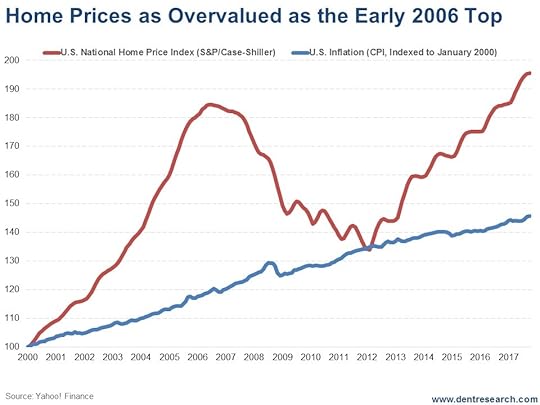
The chart measures home prices versus the CPI (Consumer Price Index). Robert Shiller proved that real estate prices correlate with inflation long term. In fact, Shiller was the only other forecaster (alongside us) who called the housing bubble last time.
In 2017, prices went up 7% while inflation went up 1.9%.
This index is 34.3% above the CPI, almost exactly like the 35% premium in early 2006!
These two bubbles couldn’t be more similar in time frame, overvaluation, and advances if they’d be computer constructed… yet almost no one sees a problem here! When will people ever learn!
Mainstream economists and forecasters are bubble-blind again!
The best sector of the S&P 500 last year was, of course, homebuilders – up 74.8%.
Starter-home companies are doing the best as that’s where the supply is tightest and the demand the strongest.
Yet, home builders have been leaning more towards the high end of the market and aging Baby Boomers for higher profits.
LGI Homes Inc. is a good example of a company that has nailed the low-end markets. It was up a whopping 161% in 2017. The largest homebuilder, D.R. Horton, was up 87% (that could be a great short in the next few months).
But like I said: alarm bells are sounding.
There are two potential “pins” that could trigger a collapse in real estate…
The first is mortgage rates rising from around 4% towards 5%.
The second is the fact that property taxes are no longer deductible. That hurts the bubbliest states like California, New York, and New Jersey.
My bubble model would suggest that home prices go back to their point of origin, at worst, or, most likely 85% of the way. That suggests a loss of 42% to 49%! That’s worse than the 34% crash from 2006 into 2012.
And my model says it should take as long to deflate as it took to build – or about six years or into around 2023, just like last time.
That’s a long way away down!
We’re finalizing a special real estate ebook at this very moment. It contains details of the countries and states most at risk in the bubble… and how much each stands to lose when this situation turns bad. We’ll be sending details about this as soon as its ready, so watch out for that.

Harry
Follow Me on Twitter @harrydentjr

The post The Real Estate Bubble Looks Eerily Like Early 2006 appeared first on Economy and Markets.
January 22, 2018
When Your Friends Decide Your Credit Score
When my kids turned 16, they got three things: a driver’s license, a (used) car, and a credit card.
They needed the license to drive, needed the car so that I didn’t have to let them drive mine, and the credit card was pure convenience.
By using the card, they could buy gas without getting money from me, make small purchases we’d discussed ahead of time, have a method of payment in case of an emergency, and one more thing: They could start building credit.
If you don’t have a credit history, your FICO score starts out quite low, which makes it tougher to rent apartments, get utilities turned on, obtain credit cards in your name, and take out loans. These are all things that young adults do, so my goal was to help my kids build a credit history as soon as possible, thereby facilitating an easier path when they went out on their own.
It worked.
Their credit scores are near 800, which is pretty good. Whether or not they screw them up from here is their responsibility.
I used the known metrics of the credit rating system in the U.S. to help my kids establish their profile. But what if the credit system looked beyond financial data, and considered criteria like social activities and even friends when calculating your creditworthiness?
Would my kids still have high scores if FICO knew my son liked to game at all hours, even though he’s a voracious reader and earned good grades? Would my younger daughter, who seems to collect friends from around the nation in all walks of life, be dragged lower by association with people who’ve walked different paths?
This might sound like the stuff of science fiction, but it’s happening today, just not here.
This is the social credit system (SCS) in China.
The Chinese government intends to roll out social credit scores for its citizens by 2020.
The program will be very similar to Sesame Credit, which is a part of Ant Financial, the company that handles much of the mobile payment system across the country. These programs don’t limit their ratings to financial history. They also include social connections, security, wealth, and compliance.
Hmm.
So if a Chinese citizen pays his bills on time, but has friends who don’t, his social score will suffer. Not only that, but if the same citizen racks up too many parking tickets, he’ll also get dinged, even if he pays the tickets.
These scores have real-world implications. Chinese citizens with lower scores on similar programs find they can’t rent decent hotel rooms, travel on airplanes, book first-class tickets on trains, etc. And the Chinese government makes no apology. Their stated goal is to raise up the good actors while limiting opportunities for bad actors.
And the scores for the new system will be public.
Such a program flies in the face of Western ideals. We recoil at the notion of a government or private entity limiting our options because of our social activities, political leanings, or even legal history, to a point. But the Chinese are different. They don’t have such compunctions. But that doesn’t mean the system won’t spiral out of control.
Will those with high scores refuse to make social connections with those lower in the ranks? Will entire industries spring up around bumping one’s score by connecting with others of high rank for a fee, or performing good works that, again for a fee, get reported to local party officials?
On the other side of the coin, the SCS looks like the exact control device that the Chinese government wants so that it can put down political protests and quickly isolate disruptive individuals and groups.
The key to the entire program is the question of who gets to decide what’s acceptable or commendable behavior, and what’s not.
Everybody always agrees on what’s right and wrong… right?
It will be interesting to watch this situation unfold.
The Chinese government could be well on its way to creating a large, permanent underclass of those with low ratings who are distrusted and can’t access services. Or it could be fomenting a revolution by groups who get tagged as bad actors.
Either way, it doesn’t sound a like a recipe for long-term economic prosperity.

Rodney Johnson
Follow me on Twitter @RJHSDent
P.S. In case you missed it, Teresa wrote to you on Saturday about the 400% profit Adam locked in last week on just one trade in his Cycle 9 Alert trading service – and how we’re offering a special discount for access to Cycle 9, slashing the price by 57%. But for the next few days only. Don’t miss all the of the details here.

The post When Your Friends Decide Your Credit Score appeared first on Economy and Markets.


