
Harry S. Dent Jr.'s Blog, page 57
March 28, 2018
Kooky Real Estate Prices in Leading Global Cities
£593,369 – the average price of a house in London in January! (That’s about $829,000.)
$1 million plus – what 400 square foot condos go for in Vancouver!
$1.5 million – the cost of a median house in San Francisco!
$20 million – for a 2,000-square foot penthouse condo with a view of Central Park!
Who the hell can afford prices like these?
And the situation isn’t much improved in the less glitzy suburbs. Home prices have increased twice as fast as income growth.
It can’t, and won’t, go on like this for much longer.
In my five-city tour in Australia in February, I kept asking the audiences: Why do you think super-high real estate prices are good for your economy? After all, it raises the costs of office space and salaries for businesses. It forces households to spend more of their incomes on mortgages and rents, leaving less for everything else.
In a recent poll, 49% of adults said they would never be able to afford a home in Australia.
How can that be a good thing?!
Aging Baby Boomers are sitting on their real estate to milk every last drop of price appreciation out of it that they can (keeping inventory off the market in the process). And Millennials can’t afford to buy what homes are available.
Who is more important to our future? Rising workers or retiring and dying people?
Here’s how kooky it’s gotten out there…
There are 66 square foot “closet” condos – I’m talking starter homes – in cities like Hong Kong and Shenzhen in China. That’s basically a bed and a toilet… or a prison cell!
Is Hong Kong so great it’s worth living in that small a space??
I was there earlier this year and I say NO!
A few years ago, I was in Vancouver – my favorite city in North America. It’s also the favorite city for the affluent Chinese who are busy laundering their money out of China into major English-speaking cities around the world.
Not long ago, the trend was to pay $1 million for a 400 sq. ft. condo. That’s got to be $1.2 million plus by now. That means an everyday, young person or couple must pay $3,000 per square foot to get a small studio with only enough room for a fold down bed!
Is Vancouver that great?!
Luxury condos in Manhattan now typically cost $3,000 to $4,000 a sq. ft.
While hunkering down after Hurricane Maria, we saw a 560-sq. ft. apartment that was renting for $4,000!
560 sq. ft.
That’s smaller than a comfortable two car garage.
In fact, that’s less than half a volleyball court!
And people are paying $4,000 a month to rent that!!
That’s insane!
Then there’s San Francisco, home to the biggest real estate bubble in the U.S. thanks to foreign buyers and Silicon Valley. There the median house is going for $1.5 million. The median 2-bedroom apartment costs $3,040 per sq. ft.
Mark my words: something’s got to give.
And it may already have started…
Prices are slowing or backing off on the high end. Hot markets have gone from $10 million plus to $5 million plus. Manhattan condo sales have plummeted to a six-year low. The biggest drops are in the high-end townhouses that foreign buyers most prefer.
The number of landlords offering incentives on leases rose from 25% in August 2017 to 50% in December as the number of new leases dropped from 7,500 to 4,200.
In January, house prices in London fell 2.6% year-over-year, while the posh, centrally-located Wandsworth borough fell 14.9%. That’s the fastest rate of decline since the financial crisis.
And in the fourth quarter of 2017, San Francisco lost more people than any city in America.
Forty-nine percent said they could consider moving out of that $1.5 million median home. It would take a $303,000 annual income with a $300,000 (20%) down payment to afford that.
How many people have that kind of income, even in high-income San Francisco?
Only 12% of residents can now afford that.
When does the bubble end, when only 1% can afford the median home?
This is nuts and simply not sustainable. And the cracks are starting to show in the high end of most major markets.
The next real estate crash will be the opposite of the last one where it started at the low-end with subprime defaults. This one will work from the super overvalued high-end and work its way down to Homer Simpson.

Harry
Follow Me on Twitter @harrydentjr
P.S. Watch out for my latest eBook Real Estate Doomsday: How to protect and grow your wealth during the greatest real estate crash in history. In it I detail the numerous other reasons – besides affordability – that will deflate this real estate bubble. And I specify which cities are at the most risk. Watch out for the release announcement.

The post Kooky Real Estate Prices in Leading Global Cities appeared first on Economy and Markets.


What if everyone had the same information at the same time…
Rodney recently wrote about the latest Facebook (Nasdaq: FB) data-mining (and data-losing) scandal. It’s a complex story, no doubt, in that it’s not just about companies tailoring ads for you – Facebook records data on your texts, your phone calls, and your GPS location, among who knows what else.
As Rodney says, Facebook users are Facebook’s product. That’s not going to change anytime soon.
But taken together with the still-unresolved questions surrounding the 2016 election and our voting infrastructure, as well a constant stream of data breaches companies like Equifax (NYSE: EFX), Target (NYSE: TGT), and so on, it’s clear we’re in a cultural shift that’s attempting to reconcile personal privacy and safety with the near-unlimited availability of the internet and subsequent input and output of personal data.
Cryptocurrencies are a big part of this shift — though whether they’ll stick around is another story. The basic idea is ingenious and laudable: a currency impervious to manipulation built on total transparency. Thing is, no one’s using bitcoin like a currency (except for maybe some shadow-world villains and their ilk).
It’s a speculative investment at best… for the time being.
George Soros famously made $1 billion in a single day (back when a billion dollars was “a billion dollars”) by shorting the British pound when it moved beyond a fixed 6% band. These types of moves happen hourly in cryptocurrencies.
It’s as if we’ve combined the shelf-life of the news cycle with billions and billions of dollars’ worth of investments.
Maybe my skepticism comes from my own upbringing in central New York. There’s a bit of conservatism there, rooted in a blue-collar work ethic. Or maybe it’s because I’m Italian. Nothing feels better than a roll of cold, hard cash stuffed into my front pocket – preferably wrapped in a rubber band!
The idea of a currency that exists in the ether – no, I’m not talking about Ethereum, a different cryptocurrency! – makes me feel uncomfortable. But, while I am skeptical about bitcoin and its ilk, I am not skeptical about technology behind it.
Namely, the blockchain, which is both the key to understanding bitcoin and the most complicated part of the whole thing.
See, back in February I found a company for my Hidden Profits readers that quietly got in on the ground floor of blockchain technology, but not just with bitcoin. I learned that blockchain technology could be a complete game-changer for elections and institutional investing.
Most people don’t vote. The weather might be bad or the lines very long. Polling places aren’t the most comfortable venues. Voting can be confusing. The last ballot I encountered was numerous pages and about three feet long.
What’s more is that it seems like there’s a controversy nearly every year. People get turned away or there are phantom votes. Or, maybe worst of all, the votes don’t count. Remember the “hanging chad” controversy from the 2000 presidential election?
Blockchain can simplify and secure the voting process, which has the potential to radically change both the nature of and the public’s engagement in voting. Outside of public elections, the technology can used to ensure the legitimacy of proxy votes for corporate investing.
The company I found at the forefront of this type of system, which is already regulated by the Securities and Exchange Commission as an alternative trading system. This will allow it to operate much like a stock broker but with the transparency and security benefits of blockchain.
As a portfolio manager, I often deal with issues beyond just picking stocks. These are often called “back office activities.” There are many days where there are trading issues that need to be double checked, margin calls to be dealt with or technology issues related to trading platforms that pop up. Operating in a compliant fashion is way more important than picking stocks in this highly regulated environment.
When shorting a stock, for example, you must first locate the stock to borrow before you can short it.
Once you have it “borrowed” you can then sell the stock in the open market and collect the cash in return for the sale. The failure to do so can create regulation problems. tZero digitizes this process. It shows the inventory of “shortable” stock and provides substantial automation for the overall process. The platform creates a digital locate receipt, which is then sent to the fund’s service providers and brokers.
Everyone has the same information at the same time and in a consistent fashion.
I’ll say that again: Everyone has the same information at the same time and in a consistent fashion.
That sounds like a dream, or a good science fiction novel idea. It’s not. It’s developing as we speak.
There are going to be more data security scandals in the months and years to come, and I believe we are close to a reckoning in how to comfortably be as hyper-connected as we are. Blockchain technology could very well be the bridge that gets us to the other side.
Of course, in the meantime, feel free to share this article on Facebook, and give Hidden Profits a look while you’re at it.

John

The post What if everyone had the same information at the same time… appeared first on Economy and Markets.
March 27, 2018
Facebook Becomes a More Attractive Buy With Each Day
I like the television show Blue Bloods, starring Tom Selleck, which I think makes me old.
The show airs at 9 p.m. Central time on Friday. If I watch it at the appointed time, then I’m necessarily at home.
On a Friday night.
Watching television.
And then there’s the content.
The show centers around a New York family full of cops, where the good guys almost always win and the bad guys usually go to jail. Like the long-running series Law & Order, Blue Bloods often pulls stories from the headlines.
Unlike reality, on the show things work out for the best. After spending my week reading way too much about current events, I like the escapism. Again, I’m feeling old.
There is one part of the show that I detest. Advertisements.
Like every other primetime show, it’s packed with ads, which cut down the show’s run time dramatically.
But there’s a reason for the ads. Someone’s got to pay Tom Selleck, along with the rest of the cast and the team it takes to put together a show, and then bear the cost of distribution.
Television producers, actors, and studios are not altruistic organizations. They don’t give stuff away. They must be paid.
In this relationship, as the viewer, I am the product. The television network attracts me with the show, and then sells me, or rather my attention, to advertisers.
In almost every instance, if you think you’re getting something for free, you are the product.
If I don’t like that, I can choose not to watch, or even watch in a different format… which I’ve already done. I occasionally watch Blue Bloods on Netflix, where each episode runs 42 minutes. But I must pay for my Netflix subscription. In this relationship, the content is the product.
Which brings me to Facebook…
The social media company provides a platform where I can post everything about my life that no one ever wanted to know, connect with people from my past that I detest, and “like” posts from other people even when I am completely ignorant of the subject matter.
I can also stay up to date with far away friends and relatives, and stay connected to my alma mater and other affinity groups.
Not everything that happens on Facebook is bad or wasted time… but it’s also not free.
Just like television networks, Facebook isn’t doing this for altruistic reasons, and neither are any other sites on the internet.
To Facebook, I’m the product, and so are you.
The company has two billion unique users, with 1.4 billion signing on every week. They allow companies to run surveys that attract people who apparently like surveys, and then use that information to tailor advertising.
This level of sophistication draws in gobs of advertisers, who pay Founder Mark Zuckerberg and company billions of dollars to target ads to the right people.
The latest dust up with Cambridge Analytica shows that detailed data about Facebook users can be very valuable, and that Facebook hasn’t done a good job of making sure that data from its site can’t be used for commercial purposes without the company’s consent. But it hasn’t changed the basic relationship between the site, users, and advertisers.
We are still the product.
To nail this down, ask yourself how much you’d be willing to spend to use Facebook without any advertising. Now ask yourself if you’d rather pay that amount, or just keep your cash in your pocket and let the advertisers try their best to persuade you to buy something.
I’m sure plenty of people would rather pay, but I’m also sure that many more of them would like to keep their cash and are willing to navigate the advertising.
The media are dumping on Facebook for breach of trust.
Trust in what?
Who among us thought that our data was safe from the prying eyes of anyone willing to pay the firm for data? Now the Federal Trade Commission is launching a probe of the company.
I think it’s awesome. The more people, reporters, and regulators that pile on to the company, the lower the shares go, giving investors a chance to snap up one of the leading companies of our time at a discounted price.
I would not suggest catching this falling knife today, but I’d certainly put it on my list of potential holdings for when the drums of war against Facebook go quiet, which they most certainly will.
And who knows, maybe I just gave the company a new product idea – Facebook Platinum, which requires a monthly subscription fee and removes the ads. If only my mom worked there, she might let me have my subscription for free. Maybe.

Rodney Johnson
Follow me on Twitter @RJHSDent

The post Facebook Becomes a More Attractive Buy With Each Day appeared first on Economy and Markets.
March 26, 2018
The Million Dollar Retirement Catch Up
To safely and quickly build a million-dollar retirement account, even if you’re currently underfunded and running out of time, you must take advantage of a little-known sector of Wall Street to increase dividend payments by as much as 30%… safely generate annual gains of 17% a year, even if this bull market finally comes to a grinding halt… and potentially TRIPLE your retirement account every seven years.
Sounds easy, right?!
Yeah, not so much. However, today, and over the next several weeks, I’ll show you that it’s much easier than you might think.
Let’s start with the last point…
What could tripling your money every seven years mean to you?
Here’s just one example…
If you’re currently 50 years old and you’ve only managed to put away $50,000 so far… you could still end up retiring with as much as $1.35 million by the time you’re 71!
This is what your account could look like each year along the way…
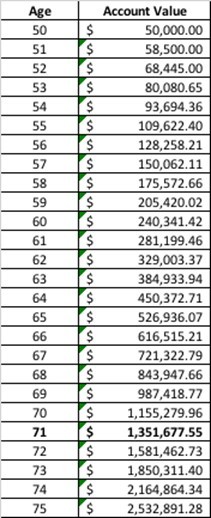
After just one year at 17%, your gains could be $8,500, bringing your account to $58,500…
After seven years, you could already be looking at THREE times your money!
Ten years after you start the Million-Dollar Retirement Catch Up, you’re already a quarter of the way there…
And that’s when the gains from this strategy really accelerate… tripling your money again by age 64 to over $450,000…
Then rapidly growing at a rate of more than $100,000 per year by the time you hit full retirement…
Until you cross the $1,000,000 mark by the time you’re ready to ride off into the sunset.
Now let me clear about one thing…
No matter how old you are and no matter how much you currently have in your portfolio, it is absolutely possible to TRIPLE your retirement savings every seven years.
A 35-year-old with just $25,000 could hit $1.2 million by age 60.
A 45-year-old with $100,000 could hit $2.3 million by age 65.
And even a 55-year-old with any amount could triple their nest egg by age 62.
Like I said, over the next several weeks, I’m going to reveal to you the strategy you need to make this happen.
Stay tuned.

Charles Sizemore

The post The Million Dollar Retirement Catch Up appeared first on Economy and Markets.
March 23, 2018
The $900,000 Difference in Your Retirement Account
There’s no magical age for retirement. The fork in the road doesn’t suddenly appear at age 62, 67, or 70. It’s here right now, TODAY… no matter how old you are.
That’s because whether you’re 40, 50, 60, or somewhere in between, there’s never a better time than right now to make your financial independence and your retirement dreams a priority.
Unfortunately, 9 out of 10 Americans are nowhere near financially prepared for their retirement.
But recognize that every day, every month, or every year that you wait to fix it only puts you further and further behind.
Let’s look at it a different way…
Here’s a chart that shows the growth of $50,000 from age 50 through age 75.

The blue curve is the growth based on an 8% annual return – the typical average return of a 401(k). The green curve represents the expected growth using the Million-Dollar Retirement Catch Up.
As you can see, there’s a significant difference between these two results… more than $900,000 over a 20-year period, in fact!
Even over the next 10 years, there’s a potential $132,395 difference.
That’s because the catch-up strategy I’ve developed is specifically designed to SAFELY TRIPLE your money every seven years. That’s a return you simply won’t get with a diversified 401(k) portfolio or by investing in the broader market with an index fund.
I’ll share details with you over the coming days.
Charles Sizemore

The post The $900,000 Difference in Your Retirement Account appeared first on Economy and Markets.
Living the Retirement Dream
Continuing the conversation on retirement, I must say that the whole concept is bizarre to me.
Everyone has this notion that we must retire at 63 (on average) and then spend the rest of our lives doing nothing.
Today, if you make it to the age of 63, there’s a good chance you’ll live well into your 80s and your spouse may live even longer. That’s an awful long time with which to do nothing!
And doing nothing is the fast and easy road to sharp mental and financial decline.
So I was pleased to see some of the feedback Teresa got over the weekend to her question: What are your retirement dreams? It seems many of you intend to keep yourselves busy, and equally as many intend to continue working, albeit in on a lighter schedule.
What’s my retirement dream? Listen to this week’s video to find out.
And read what Charles has to say below about the $900,000 difference in your retirement account.
Harry
Follow Me on Twitter @harrydentjr

The post Living the Retirement Dream appeared first on Economy and Markets.
March 22, 2018
Stay Away from This Crypto Bubble (For Now)
The crypto ship is sailing in rough seas at the moment. My advice? Stay away for now. Preserve your capital for after the major crash, and then pick winners from the bones.
The bitcoin and cryptocurrency trends seem to be following the path the internet took back in the very late 1990s. That bubble came at the end of the tech bubble, and expanded by more than 8 times between late 1998 and early 2000. Then it crashed 93%.
Bitcoin has come at the end of the second tech and internet bubble.
It has been up by more than 20 times since late 2016.
And so far, it’s crashed 70% in a little more than two months.
As I was writing this, this Morgan Stanley Research (courtesy of Bloomberg Technology) chart popped into my inbox. Pretty telling…
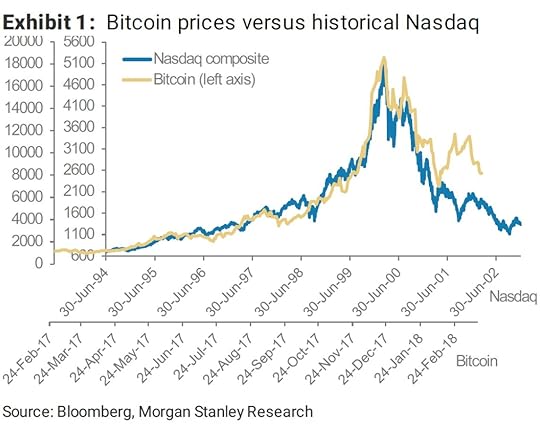
But that’s not all…
Bitcoin has bubbled up three times now. Once into 2011, again into 2013, and into 2017 as well.
It went up 59 times, going from $0.05 to $29.50 between July 22, 2010 and June 8, 2011, and then it crashed 93% into November 18, 2011 – just five months.
Michael Terpin, who spoke at our Irrational Economic Summit in Nashville last year, and who has created a nine-part cryptocurrency mastery course that will be available to you soon, spoke about being in bitcoin when it was just $0.10.
Bitcoin bubbled again when it went up by 561 times, from $2.05 to $1,329 from November 18, 2011 to December 4, 2013. From there, it crashed 86% into January 14, 2015.
During this latest bubble, it’s gone up 122 times, and over 20 times in just the last year when it bubbled the most.
So, a 90%-plus crash this time around seems highly likely.
The worst-case scenario is that it crashes back to the late 1996 lows (where the bubble really started), between $800 and $1,000. That’s a loss of 95% to 96%… a slightly greater loss than the dot-com crash because bitcoin has bubbled more and faster. In fact, the bitcoin and cryptocurrency bubble has now exceeded even the extreme tulip bubble of 1635 – 1636.
I spoke at Michael Terpin’s CoinAgenda Caribbean Conference in Puerto Rico over the weekend. Most of the people offering investments there claimed that it was NOT for the everyday investor… they know how volatile this market is.
So, again: don’t jump onto this ship just yet. Wait until we’ve seen the seemingly inevitable crypto crash to its conclusion, and then look to buy the larger, stronger survivors.
Ethereum is likely to be one of those, and bitcoin as well.
In fact, just like what happened after the internet crash, there will be several larger companies – that have something real to offer – that will survive.
This chart shows how some of the survivors from the dot-com crash did, both into the 2007 top and the recent top on January 26, 2018.
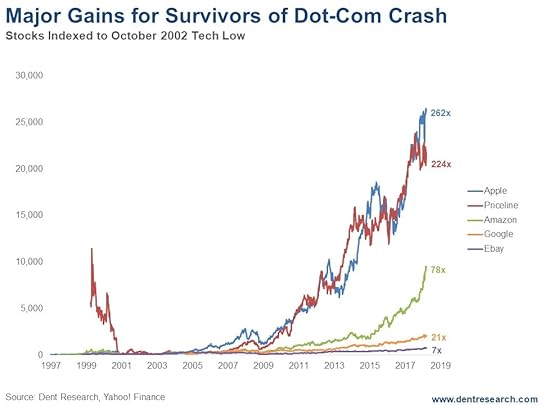
If you had bought when we signaled a bottom in the tech wreck in early October 2002, Apple would have been up by 262 times into the recent January 2018 top.
For Priceline, that gain would be 224 times.
For Amazon, 78 times (if you had bought Amazon at its earlier bottom in 2001, the gains would have 290 times).
Google, that IPOd in 2004, would have increased in value by 21 times.
That’sif bitcoin and cryptos see a 90%-plus crash ahead. In the meantime, let the crypto traders risk their money on this extreme bubble.
Harry
Follow Me on Twitter @harrydentjr

The post Stay Away from This Crypto Bubble (For Now) appeared first on Economy and Markets.
March 21, 2018
Finding Hidden Profits in an Overvalued Market
I’ve gone off in this space many times on the fact that market valuations are stretched to the max. As a result, forward returns, on average, are likely to be much lower than what we’ve experienced over the past several years.
How much lower?
Well, with the median price-to-sales ratio at 2.5 and nearly three standard deviations above normal, we’re in uncharted territory. If the price-to-sales ratio were just 1.5, then the annualized return is just 2.5%. Using this as a baseline would return not much above the dividend yield on the market.
You don’t need me to tell you that’s a horrible risk-to-reward ratio.
However, overvalued markets can stay overvalued. The reality is that the market is still open for business, and at Hidden Profits we focus on a new stock idea each month.
Here’s how we navigate an overvalued market.
Show Us the Money
I start with a model that over emphasizes the ability of a company to return cash to shareholders via dividends, stock buybacks, debt reduction, and/or or projects that will generate huge cash flow in the near future in order to reward shareholders through the first three actions.
I call this model “Show us the money.”
The more we can pull out of a company through dividends, buybacks, or return of capital, the lower our risk over time. The performance doesn’t vary much whether the market is fairly valued or overvalued. But when the market is priced dear we run the risk of some nail-biting volatility.
Of course, not every high-yielder is a good investment. Often times the yield is high for a reason, such as the stock price has gotten crushed due to horrible operating performance. The market may even be anticipating a dividend cut. Historically, that’s been a kiss of death for a stock’s performance.
Our forensic accounting metrics also analyze the quality of the company’s revenue recognition, cash flow, earnings quality, and asset quality to reduce the risk of stepping into a yield trap.
Owner-Operator Business
In this environment, I’m very focused on owner-operator businesses. I want companies where the founder or management is heavily invested in the business. Our last three stock selections all have founders still involved in the business today.
They are visionaries. They are rich, and they got rich by operating a business successfully. We just want to ride their coattails. This doesn’t mean that investing in these companies is risk-free. There’s no free lunch on Wall Street. But an owner-operator with a big portion of their wealth tied into the performance of the company helps mitigate some risks.
They have a few eggs in a small basket and they’re watching that basket like a hawk. They’re more likely to respond quickly to changes in the market. Because they’re the Big Kahuna, they have the ability to create change quickly to get the business back on track when it hits a bump in the road. If management is just a bunch of bean counters with fancy MBAs, I don’t have as much confidence in their ability to navigate turbulent waters.
Variant Perception
If you know what everyone else knows, you’ll get what everyone else gets, which is underperformance.
It’s important to have a viewpoint different than the market. Then, if your analysis proves correct, there’s upside to your investments as the rest of the market catches on and adjusts.
When I say knowing something that others don’t, I do not mean having inside information. Rather, I mean thinking about a company’s prospects differently than the market — in other words, having a “variant perception.”
The last three selections in Hidden Profits all face big issues or problems. The problems are well known in the market. But our view is that the conventional wisdom with how these companies will overcome their issues and return former glory is all wrong. That there’s potential hidden in places others aren’t looking o don’t quite understand.
If our thesis proves correct, then the upside to our investments is substantially greater than owning the market. We can and will be wrong at times. But, by focusing on companies with good earnings quality, cash flow opportunities, and visionary executives with huge wealth tied to operational performance, we can dramatically put the odds in our favor.
I’m still bringing on new readers at Hidden Profits, and you don’t want to miss out on this next pick.
Till then,
John

The post Finding Hidden Profits in an Overvalued Market appeared first on Economy and Markets.
Ahead of the Yield Curve
Since last Thursday, the yield on the long-term Treasury bond is down by about 10 basis points. Since its recent peak a little over three weeks ago, the yield is off by 16 basis points.
On Friday, though, rates bounced back and have continued moving higher early this week. The deal between the UK and the European Union over Brexit (remember that?) helped drive global yields higher, but, soon after, they moved back to Friday’s closing level of around 3.08%.
Despite the near-certain rate hike this week, investors don’t seem all that worried about the economy overheating or inflation rearing its ugly head.
It’s not just that long-term yields have dropped; the spread between short-term and long-term yields (otherwise known as the yield curve) is flattening as well.
I’ve often noted that a flattening yield curve could signal trouble ahead for the economy, and when long-term yields go lower than short-term yields, or invert, the economy will fall into a recession.
Take a look at the change in the yield curve over the last month alone:

It’s not close to inverting, but it’s definitely getting flatter. That’s worrisome. In fact, every recession since 1955 has been preceded by a negative spread between the 10-year Treasury note and the one-year Treasury bill.
President Trump’s steel and aluminum tariffs seem to be weighing on the markets, and so does recent economic data.
February’s Consumer Price Index (CPI) came in mostly as expected, but bearish bond traders (along with the Federal Reserve) were probably hoping for a surprise to the upside. Year-over-year core inflation (less food and energy) stayed at 1.8%.
Producer (wholesale) prices tend to be a leading indicator of where consumer prices will go. The February Producer Price Index (PPI) moved higher, as expected. Core PPI (less food and energy) moved up to 2.5% on the year and has been tracking above 2% for over a year now. Unfortunately for the Fed, it hasn’t translated into higher consumer inflation… yet.
February retail sales were even more disappointing, falling 0.1% on the month against expectations of a 0.4% rise. Even excluding autos and gas, sales only moved up 0.3% on the expectation of a 0.4% increase.
Last Friday’s February new home starts and permits were also below forecast. These numbers can be volatile from month to month, and January’s numbers were quite strong, so take these numbers with a grain of salt.
Before setting or changing its policy course, the Fed compares its outlook with emerging data and adjusts expectations, forecasts, and/or monetary policy.
Even though we’ve seen rather weak economic data along with subdued inflation and wage growth, the overall picture remains positive, and policy still dictates three rate hikes this year, including this week’s expected hike.
Remember, the Fed’s congressional mandate requires it to provide for maximum employment and stable prices.
Prices have been “stable,” but with 10 years of stimulation and abnormally low interest rates, the Fed hasn’t yet managed to hit its 2% consumer inflation target. And even though employment seems to be healthier today, with unemployment nearing 4%, wages haven’t really picked up yet.
Wages seem to be the missing ingredient to higher inflation, which, the Fed insists, is just around the corner.
So tune in Wednesday afternoon for the Fed’s rate decision and, more importantly, to find out whether its forecast and outlook have changed since the last meeting. Any surprises will surely move the markets!
Until then, you can prepare for and profit from surprises in the financial markets, and specifically in the Treasury bond market, with Treasury Profits Accelerator.
Till next time,

Lance

The post Ahead of the Yield Curve appeared first on Economy and Markets.
Do Stop Losses Stop Losses?
I tend to get a lot of questions about the use of stop-loss orders – both in general and specific to my trading services, Cycle 9 Alert and 10X Profits.
Anytime I’m asked, “Should I use stop-loss orders to protect my position?” my response goes something like this:
It’s up to you. But here’s what I’ll tell you…
If you use a stop-loss order, you should put it far enough away from current prices, as to allow for the market’s “normal” day-to-day volatility. If it’s too “tight,” you get stopped out far too frequently… and you’ll never achieve the system’s total potential return. But, of course, if it’s too “loose,” it won’t really help you all that much at stopping losses.
Realize there’s always a trade-off in using stop-losses. Sometimes it will help you… you’ll take a loss, but avoid a larger loss. Other times, though, it’ll work against you… it’ll stop you out at or near the worst of the drawdown, and then you’ll miss out on the recovery rally.
The bottom-line is… if a stop-loss order helps you sleep better at night, do it. But, if you do it, choose a well-defined threshold and stick to it with discipline. Don’t adjust your stop up and down based on a whim or your gut feel.
Now, I realize that answer has a bit of a “both-sides-of-the-mouth” quality.
That’s not because I’ve ever wanted to dodge this question. It’s merely because there isn’t a crystal-clear, always-true answer to it.
Like many things in investing, and life, the value of stop-losses lies in the grey area – of “yes and no… sometimes, maybe.”
Distinguished MIT professor Andrew Lo and his Ph.D. student, Kathryn Kaminski, tackled this very question in her 2013 thesis paper, titled, When Do Stop-Loss Rules Stop Losses?
Their conclusion was mixed.
Sometimes stop-losses provide a positive economic value, to some strategy types. Other times, stop-losses are a negative contributor, particularly for some strategy types.
If these guys couldn’t hone in on a clear answer, I’m not sure anyone will be able to.
We can focus on a specific market event, rather than trying to determine whether or not stop-losses are always beneficial.
How about the recent, early-February sell-off…?
I’ve done some analysis using the TradeStops stop-loss tools, which you may be familiar with if you’re a TradeStops member, or if you follow any of Charles Sizemore’s portfolios (he uses TradeStops).
Here’s a table of ETFs that track the four major U.S. stock market averages, and their leveraged, “2x” versions, along with their Volatility Quotient (VQ) and whether or not they were stopped out in early February.
Have a look…
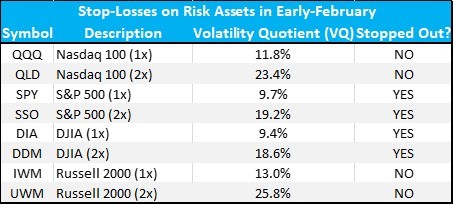
First, notice the Volatility Quotients of these funds.
The “1x” stock funds average a VQ of 11%. This means you’d need to put a stop-loss order at least 11% below current prices to avoid constant whipsaws.
And, as we’d expect, the “2x” stock funds average a VQ that’s roughly twice as high, at 21.8%. This means you’d have to accept a bear-market drop (i.e. more than 20%) before allowing your stop-loss order to (potentially) stop the losses.
This balance between stop-losses that are too “tight” and too “loose” is tricky… and it’s the conundrum I was talking about in my answer above.
Next, let’s consider the interplay between each of the four major stock market indices and their respective, volatility-sized stop-losses in early-February.
The S&P 500 and the Dow Jones Industrial Average fell far enough to get stopped out. That was true for both the 1x and 2x versions, including SPY, SSO, DIA, and DDM.
On the other hand, the Nasdaq 100 and the Russell 2000 did not ever drop low enough to trigger their stops. Again, that was true for both the 1x and 2x versions, including QQQ, QLD, IWM, and UWM.
Now, since these markets have rebounded… you would have found yourself better off if:
You were in QQQ, QLD, IWM, or UWM.
Or…
You weren’t using stop-losses at all.
It won’t always work this way, of course. Had these markets not rebounded by now, we’d have reached a nearly-opposite conclusion. This is all because of the “yes, no… maybe, sometimes” nature of the value of stop-losses.
Of course, stop-losses do have their time and place. But when it comes to options… and other rather volatile vehicles, like leveraged “2x” stock ETFs, there are better ways to manage risk than with stop-losses.
Prudent position-sizing is one of them. And, related to the idea of not putting too many eggs in one basket, diversification is a great way to protect against outsized losses.
Consider the study above, where we saw two U.S. stock indices would have been stopped out in early-February (SPY and DIA, and their 2x funds)… while the other two were not stopped out (QQQ and IWM, and their 2x funds).
This shows clearly that, even though most stock indices move with a healthy degree of “togetherness,” they don’t make identical moves. Investors’ preference for different “flavors” of stocks – from large-cap to small-cap, and tech-heavy to industrial-heavy – can either work for you or against you… if you’re overly concentrated in one index or another.
Diversifying across a reasonable number of risk-on markets is a useful way to limit the risk of loss in any one market, should it be hit particularly hard by an unforeseeable event.
The bottom-line is… while stop-losses promise, via their very name, to give you want you want in times of trouble (you’re yelling: “STOP THE LOSSES!”)… in reality, they don’t always do so!
Tactics like prudent position-sizing and diversification are, in my eyes, better solutions for limiting losses.

Adam O’Dell
Editor, Cycle 9 Alert
Follow me on Twitter @InvestWithAdam

The post Do Stop Losses Stop Losses? appeared first on Economy and Markets.


