
Harry S. Dent Jr.'s Blog, page 54
April 24, 2018
How Broke Is Your Town?
I never understood that old saw, “What you don’t know can’t hurt you.” Of course it can. If I don’t know someone is about to clobber me with a baseball bat, it’s still going to hurt when I get smacked.
Even if I’m not aware that someone is spreading disparaging information about me at work, it can still hurt my reputation, advancement prospects, and income (not that I’m paranoid).
That’s why we work hard to know what’s going on around us. We pay attention to our surroundings walking down the street, and we typically have our antenna up at work. We also do our best to make informed decisions when shopping by comparing prices online.
But what about the government? What about the amorphous blob that you send money to that provides services, but you’re not sure exactly how the numbers work?
I’m not talking about the federal government. That one’s easy. Just under half of Americans pay no federal tax at all (not including FICA), so there’s no kicking into the kitty. And as for how Congress spends it, well, there are plenty of websites that dive into that in great detail.
But what about where you live? What about your town? Do you know the financial health of that hamlet or metropolis?
Almost all political decisions that affect your life are made at the local level, and yet most people can’t name the members of their city council, much less their county officials or state reps. These are the people that hold the greatest sway in determining how much you have to pony up every year, and what kind of services you’ll get in return.
I’ve got news for you. It’s getting ugly. And it’s all about pensions.
Don’t get lost in the weeds. One Oregon state retiree gets $76,000… per month. That’s unusual. The state retirement system is woefully underfunded. That’s not unusual. But guess what? So are many city retirement funds.
And then there are teacher retirement funds, county retirement funds, and even elected official retirement funds. Almost all of them are bleeding money. And they have one other thing in common. They are backed by you, the taxpayer.
Don’t expect a bunch of guys in black trench coats to come to your door demanding your jewelry and emergency cash to pay the liabilities.
They’ll take something from you, but it will be more subtle than that. They will take, or squeeze, your standard of living, by raising taxes and lowering services. It’s already happening.
Take Phoenix, for example. The city has an ongoing issue with city pensions for employees and public safety workers. The city’s payments to the state public safety pension exploded from $56 million in 2007 to $207 million this year, a 270% increase.
To make ends meet, Phoenix has increased taxes over the last several years, including adding a fee to water bills and raising property taxes, and has slashed city services, like closing municipal swimming pools. The city council has to make hard choices this year, which could include closing senior centers, libraries, and a lot of other things, simply to pay for growing pension costs.
Phoenix is not an outlier. It’s not a poster child. It’s simply one example of what is happening around the country.
And to make it worse, we’ve come to this point during what is about to be the longest bull market in U.S. history, something Charles plans to talk more about in his free presentation tomorrow, in fact.
If these cities, counties, states, and other entities can’t fund their pensions through contributions and investment growth in the best of times, what happens when the markets roll over, and yet pension liabilities continue to grow?
That’s right. They’ll come looking for me and you. Raising taxes and fees, while cutting services.
There’s no question that this will happen, it’s just a matter of when, and how much pain will be spread in your town.
So, I’ve got a question. Do you know?
Do you have a sense of how your city, county, and state will pay what it owes to government retirees? Have they raised taxes and fees as well as cut services?
Drop me a line at economyandmarkets@dentresearch.com and let me know. I’d love to hear how things are going in your town.


The post How Broke Is Your Town? appeared first on Economy and Markets.


April 23, 2018
Where to Next for Bitcoin?
So, what do you think will happen from here with bitcoin?
We’ve already seen a massive crash, and the cryptocurrency seems stuck around the $8,000 mark, after reaching $6,630 recently.
But I don’t think this crash is done. I expect we’ll see bitcoin ultimately lose well over 90% of its value before rallying again longer term.
Then it’ll be the buy of the century… just like the internet stocks were in late 2002 after a similar, dramatic 16-month bubble and then a 93% crash.
I know this because I’ve studied ALL the great bubbles throughout modern history.
The first was the Dutch Tulip bubble in 1636. It was based on the first futures markets in agriculture, and tulips were the glory hound.
Stocks emerged with the first trading company, the East India Company in England, which started trading publicly in 1612. It wasn’t long before the South Seas Company emerged and became the first great stock bubble in history (1711 to 1720).
And there was the Mississippi Land Company in France, which fueled a greater bubble because it was powered by the first central bank. The bank was John Law’s solution to paying off the huge debts from wars with England. Basically, France offered low-cost financing from the government for “swamp land” in America.
There have been many major bubbles in history. This chart below shows the most B.S., and hence the most extreme, ones.
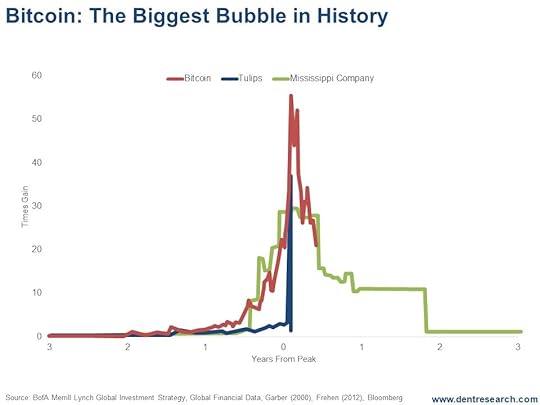
As you can see, bitcoin is the biggest of the lot!
The 1920s bubble in the U.S., the 1980s bubble in Japan, the 1990s bubble in tech stocks, and even the gold bubble into 2011… were based on strong fundamental trends that were exaggerated by investors’ “animal spirits.”
But the Tulip, South Seas, Mississippi, and now bitcoin bubbles were ALL largely just B.S. They had little by way of fundamentals backing them. That’s what made them the most extreme in history.
At its peak, the bitcoin and cryptocurrencies bubble surpassed even the infamous tulip bubble.
Interestingly, the bitcoin bubble seems to be following the same path as the Mississippi Bubble. In the former, investors clambered after shares in unseen American swamp land. In the latter, investors are buying unseen bits and bytes up in droves!
If bitcoin continues to walk a similar path, we could see it drop to around $3,000 later this year and as low as $800 per coin down the road.
It’s not all bad though…
Bitcoin is an early indicator for a major surge ahead in blockchain technologies… which are real and should grow dramatically into at least 2036, on an 18-year lag of the early internet bubble into 2000.
This industry is going to be forced to go to “security” tokens, or regulated investments in companies.
Then it will be real.
When that happens, most companies won’t pass muster!
That’s when you swoop in and buy the surviving companies, like Ethereum, that have real block chain applications.
The opportunity here is not on the upside, but the downside… as blockchain technologies will make the internet cheaper, faster – and most importantly – more secure!
Blockchain is the answer to the limitations of the internet.
But bitcoin and most cryptocurrencies are B.S., as investors have no interest in the company and its future profits. It’s a way to raise money at low costs and no regulations.
For now, bet on the dollar – the best house in a bad neighborhood – and then wait to pounce on the opportunities coming our way.

Harry
Follow Me on Twitter @harrydentjr

The post Where to Next for Bitcoin? appeared first on Economy and Markets.
April 20, 2018
Something Big is Coming That Will Help the Crypto Industry
In March, I was the keynote speaker for the CoinAgenda Caribbean conference in my home town of San Juan, Puerto Rico. While there, Gregg Greenberg of SCN Corporate Connect sat me down for a brief interview.
He started off by asking what a guy like me was doing at a conference like that. My answer was that, by my model, the internet has grown about as much as it can in its current form and it’s now running up against so many security problems that it’s becoming burdensome to keep up with passwords and security questions for logins.
Blockchain can solve that and has many more applications for making transactions cheaper, faster and more secure.
And it was primarily my interest in the blockchain stuff that drove me to speak at the conference.
But, as I told Gregg, there’s something else, something that’s coming much sooner, that’s going to help this industry, and also shake out the companies that don’t have the real blockchain solutions.
Listen to the interview now to find out what that something is…

Harry
Follow Me on Twitter @harrydentjr

The post Something Big is Coming That Will Help the Crypto Industry appeared first on Economy and Markets.
April 19, 2018
Real Estate Storm Warning Upgraded to Severe
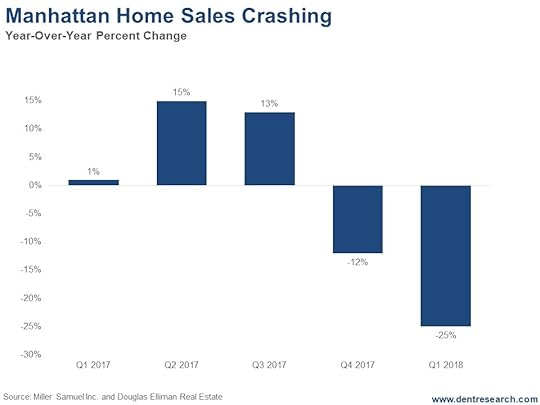
Manhattan has seen real estate sales fall 40% since the second quarter of 2017, with prices falling the most on the high-end. New condo listings are down 54% and existing condo listings are down 18%.
Toronto has seen a similar 39.5% decline in sales over the last year, with prices down 14% and falling. The average house price there is down from $915,000 to $785,000. That’s a big haircut. (I’m speaking there in early May and will see some friends and see how they are faring. I’ll let you know what I find out from those on the ground.)
London real estate prices have fallen 2.6% year-over-year, with prices in high-end areas like Wandsworth down 14.9%.
Miami now has an overhang of supply of about four years for luxury condos in Miami Beach, Bal Harbor, and Sunny Isles… and more than six years in the downtown Miami/Brickell area. (Basically, there are far more people wanting to sell than buy!)
The last time my wife and I were there, we saw more cranes than we saw in Dubai in 2006 before it’s great bust.
All of these signs point to the beginning of the end of this real estate bubble.
Prices are still edging up in California, especially San Francisco, but teachers there are staying in dorm rooms to survive.
Vancouver is still edging up despite stiff foreign-buyer taxes that goosed the Toronto market at first, but is now collapsing.
If you’re living in these late stage, still booming bubble markets, from L.A. to Denver, Seattle to Boston, get out now!
I’m upgrading my real estate storm warning to “severe.”
Harry
Follow Me on Twitter @harrydentjr

The post Real Estate Storm Warning Upgraded to Severe appeared first on Economy and Markets.
April 18, 2018
Ditch Your Tax Bill With This Overlooked Part of the Market
Tax season was a little more painful than usual this year.
I sold some stock positions that I’d held for years and that had accumulated large capital gains. So, when I filed my tax return, I had to write a very large check I didn’t want to write.
I know I shouldn’t complain. After all, if I’m paying taxes, that means I’m making money. But it can still come as a kick to the teeth to give Uncle Sam his cut.
I’ve made no secret of my visceral hatred of paying taxes. As I’ve written before, in my 20s I was known to skip meals to free up cash to dump into my 401(k) plan and lower my tax bill.
Thankfully, I don’t have to go to those lengths anymore. But I’m still fanatical about using every legally available loophole I can to lower my tax bill (see “Here’s a Few Ways to Stick it to the Tax Man”).
It’s never too early to start planning for the next tax year, and today I’m going to share with you one of my very favorite ways to earn a tax-free buck via closed-end municipal bond funds.
If you unfamiliar with closed-end funds (CEFs), they are a type of mutual fund that trades on the New York Stock Exchange. But unlike that other type of mutual fund that trades in the public exchanges – ETFs – CEFs don’t generally track an index.
And also unlike ETFs, CEF shares generally cannot be created or destroyed by large institutional investors. As a result, CEF market prices will often deviate wildly from the value of their underlying portfolios.
This is precisely what makes them so much fun. If you’re patient and wait for your opportunities, you can often buy a dollar’s worth of quality assets for 90 cents or less. This is precisely the case today in the muni CEF market.
Many of the largest and most liquid muni CEFs are trading at 10% to 12% discounts to net asset value (NAV).
The return you get in a CEF comes from three possible sources:
The current yield. CEFs tend to be income-focused and pay high yields. Today, yields of 5% to 6% are common among muni funds. And remember, that yield is tax-free!
Appreciation in the underlying portfolio. Like any mutual fund, CEFs hold marketable securities like stocks and bonds. When the value of those assets rise, the net asset value of the fund rises too.
Changes in the discount or premium to NAV. This is where it gets fun. CEFs normally trade at modest discounts to NAV. But sometimes, investors get irrationally scared and push the share prices lower, which widens the discount to NAV to abnormally high levels. This creates fantastic opportunities for prices to “snap back” to more typical discounts to NAV.
So, how do muni CEFs as a sector stack up today?
The current yield is easy enough to understand. Most muni CEFs pay in the ballpark of a 5% to 6% dividend at current prices. But if you’re in the 32% tax bracket, that 5% to 6% yield is the equivalent of a taxable 7.4% to 8.8%.
These are conservative muni bonds issued by state and local governments. You’re not going to find a yield anywhere close to that high anywhere else, at least not without taking a lot more risk.
I have milder expectations for appreciation of the bond portfolios. I think it’s likely bond yields drift lower from current levels, but I don’t see that adding more than a couple percent to returns.
Now, the change in the discount to NAV is where the kicker comes in. If recent history is any guide, the 10% to 12% discounts available today should shrink to 3% to 4% as yield-starved investors trickle back into the sector.
So, between the 7.4% to 8.8% in tax-equivalent yield, a percent or two from portfolio appreciation, and another 7% to 8% from a shrinkage in the discount to NAV… you’re looking at the potential for returns of close to 20% over the next year or so. That’s not too shabby for boring muni bonds.
Out of fairness to my paying subscribers, I can’t share with you the names of the specific muni CEFs I recommend in my income-based newsletter, Peak Income. But if you’re looking for solid returns that won’t leave you with a large tax bill, I recommend you give the sector, and my service, a deeper look.

The post Ditch Your Tax Bill With This Overlooked Part of the Market appeared first on Economy and Markets.
The Earnings Mirage
Earnings season is underway, and the path to quick profits (or losses) is right in front of us.
Expectations are high because of tax reform and solid trends in earnings growth. Sales are trending up, and operating profits are on the rebound. Meanwhile, profit margins are high, with Wall Street analysts projecting more of the same.
All this should propel the market higher.
However, there’s a disconnect between the market and the typical company.
Government statistics compiled from all corporations show that not only did profit margins peak years ago, but that the trend has deteriorated further over the last 12 months.
The differences likely come down to one thing that public companies can do that private companies can’t that can make a big impact on its profits.
That one thing? Buying back stock.
When companies buy back stock or pay a dividend, it’s called “shareholder yield.” Returning capital to shareholders is great, right? Possibly, but…
Not all shareholder yield is created equal.
At Hidden Profits, I focus on a version of my forensic accounting stock tracker called “Show Me the Money.”
I overweight the shareholder-yield component while also keeping the earnings-quality factors in the model so that, when I make a stock recommendation to my readers, we can have more confidence that management isn’t pulling the wool over our eyes by returning capital to shareholders.
IBM (NYSE: IBM) is a great example of a company that loaded up with tens of billions in debt to buy back stock and dish out dividends. Meanwhile, revenues were slowing (down quarter after quarter for about five years), and cash flow performance was dismal.
Propping up earnings by buying back stock is not good shareholder yield. While we can simply avoid investing in specific companies that do this, what’s scary is the market as a whole is flashing a huge red flag… marked “shareholder yield.”
Companies are using their tax windfalls to goose the numbers. Financial engineering is reaching new heights. In the past five years, companies have spent $4.9 trillion in mergers and share repurchases. In the first quarter of 2018, that trend actually accelerated, with $305 billion spent on takeovers and buybacks.
This has been going on for a while. When it ends, it will expose the market for what it is: financially engineered without sustainable profits to support stock prices.
Look out below.

The post The Earnings Mirage appeared first on Economy and Markets.
Threats and Reality
The data always matters.
Two weeks ago, the markets were swayed by more talk of a trade war with China. I should clarify by saying that the stock market was shaken, since the Treasury bond market reaction was fairly tempered.
By Tuesday, most of the losses were recouped, and stocks were higher on Wednesday and again on Thursday.
More saber-rattling over trade wars fueled a 2%-plus selloff to close out the week. Like many of my colleagues, I’m starting to get tired of the non-stop market volatility.
And yet it continues.
Last week started with an FBI raid on President Trump’s personal lawyer’s office. Wednesday, Trump tweeted about a possible attack on Syria in response to its government’s alleged chemical attack on its own citizens – and the stock market faltered again.
It was all was forgotten by Thursday, as stocks surged once more. Stocks were comfortably in the green at the end of last week.
All of this “risk on, risk off” back and forth is enough to make your head spin!
As I mentioned earlier, even though stocks gyrated like crazy, Treasury bonds were fairly tame. Take a look at a chart of the 30-year Treasury bond:
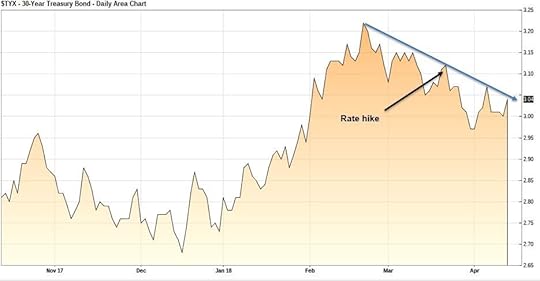
The blue line defines the current downtrend for yields. Interestingly, long-term Treasury yields are still lower than they were when the Federal Reserve hiked rates last month.
But forget all the chatter that’s caused such angst in the equity markets.
If you want to get a true pulse of the market, just look at the Treasury space. Sure, Treasury bonds will move when trading capital moves in and out of risk assets like stocks into the safety of bonds. But, recently – as you can see in the chart – Treasury yields were pretty steady during all of the recent volatility in stocks.
When long-term bonds fall while short-term bonds rise, that’s an indication that investors don’t really believe inflation is a big risk yet, or maybe that the economic outlook isn’t that rosy.
Here’s what the economy is looking like right now…
Inflation data for March was released last week, and the Producer Price Index (PPI) actually hit 3% on a year-over-year basis. PPI less food and energy, or core prices, exceeded expectations and moved up 0.3% on the month and up to 2.7% on the year, which was a seven-year high.
Producer prices are often more volatile than consumer prices but are considered a leading indicator of what’s to come in consumer prices. Producer prices have trended higher over the last two years, while consumer prices haven’t moved much.
The Consumer Price Index (CPI) was also released last week, and, as expected, it didn’t raise any eyebrows. The headline number was down 0.1%, but core inflation was up 0.2%. The annual rate ticked up to 2.1%.
The Fed’s preferred inflation gauge, the PCE Price Index, which will be released at the end of the month. The PCE is still tracking well below 2% on the year.
Fed Chair Jay Powell mentioned in a recent speech that inflation may rise “notably” in the spring. I think I’ll wait for the evidence before taking his comments too seriously.
Until then, you can prepare for and profit from surprises in the financial markets, and specifically in the Treasury bond market, with Treasury Profits Accelerator.

The post Threats and Reality appeared first on Economy and Markets.
April 17, 2018
How to Make Taxes Better Again
Last year, I moved to a very small town in Texas. It’s an island… literally.
This little slice of paradise has roughly 1,458 residents, per the 2016 U.S. Census estimate.
We have our own police force, with SUVs, cruisers, a big-wheeled 4×4, two jet skis, and a boat.
We also have a well-worn public clubhouse, where we hold city council meetings twice a month.
Typically, these meetings draw 20 to 30 residents, but can sometimes swell to 70 or 80 people. That might not sound like much but, as a percentage, our little town regularly draws between one and five percent of the population to government meetings.
To match our numbers, a moderately-sized town of 250,000 would have to attract 2,500 to 10,000 per meeting, and cities with one million people would need between 10,000 and 50,000 in attendance. From that perspective, we are very well-informed.
And we definitely have our fingers on the pulse of government.
At a meeting not long ago, a representative proposed a motion that would ban alcohol from town meetings, presumably for both participants and spectators.
On a spit of land surrounded by sailboats that counts golf carts as the main form of transportation, where open containers are viewed as a sign of hospitality instead of vice, the suggestion was treasonous. The representative was voted down, and then voted out of office.
All of this came to mind as I considered my 2017 tax bill.
I’ve been fortunate. I’m not wealthy, but I make a good living, and so my tax bill is significant. That makes the fact that I have so little say in how it is spent all the more troubling.
In my little town I know where the money goes. I know who is controlling the dollars. The representatives know me on sight, even if not all of them know my name. I’ve asked questions and offered suggestions.
This is not possible at the federal level.
When I write comments and suggestions to federal legislators, I invariably get back form letters telling me how hard they are working on my behalf. Right.
In 1790, we had one representative in Congress for every 50,000 people. This ratio remained constant until the mid-1800s even as our population exploded. Then it marched higher to about one representative for every 175,000 in 1873.
In the early 1900s, with the ratio at 1-to-200,000, Congress passed a law limiting the House of Representatives to 435 members. There’s nothing special about that number of reps. Maybe it’s the number of seats in the House. I don’t know. But we now have one representative for every 737,000 people.
Our representatives do not, and cannot, know us.
To get back to the level of representation we had in 1800, we’d need 6,400 representatives. To reach the level of 1900, we’d need 1,600 reps. Even then, I’m not sure it would do the trick. We’d still be widely separated from how these people spend our cash in Washington.
Even though I think I pay too much in taxes, I know that Americans enjoy some of the lowest tax rates among developed nations.
But the problem isn’t how much we pay, it’s what we spend it on.
I pay too little taxes toward what I want (better education, roads, contract enforcement) and too much in taxes toward things I don’t want (burdensome regulations and bloated government agencies come to mind).
The only way to separate the two is to shrink the size of the government I must support.
So, on this tax day, I humbly suggest we split the nation, re-creating the federal system that we used to have, and develop an encompassing structure for defense and trade. That might sound familiar.
Instead of touching the political tar baby and getting stuck in red/blue or left/right arguments about borders, I’ll stick with economic lines we’ve already drawn.
We can use the territories served by the 12 federal reserve banks as the starting point.
The Dallas Federal Reserve Bank serves Texas, Southern New Mexico, and Northern Louisiana. That’d make an acceptable mini-nation.
The Federal Reserve Bank of Kansas City, Missouri serves five states plus parts of two others in the middle of the country. That sounds about right.
The New York Fed serves just New York. I’m sure they wouldn’t have it any other way.
The structure would loosely approximate the European Union, but we all speak the same language and, except for one unfortunate incident 150 years ago, don’t have a history of war, which should make things easier.
I don’t expect this proposal to go anywhere. The required approval goes through the centers of power that support the people who benefit from the current system.
They get my tax dollars, don’t know who I am, don’t care what I think, and yet control significant portions of my future and wealth.
I’m left with just one remedy. Getting involved.
I go to those city council meetings. I vote in off-cycle elections. I try to figure out who is running for what, and where they stand on issues.
This is harder than it sounds, particularly when it comes to school boards and county positions. And then I do my best, again with votes, to keep a lid on federal taxes and programs, where my representation is the smallest and the farthest away.
None of this is much consolation on tax day, but it’s the best I can do. And at least I can still have a cocktail while listening to debates at my local city council meeting.

The post How to Make Taxes Better Again appeared first on Economy and Markets.
April 16, 2018
To Roth or Not to Roth? That Is the Tax-Planning Question
With the tax-filing deadline tomorrow, you’ve likely already filed your income taxes for 2017. Hopefully you planned well and you have a nice refund coming your way.
I know this might seem odd coming from a legendary cheapskate like myself, but if you have decent-sized refund coming your way, don’t feel compelled to save and invest all of it. You can splurge at least a little on something frivolous or fun.
If nothing else, take your family to a nice steakhouse. You have to enjoy your money from time to time to remind yourself why you’re working so hard to make it.
But once you’ve had your fun, it’s time to start planning for 2018.
Along those lines, take a look at your current retirement plan elections and specifically the split between traditional tax-deferred 401(k) contributions and Roth contributions. Because if it’s been a few years since you’ve looked at it, your old election might not longer make a lot of sense.
I met a friend of mine back in December at our favorite watering hole for a pitcher of Shiner Bock and a game of Golden Tee. (Don’t judge me. Golden Tee is therapeutic and a welcome distraction from the market.) Somewhere around the ninth hole, he commented that he had maxed out his Roth 401(k) for the year and that he was proud of himself.
Well, he should be proud of himself. That’s an accomplishment. But given that he and his wife together earn enough to place them in the 39.6% tax bracket in 2017 (32% in 2018), it’s not the best financial move. He should have maxed out a Traditional 401(k) rather than a Roth.
Standard financial advice would tell you that the Roth is always a better option. But that simply isn’t true. Yes, the Roth can be better, and for many investors it probably is. But if you’re in a high tax bracket, it’s a terrible idea.
In a Roth 401(k) you get no tax deduction in the year you contribute, but your investments grow tax free, and you’ll never pay taxes when you withdraw the money in retirement. That’s fantastic. And if you’re in one of the lower tax brackets (say, 12% or lower), the current-year deduction, while nice, isn’t really worth all that much.
But what if you’re paying 32% or more? The 401(k) tax break is saving you some serious money.
This is my rule of thumb: If you’re young, fresh out of school, or have a modest income, you’re probably better off going with the Roth option. You’ll likely be earning more in the future (and thus be in a higher bracket) than you are today. So, it’s better to save the tax break for then.
If you’re further along in your career and earn a high income, go with the Traditional 401(k). A bird in hand is worth two in the bush. The tax break is useful to you today, whereas the benefit of the Roth won’t be noticed for decades, and by then it’s entirely possible that Congress will have moved the goalposts on you by changing the tax laws.
We don’t know if the government will honor its promises in the future. But we do know what rates look like today and the potential tax savings of stuffing cash into a Traditional 401(k).
Putting specific numbers to it, at the 22% income tax bracket (income of $38,701 to $82,500 for individuals and $77,401 to $165,000 for married couples filing jointly) I would personally start favoring traditional contributions over Roth contributions. A 22% tax break today is real money.
If you’re undecided or feel like you’re somewhere in the middle, you can always split the difference, putting a slice of your paycheck into both the Traditional and Roth 401(k) options.
Oh, and by the way. We’re now more that a quarter of the way through 2018. So if you’re going to max out your 401(k) plan for the year at $18,500, you should have contributed close to $5,000 by now. If you haven’t… get on it while you still have time!

The post To Roth or Not to Roth? That Is the Tax-Planning Question appeared first on Economy and Markets.
April 14, 2018
4 Triggers for the Next Real Estate Collapse
Did you see the recent Bloomberg article about how Manhattan home sales have tumbled the most since 2009?
How about Thursday’s Washington Post article about how new D.C.-area real estate firms have started offering sellers a commission (rather than expecting them to pay one)?
Or the one from CNBC on Wednesday about how mortgage application volume was 5.5% lower last week, from one year ago?
Maybe you saw these two charts, posted on the Wall Street Journal’s The Daily Shot blog, showing that analysts’ views of the U.S. housing market have shifted to the downside…

All of it echoes what Harry’s been warning for a while. In fact, he recently wrote an eBook called Real Estate Doomsday: How to Protect and Grow Your Wealth During the Greatest Real Estate Crash in History.
And we’ve created an infographic to give you a quick glance at what Harry sees as the four triggers for the next real estate crash. Take a look now, then come back to see what else we talked about this week in Economy & Markets…

Harry
Follow Me on Twitter @harrydentjr

The post 4 Triggers for the Next Real Estate Collapse appeared first on Economy and Markets.


