
Harry S. Dent Jr.'s Blog, page 50
June 18, 2018
The Coming Economic Armageddon
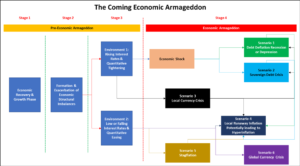
When on tour in Australia last February, I met an Australian economist John Adams. He’s been fighting the same bubble blindness and economic risks that I’ve been, and recently wrote a short article titled: “The Six Scenarios Defining the Coming Economic Armageddon.”
I wanted to share that, and comment on it.
And if you’re at all interested in learning more about these scenarios I’m going to touch on, I’d highly recommend reading John Adam’s full article. It’s a timely piece.
Some of these scenarios will hit more locally, and others more globally.
It should be no surprise that I see his first possible scenario – of a debt deflation recession or depression – as potentially the largest and most global. Such a scenario has occurred in more developed countries after major debt and financial asset bubbles.
Previous examples include the deep depression and financial reset of 1835 through 1843, the long off-and-on depression of 1873 through 1896, and the Great Depression of the 1930s. All of which saw deflation in consumer prices and financial assets as the outcome.
This economic “cleansing” scenario is the most painful near term, but is the most productive in the longer term, as it washes out debts and excessive prices that only work against the recovery for consumers and businesses.
The second scenario we’ve already seen with the Greek debt crisis in 2012. The Greece bailout pushed by the ECB didn’t resolve the Greece debt problem, it just allowed funding to keep paying the banks. It didn’t directly help the consumers or businesses, rather it kept the loan payments going for the banks. Iceland’s foreign debt defaults and currency devaluation in 2008 is another example of this in its early stages. It seems highly likely to occur in Italy, and that’ll be the straw that breaks the back of the euro as Italy is too big to fail and too big to bailout. Other countries in southern and eastern Europe are likely to fall into this scenario – within the broader debt depression in Europe.
Iceland’s debt solution (since it wasn’t on the euro) highlights the third scenario. The situation faced was a classic one of defaulting on foreign loans and devaluing their currency to boost exports at the price of three years of roughly 20% inflation to its households and businesses. This strategy worked better for Iceland than Greece’s forced bailouts. The Southeast crisis in 2007 also ended up with foreign debt defaults and the devaluation of their currencies, including South Korea.
While the fourth scenario is rare, and has never been global, Germany is an example of such an event.
After World War I, Germany was the only major developed country to experience hyperinflation. The country was already bankrupt from losing a very costly war, and then the Allies imposed massive reparations. Germany had no choice but to run the printing presses until hyperinflation destroyed its economy. This was just short-sighted economic policies…
It’s currently happening in Venezuela and in Argentina.
Another example is Zimbabwe during the late 1990s.
This could continue to occur in a few other emerging countries, but we’re in a deflationary era overall. It’s not likely to happen globally on any significant scale.
The fifth scenario is stagflation. We saw this from the late 1960s into the late 1970s. That was the largest “summer/inflationary” season in modern history by our best summary economic model, and will not repeat globally in the coming years or decades, again as we are in the winter/deflationary stage from 2008 into around 2023.
Scenario six is a global currency crisis that would require global hyperinflation to wipe out most major currencies.
Again, this isn’t going to happen within our current timeframe. Although, I do see most currencies devaluing against the U.S. dollar, which is the best house in a bad neighborhood and will tend to be the safe haven, along with its Treasury bonds when the global debt deleveraging process sets in like it initially did in late 2008.
This would be most like 1971 (off the gold standard) and 1913, when there were major reforms to the system including the creation of the Federal Reserve to prevent future volatility in the economy and markets. It’s natural to want to stimulate the economy and not allow recessions to set in, which only led to the Roaring Twenties debt bubble and the Great Depression, as mentioned above regarding the first scenario.
A new standard for regulating sovereign money and debt creation and/or new bottoms-up cryptocurrencies could be a solution down the road to come out of the deflationary debt deleveraging crisis, which I see as most likely to occur.
One of my greatest fears is that developed countries will follow Japan and choose a variant of the first scenario: “stagdeflation.”
You keep stimulating enough to hold off a debt deleveraging crisis, but at the expense of limiting any significant growth down the road as you don’t clear the unproductive debt and pricing monopolies that hinder expansion again.
It’s a flat-line economy with zero or low growth, and zero or very low long-term inflation.
And I fear that, like Japan, many affluent and more developed countries may not have the stomach to embrace deleveraging.
Our Australian subscribers won’t have to worry about that scenario with the strong demographic trends ahead.

Harry
Follow Me on Twitter @harrydentjr

The post The Coming Economic Armageddon appeared first on Economy and Markets.


June 15, 2018
What Happens When North Meets South…
If you haven’t heard about it yet, I’m not sure what you’ve been doing. It’s been all over the headlines, and reporters can’t seem to get enough of it.
On Monday, Donald Trump met with Kim Jong Un during the summit in Singapore.
Despite the insults, the poking and prodding leading up to the summit, and the previous cancellation of an earlier meeting between the two, this meeting went well!
I wasn’t surprised by this outcome. After all, Donald and Kim Jong Un are a lot alike. It wasn’t some Freudian slip when one Fox news anchor referred to them as “the two dictators” when talking about the meeting…
So, now we’ve started developing some sort of relationship with the man who has followed in his father’s footsteps of starving and depriving his people.
And this doesn’t help all of the tension around globalization, and its continual growth. With Trump’s chaotic and unpredictable behavior, it’s hard to say where this will take the U.S. and the rest of the world.
Somehow, though, he’s managed a peaceful outcome (for now).
But this summit raised an even greater question: What will happen to North Korea?
Find out more what I have to say about this summit in my latest video. Click here to watch.
Harry
Follow Me on Twitter @harrydentjr

The post What Happens When North Meets South… appeared first on Economy and Markets.
June 14, 2018
So… What Will the Fed Do Next?
All signs pointed to a quarter-point rate hike coming from the Federal Reserve’s monetary policy arm, the Federal Open Market Committee (FOMC). That’s exactly what we got after its two-day meeting ended yesterday.
The rate hike applies to the overnight federal funds rate that banks pay for borrowing to meet their reserve requirements.
Remember, the Fed’s dual mandate – handed down by Congress in 1977 – is to promote stable prices and maximum employment through monetary policy actions.
In that vein, the Fed assumes that a rate hike will trigger a complex chain of reactions.
These ripples will influence other short-term interest rates, exchange rates, long-term-interest rates, and credit availability. The Fed’s rate decisions can also affect a range of economic variables, including employment, output, and the prices of goods and services.
(Maybe the rate hike will also give us an extra week of vacation? Sheesh.)
That’s a wide array of assumptions and forecasts, all things considered. With a track record as dicey as the Fed’s, I can’t help but see it as overly ambitious…
See, the Fed assumes its rate hikes extend through the “curve” (also called the spectrum) of Treasury debt, from short-term to long-term bond prices. Put another way, the assumption is that an overnight rate hike affects all borrowing costs.
As you can see in the chart below, it doesn’t always work out that way…
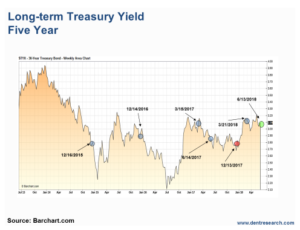
Notice that in the aftermath of five out of six rate hikes since December 2015, long-term Treasury yields actually fell in the weeks and months following the action! (December 2017 was the one exception.)
It’s too early to say how long-term yields will react to yesterday’s move.
Let’s take a look at recent economic data, starting with releases that the Fed monitors closely. The past week and a half has brought a lot of good news…
April personal income was up 0.3%, which was in line with expectations. Consumer spending, on the other hand, doubled the consensus forecast and came in at 0.6%.
The April personal consumption expenditure price (PCE) index, the Fed’s preferred inflation gauge, was up 0.2% month over month. That number held at both the headline level and once food and energy costs were removed. The market had expected 0.1% on the latter reading.
Year-over-year core inflation was up 1.8%, in line with Wall Street’s consensus view.
Spending surprised to the upside, and inflation tracked the market’s expectations.
The good news kept coming in the May jobs report.
The consensus expected a 190,000 increase in monthly non-farm payrolls. It got 223,000. On top of that, the unemployment rate dipped unexpectedly, moving below 3.8%.
Most important, earnings were up 0.3% on the expectation of a 0.2% rise.
One month of data does not make a trend. However, consumer inflation has started to show up in core prices, with wages and spending moving higher.
Fast-forward to the May Consumer Price Index (CPI), which came out on Tuesday. Core CPI (less food and energy) was up 0.2% for the month; on the year, the index was up 2.2%, just above the Fed target of 2%.
Yesterday’s release of the May Producer Price Index (PPI) also came in hot. Prices were up 0.5% on the month, compared to expectations for a 0.3% rise. Core prices were up 0.3% on an expected 0.2% increase.
On top of yesterday’s rate increase, the Fed signaled two more hikes for later this year. That outlook came as a bit of a surprise. If the economy slows, the risk of the U.S. slipping into recession would increase.
I’ll continue to monitor the yield curve, which is the difference between short-term Treasury yields and long-term yields.
If long-term yields fall below short-term yields, our economy will likely fall into recession. In fact, every recession since 1955 has been preceded by a negative spread between the 10-year Treasury note and the one-year Treasury bill.
(The difference between a bond, a note, and a bill is simply the time needed for maturation. A bond matures in 10 to 30 years; a note in two to 10 years; and a bill in a year or less.)
U.S. economic growth likely has peaked, so I see the uptick in inflation as a transitory phenomenon that might hang around for three to six months. Our friends at the Fed have used “transitory” to describe something that lasts a couple of years.
The central bank often uses this qualifier when it talks about a lack of inflation – whatever it takes to put a positive spin on things, right?
If the economy weakens sooner rather than later, inflationary pressures will recede, wage growth will falter, and the Fed probably won’t stick with its plan to hike rates twice more this year.
The upside for my Treasury Profits Accelerator readers is that whenever there’s volatility and uncertainty in the Treasury markets, there’s likely a chance to book some big profits.
Good trading,

Lance

The post So… What Will the Fed Do Next? appeared first on Economy and Markets.
June 13, 2018
How the Elite Took Over
I call it “killing the golden goose.”
David Stockman, a speaker at this year’s Irrational Economic Summit, calls it “the corruption of capitalism.”
Andrew O’Hehir, a contributor for Salon, recently interviewed Yanis Varoufakis about the story behind Greece’s financial crash. He was the prime minister during the height of the Greek crisis, elected in early 2015 in response to the Greece debt default crisis.
And in July of 2015, Varoufakis resigned after the ECB (European Central Bank) and IMF (International Monetary Fund) forced a bailout package that went against what he and his SYRIZA party had promised the Greek people.
The nearly $300 billion record bailout was designed for one purpose: to bail out the banks and financial elites. It combined the worst of free market capitalism austerity with the high taxation of social democracy.
None of the money went towards social programs or infrastructures that could’ve helped the Greek people or the economy.
Instead, it was used to pay back loans to the banks.
The taxpayers of Eurozone countries – like Germany and France – paid to bailout banks that made bad loans.
It’s not that the Greek people, governments, or businesses weren’t to blame for over borrowing and spending. But they got all of the blame and burden for it while the banks got none!
The rise of the financial sector with Alan Greenspan, who constantly goosed the economy with lower interest rates to bail it out every time it slowed down, was the start of it all – beginning with the 1987 crash, then the S&L crisis, then the tech wreck and so on.
The first political takeover happened when the financial elite convinced Bill Clinton to repeal the Glass-Steagall Act in 1994. It was passed in 1933 to prevent another debt bubble and crash like in the Roaring Twenties and the Great Depression. That was just in time to allow the financial sector to create the next great debt and financial asset bubble from 1995, forward.
When things crashed in 2008, the financial elite stepped in – higher ups from Goldman Sachs like Paulson and Geithner – to bailout the financial sector while sacrificing just one financial lamb – Lehman Brothers.
The bailouts were designed to pay back debts on bad loans made by banks so they didn’t go under, not to directly help struggling workers and businesses.
Free market capitalism requires that markets are fair, and losses accrue to those that take the risks in return for higher rewards.
Not anymore!
Democracy is supposed to represent the everyday person. But not when the super-rich take over the political parties.
Through massive donations, they push for who gets elected or not, and for the repeal of unwanted policies, like Glass-Steagall Act. The billionaire Koch brothers alone vetoed Mitt Romney’s run in the Republican primaries back in 2016.
Yet the ultimate hijacking of capitalism came with QE.
Central banks took over the entire pricing mechanisms of the markets through setting both short-term rates (to zero or near zero) and forcing long-term bond rates down by buying the hell out of risk-free government bonds and government-backed mortgage securities. This liquidity and stimulus saved the economy and, more so, the banks.
The risk-free 10-year Treasury bond highly influences the value of corporate bonds, stocks, real estate, the rates on longer term loans, and all other financial assets. Short-term rates directly impact interest rates on short-term loans and savings vehicles.
With the bailouts and massive QE, the banks and financial elite didn’t have to pay for their unprecedented high leverage investing and risky lending. They were bailed out, even though they should’ve had to take major losses, and write-down or restructure loans.
It’s called Chapter 7 in business.
That’s what happened in the Great Depression: A reorganization of debt where the creditors take a cut so the company can survive.
Consumers and businesses suffered, but so did the banks and financial institutions… But not now. Not since the financial elite have taken over democracy and free market capitalism. That’s how you kill the golden goose! Ask Japan. They did it much earlier, from 2000 and onward, as their great debt and financial asset bubble burst came long before ours and Europe’s.
And how much private or public debt has Japan restructured? Virtually none. Where has Japan’s economy gone since then… mostly nowhere. But thank God the damn banks didn’t fail!
So, back to Greece…
Varoufakis wanted to renegotiate with the banks to write down debt and give some real relief to businesses and consumers. But the ECB and IMF insisted upon their plan that only bailed out the banks while businesses and consumers shouldered the burden through massive austerity.
Iceland was a better model. They weren’t on the euro, which gave them the freedom to default on all foreign debts – which were substantial – and devalue their currency to bring exports back up. The expense was three years of 20% or so inflation on consumers and businesses. Iceland shared the pain, along with British and Irish financial institutions. And yes, some financial executives went to jail!
Since those three hard years of financial “detox,” Iceland’s economy has been doing better than most of Europe. The people and businesses won, in the end, because their politicians took the right medicine rather than the easy way out with bailouts and QE to cover over the debts and not deal with them.
Next time around, the financial institutions have to take it on the chin – and deservedly so. They’ve stealthily taken over democracy and capitalism.
And the central banks and governments they hijacked are likely out of ammunition and credibility to protect them this time around if the greatest stimulus experiment in history fails…
Harry
Follow Me on Twitter @harrydentjr

The post How the Elite Took Over appeared first on Economy and Markets.
June 12, 2018
Subprime Car Loans Are Back
General Motors (NYSE: GM) has a plan, and it doesn’t involve electric vehicles.
Sure, the green-mobiles get all the headlines, but they don’t produce a lot of dough. For that, you need to sell a bunch of cars, and for that, you need clients that can get financing.
Enter the new GM credit unit.
In 2010, GM spent $3.5 billion to purchase AmeriCredit, a subprime lending specialist. The unit is now called GM Financial.
But this isn’t the car company’s first go-round with financing.
For those of us with a memory that can reach back before the financial crisis, we remember the monster that ate the company, General Motors Acceptance Corp., or GMAC.
To sell more cars in the 2000s, GMAC consistently reached further down the credit well, financing clients with spottier credit records.
The company moved units, but the loans didn’t stick when the economy rolled over. By that time, GMAC had ventured into other areas, like financing sub-prime mortgages, which also went south.
During the “bankruptcy-but-not-a-bankruptcy,” when the unions got the assets and the bondholders, equity investors, and taxpayers got the shaft, General Motors had to punt GMAC.
To qualify for a big, fat bailout, the financing entity had to become a bank. That’s how Ally Bank started.
I’ve always found it ironic that a bank borne out of such financial shenanigans and bad faith dealings would use advertising that emphasizes trust and doing the right thing, but what do I know?
Back to GM Financial.
Since acquiring AmeriCredit, GM has beefed up the financing arm. The efforts went into overdrive after 2016 when several sub-prime auto lenders hit the skids.
Companies like Summit Financial, Spring Tree Lending, and Pelican Auto Financing, which all specialized in lending to people with a credit score of 620 or less, have gone out of business.
This leaves the auto industry struggling to finance those marginal buyers so the car makers can keep units moving off their lots.
The slowdown in sub-prime lending is a part of the reason auto sales slowed after 2016.
But all of that is history!
GM is counting on GM Financial to bolster sales by offering more lending to poor credit borrowers, enabling them to drive the vehicle of their dreams off the lot, typically with a very high interest rate loan.
The transaction leaves GM smiling from ear to ear, as it makes money on the car and the loan.
The best part of all? Such lending is particularly helpful in a weak economy when traditional lenders tighten their lending standards to avoid losses.
When the economy inevitably rolls over, GM will be perfectly positioned to keep those loans and cars rolling.
Of course, there’s that little issue of repayment.
Today, with unemployment at 3.8% and average hourly earnings up 2.7% for the year, 5.8% of sub-prime loans are at least 60 days overdue. That’s a higher rate than during the financial crisis, when 60-plus days delinquency reached 5.1%.
Maybe there’s a good reason why sub-prime auto lenders are shutting their doors. And perhaps regular banks aren’t crazy when they tighten lending standards in weak economic times.
But hey, that’s not GM’s problem.
The car company has developed an excellent plan to keep things going. And if it needs to issue bonds backed by questionable car loans and then slice them up as derivatives to keep the money rolling in, what’s the worst that could happen?
GM might make cars worth considering again (my wife drives a great 2015 Chevrolet Colorado 4×4), but I’ll keep my distance from its stock.


The post Subprime Car Loans Are Back appeared first on Economy and Markets.
Corporate Profits Are Crushing Wages, and the Tax Cuts Aren’t Helping
There’s no end to the insanity. Our central bankers and politicians are trying to keep this artificial bubble going at all costs.
How shortsighted. How arrogant. How selfish!
These politicians will be roasted in history, not just for creating the greatest bubble ever, but for extending it far beyond any logic.
I said in 2016 that no matter who gets elected, the musical chairs will stop between 2017 and 2020. This current administration will not be re-elected. The Republicans look likely to lose the House, possibly the Senate, and there hasn’t even been a crash or downturn yet.
So, you can see why Trump would want to have extra insurance going into the mid-terms this year, and the presidential election in 2020.
One tax cut that heavily favored business profits, and the top 1% to 10% that tend to own them, was not enough.
We need another one!
I know many of our subscribers own businesses, and we naturally want such tax cuts (including me). Corporations and businesses don’t need any tax cuts, let alone more.
There are a number of reasons we’ve had the greatest income inequality in the last century, and perhaps ever.
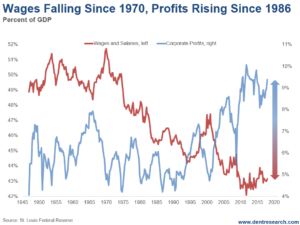
But this is the primary reason: wages and salaries, as a percent of GDP, peaked in 1970 at 51.7% and fell dramatically to 42.1% in late 2011.
They’re currently around 43%.
That’s a fall of 29%. Wages – from 1945 to 1974 – in the last great boom and bust averaged around 50% of GDP. They were more stable and hence no extremes in income inequality or stock crashes greater than 20% happened during the Bob Hope boom from 1942 to 1968.
Corporate profits took a hit in the inflationary 1970s and into the early 1980s. But since 1986, they’ve gone straight up from 4.2% of GDP to 10.1% in late 2011.
They’re still at 9.4% currently. That’s an increase in their share of the economy by 141%.
So, wages go down 29% since 1970, and corporate profits go up 141% since 1986. How do you like them apples?
Trump shrewdly appeals to the most disgruntled workers (and for good reason) by telling them he’s going to “Make America Great Again” – by curbing immigration and bringing good jobs back.
Then his first major policy is to give one of the greatest tax cuts in history to businesses, which are overwhelmingly owned directly or through stock by the top 1% to 10%. They’re the ones who have gotten pretty much all of the wage and wealth gains in the past decades!
It would be one thing if companies were struggling and needed more capacity, yet they don’t.
Capacity utilization has been between 75% and 78% in recent years, but 80% to 85% is more normal. Companies will continue to buy back their stock (a practice that just spiked to new record levels in the first quarter), and create mergers and acquisitions that just rearrange the pie but don’t accrue to everyday workers. More typically, these result in layoffs. That’s what they have, and will again, get most rewarded for.
Thanks, Donald…
Harry
Follow Me on Twitter @harrydentjr

The post Corporate Profits Are Crushing Wages, and the Tax Cuts Aren’t Helping appeared first on Economy and Markets.
June 8, 2018
Real Estate Is Going Nuts
China’s largest cities are so overpriced that migrant workers are going back to the rice paddies – and I predict urban unrest in the years ahead from the younger migrant workers who don’t know how to farm or want to go back. There’s at least 150 million of that group.
In San Francisco, you have people living in cars and taking showers at the office, teachers having to live in dormitories and people renting out single rooms in houses.
In Vancouver, you have a 15% foreign buyer tax plus 12% to 16% on top of that if you flip within one to two years. Prices dropped at first but are now shooting to new highs despite that aggressive policy. You also have 400-foot micro studios with a fold-down bed for $400,000 or more.
In China, they have 66 square feet “closet” apartments. That’s the size of my 7’ X 10” carpet in my home office. A bed, a toilet and sink, a small drawer and closet… basically a jail cell.
In L.A., and more cities like San Francisco and Cleveland, there are increasing renter riots, while rents have just crashed 15% in Chicago.
This just can’t keep going on for much longer.
Learn more in my video below…
Harry
Follow me on Twitter @harrydentjr

The post Real Estate Is Going Nuts appeared first on Economy and Markets.
June 7, 2018
How Much More Money Do You Make Than…?
Finally! I recently came across this great analysis that the OECD (the Organization for Economic Co-operation and Development) did to show how well off workers in different countries are after adjusting for income and entitlement taxes, like social security and health care.
Basically, it measures what people get paid for a fair day’s work.
And we’re not talking average household income here. Household numbers are affected by choices: whether both spouses work full-time, one part-time, or one not work at all… Female participation rates AND the number of kids one chooses all have an effect on per capita numbers.
Looking only at individual incomes gives us the clearest picture we can get (with some caveats, which I’ll discuss in a minute).
Check out this chart from the OECD. It looks at total average wage income, the total tax rate to deduct from that income, then the net average wages.
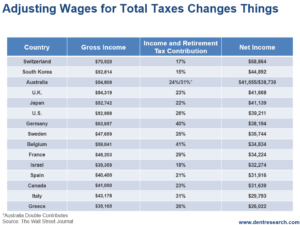
Notice how Australia has an asterisk and double numbers. It doesn’t have social security but instead (and what I believe is a better system) superannuation.
The Oz government requires individuals to place a flat 7% of their annual income into a fund that they manage within rules and guidelines, and use that for their own social security. So, I added that 7% to the total tax rate and reduced the reported numbers in this table by that. Focus on the second net wages and tax rate.
The top four for net wages are Switzerland at $58,864, South Korea at $44,892, U.K. at $41,608 and Japan at $41,139.
Japan’s problem is low overall labor participation rates due to aging slowing its economy and generating lower GDP per capita.
Switzerland has the highest cost of living, which substantially offsets its high gross and net income.
The bottom four are Greece at $26,022, Italy at $29,793, Canada (surprisingly) at $31,639, and Spain at $31,916.
Greece compensates a bit by having the lowest cost of living, as does Spain.
The lowest tax rates, in order, are Korea, Switzerland, Israel, and Japan. Those with the highest are Belgium, Germany, Italy, and Australia (if you count its superannuation at 7%). And keep in mind that in Italy health care is essentially free, even before retirement.
There’s another factor to consider: cost of living. The three most expensive places to live are Switzerland, Australia (due to its housing bubble), and Israel.
Two of the three countries with high costs of living also topped the chart for highest gross and net income. Israel falls short with an average net income of $32,274 per individual while being one of the top for comparative costs of living.
The cheapest three countries to live in are Greece, Spain, and Korea. So, that boosts their real net income a bit.
To sum it up: the countries with the best income, adjusted for taxes and cost of living, for a single worker, in order, are: Korea, Japan, Switzerland, U.S., and Germany (with the U.K. just behind Germany). The worst are: Israel, Italy, Canada, Sweden, and Greece.
In the U.S., we come out well above average, but certainly not on top.
Harry
Follow Me on Twitter @harrydentjr

The post How Much More Money Do You Make Than…? appeared first on Economy and Markets.
June 6, 2018
Tariffs Lead to Trade War
You usually find me sifting through important economic data and analyzing how it’ll affect the Treasury market. That’s my wheelhouse.
We’ll get to that stuff soon, after we talk about the forces (political and otherwise) that moved the markets.
Last week, political volatility at home and abroad left its mark on stocks, commodities, and Treasury bonds.
It started with Italy.
Harry’s been talking about the country’s problems for years. In fact, he wrote about “The European Time Bomb” in last Wednesday’s Economy & Markets.
In short, Italy has massive debt problems…
…to the tune of €350 billion worth of maturities in the next six to eight years. It also has more than €300 billion in non-performing loans, which is more than any other European nation.
It’s no surprise, then, that the recent struggle among the country’s political parties to form a coalition government triggered fears of a default.
Because nothing pairs better with crushing debt than an incompetent government…
A default would likely bankrupt Italy’s social security and pension systems. Public savings and salaries would also be decimated. The global ramifications would be huge.
We got a small taste of that last week, and it wasn’t pleasant.
Here at home, President Trump announced tariffs on steel and aluminum imports from Europe, Mexico, and Canada. These frenemies have retaliatory measures in the works; a trade war is brewing.
This is on top of new tariffs already imposed on China.
Late last week and early this week, the financial world seemed overjoyed about an agreement to form a coalition government in Italy (along with a similar deal in Spain). Stocks and yields bounced higher.
But it remains to be seen how the escalating tariff situation will play out.
Let’s look at the home-grown data.
April personal income increased 0.3% month over month, as expected. Spending, on the other hand, was up 0.6%, doubling the consensus forecast.
The April personal consumption expenditure price index (PCE), the Federal Reserve’s preferred inflation gauge, was up 0.2% month over month at the headline level and if you exclude food and energy. The market expected 0.1% on the latter reading.
Year over year, core inflation was up 1.8%, as expected.
These data points didn’t cause much of a stir in the market.
But Friday morning’s May jobs report surprised to the upside, bigly.
The consensus called for monthly non-farm payrolls to increase by 190,000. Businesses delivered 223,000 new jobs. And the unemployment rate took an unexpected dip, falling below 3.8%.
Most important, earnings were up 0.3%, versus expectations for a 0.2% rise.
One month of data doesn’t make a trend. However, we note that consumer inflation has started to show up in core prices, as wages and spending move higher.
I regard this as a transitory phenomenon. The growing economy has likely peaked, and any inflationary pressures will persist for three to six months.
My definition of transitory differs from the Fed, where officials once used the word to describe a persistent lack of inflation that had lasted for a couple years.
Though unsettling for some, the recent uptick in market volatility .
Other than the political drama here and abroad, there are no major economic reports coming down the pipe for the rest of the week. Stay tuned and stay ready
‘Til next time,
Lance

The post Tariffs Lead to Trade War appeared first on Economy and Markets.
What Rising Oil Prices Mean for Real Estate
I had a finance professor in college who referred to self-evident ideas as BGOs, or blinding glimpses of the obvious.
The term stuck with me, and my kids have heard it their entire lives.
And it came to mind recently when I considered if rising oil prices weighed on the real estate market.
Well, duh!
If consumers pay more for gas, then they won’t be inclined to spend as much on housing!
But as with every BGO, there’s a bit more to it than that, as a recent study from the Brookings Institute points out.
Authors Adele Morris and Helen Neill come back to the age-old real estate wisdom of, “Location, location, location,” and it cuts both ways.
By studying changing home prices in Clark County, Nevada, as gas prices changed, the authors found a statistically significant relationship between the two.
As you might expect, homes that were a significant commute of 24 minutes or more from the city of Las Vegas suffered a price decline of approximately $7,800.
However, homes close to the city center enjoyed a price bump of $5,600.
That showed homebuyers were still willing to shell out for shelter, but they were adapting to higher gas prices by choosing closer neighborhoods.
That conclusion seems straightforward, but you have to read the parameters of the study to gain the biggest insights.
The authors found that many neighborhoods, such as older ones, those with geographic constraints on building, and those with a higher concentration of wealth, didn’t react to changing oil prices.
Apparently desirable, upscale neighborhoods remain attractive no matter what happens with the price of oil.
Also, the effects of higher gas prices were muted in the most recent years, echoing something I’ve written about in Economy & Markets before.
As the authors note, fuel efficiency has improved dramatically over the past 40 years. They point out that fuel efficiency increased by 70% from 1975 to 2010, and I wrote that average fuel efficiency improved from 13.5 miles per gallon in 1972 to 24.5 miles per gallon last year.
Even though we drive about 2,000 more miles per year than we did back then, we spend less on gasoline to cover the longer distance.
Finally, there are some cities that throw parties when the price of gas shoots higher, and I happen to live near one. For obvious reasons, everything is bigger and better in Houston when the price of oil jumps.
Companies pay signing bonuses, everyone wants their logo prominently displayed at charity events, and the Houston Rodeo gets more entries in the barbeque cook off. Needless to say, real estate does pretty good as well.
The good news for America is that more locations are starting to resemble Houston.
As we expand our fracking efforts, deregulate oil exports, and build out our natural gas export infrastructure, cities from Delaware to North Dakota are enjoying economic booms thanks to the energy industry.
This might muddle the picture when we try to determine how rising oil and gas prices affect real estate prices, but that’s OK.
That’s a small price to pay for sending more of our energy dollars to American companies and workers, who then spend those bucks in their local economy.

The post What Rising Oil Prices Mean for Real Estate appeared first on Economy and Markets.


