
Harry S. Dent Jr.'s Blog, page 52
May 21, 2018
New Target for a Top on the Dow
I sent you a video on Friday talking about how markets were finally showing clearer direction.
The dollar has had the clearest break up after trading for months between 88 and 91. That’s put a damper on gold, which may have topped out at $1,375. It’s close to breaking an important support level around $1,270, which could cause a sharp decline.
The 10-year Treasury bonds have also broken above a 30-year downward trend line, just below 3% yields, and have gotten as high as 3.10%. It’s possible this is a signal for a major surge up to as high as 5%.
That would almost surely put a halt to the long bull markets in stocks and real estate.
But the news today is that stocks look like they’re finally breaking out after months of correction. That means we could see one final high in the blow-off channel in place since early 2016.
Trump’s victory and pro-business policies accelerated this channel…
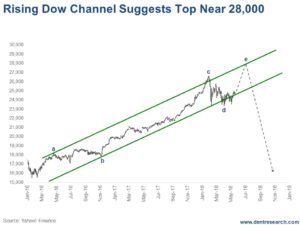
As you can see in this chart, the “a” wave peaked in late April 2016, followed by a “b” wave correction into early November. Then a long “c” wave brought us to a dramatic peak in late January 2018, followed by a bottom in late March.
That peak broke above the top trend-line of the channel, looking more like a long-term top.
Then the Dow broke below the bottom trend line in February and March, looking like it might be breaking down.
But it has now held support three times at near 23,500.
As I see it, there should be one more rally, likely shorter, that could take us to somewhere around 27,000 or 28,000 on the Dow by late July or so…
But that should then be it.
So, around July, it would be prudent to be extremely cautious.
The greatest headwind is likely to be a sharp rise in 10-year Treasury yields due to rising inflation and less demand from foreign investors, including China. The rising dollar only exacerbates that key trend.
That’s what I am going to be watching the most ahead.
[Signature]
Harry
Follow me on Twitter @harrydentjr
P.S. This latest rally seems to be on news that the U.S. and China may be walking back from a trade war. That’s great news for individual companies that won’t be as affected by tariffs, but that doesn’t mean everything is right with the investment world. It’s as insane and irrational out there as ever before. Like I said, caution is warranted. I expect we’ll see a major route before long. But, we’ve still got to make money when and where we can, so use this rally into July as an opportunity to explore making new streams of income. There are many ways to do this, which is why we’ve just welcomed Lee Lowell into our Dent Research family. He’s spent a decade figuring out how to add additional income to your bottom line. And you’ll be hearing a lot more from and about him and his discoveries in the coming days, both in Economy & Markets and The Rich Investor. Stay tuned.

The post New Target for a Top on the Dow appeared first on Economy and Markets.


May 18, 2018
If Gold Hits This Target, Run Away!
Stocks are in no-man’s land right now. They can’t seem to make up their mind if they want to sink or fly.
I can’t say the same for the bond market, the dollar, or gold. They’re quite clear about which direction they’re heading.
Bonds have spent the last 40 years bouncing along a very predictable, narrow channel. However, this week, yields broke out of that channel to the upside. This is a significant event that doesn’t bode well for stocks or real estate (as I mentioned on Wednesday).
Of course, Wall Street analysts and I disagree on this one, so I explain why they’re wrong in this week’s video.
I also look at what’s going on with gold and the dollar, whose fates are inextricably intertwined.
The dollar has made a break for it and this has left gold in a world of hurt.
I think we’ve seen the best of gold now, and there’s a line in the sand that I’m watching closely. Stocks can vacillate all they want. If gold breaches that line, run for cover.
You’ll get all the details and more in today’s video. Watch it now.
[Signature]
Harry
Follow Me on Twitter @harrydentjr
https://www.facebook.com/EconomyMarkets/videos/1806433812741134/

The post If Gold Hits This Target, Run Away! appeared first on Economy and Markets.
May 17, 2018
Have Prices and Wages Peaked?
I write about inflation extensively because it directly affects bond prices.
When inflation rises, bond prices fall, and vice-versa. (And, of course, my readers book profits off those price moves via Treasury Profits Accelerator.)
Wholesale (producer) prices usually foreshadow what’s to come in consumer prices. If it costs more to produce a gallon of milk, then you’re probably going to soon pay more for that milk at the store.
Wholesale inflation, which the Producer Price Index (PPI) tracks, bottomed in November 2015, with a 1.6% year-over-year decline.
PPI looks to have topped in December 2017, with a 3.1% year-over-year increase.
Last Tuesday’s release of April PPI showed a slowdown in both the month-over-month and the year-over-year numbers.
PPI was only up 0.1% on the month versus a forecast of 0.3%. Core PPI (excluding food and energy) was up 0.2% on the month, as expected, but it fell to 2.3% on the year. That number was 2.7% just last month.
Consumer inflation, which the Consumer Price Index (CPI) tracks, bottomed in January 2015 at 0.2% and stayed there until September of that year before a nearly two-year march to 2.75% by February 2017.
Core CPI was much lower than the headline number, and it’s been steadier, seeing as it’s tracked just above or below 2% over the last four years.
Last Wednesday’s release of the April CPI also showed a slowdown in inflation.
The month-over-month CPI was up 0.2% against a 0.3% forecast. Core CPI was only up 0.1% on the month, while a 0.2% increase was expected. Year-over-year core CPI was up 2.1% on the expectation it would rise to 2.2%
The Bank of England (BOE) surprised the market last week by holding steady on its key benchmark rate. In its statement, it acknowledged that first-quarter growth and inflation surprised to the downside. And forecasts for both were revised lower.
The U.S. Treasury also held a $17 billion 30-year bond auction late last week, which went very well. Yields on the lot fell to 3.13%. The market reacted by buying up long-term Treasury bonds, which pushed yields lower.
The bottom line is that producer prices are cooling off while consumer prices are moving up, albeit more slowly than expected. Inflation was starting to rise throughout Europe, but it may be backing off there as well.
Inflation rises when the economy is getting stronger.
Wages rise when corporate profits move higher.
With such lackluster moves in CPI and PPI, does that mean prices and wages have peaked?
Will the economy continue to grow?
April retail sales suggest “maybe not.”
Consumers certainly aren’t spending the way Wall Street expects them to. The consensus saw a 0.5% increase coming. What it got was 0.3%.
These numbers are extremely important: Retail sales account for about half of all consumer spending. And consumer spending is two-thirds of the U.S. economy.
If it slows down, so will the economy.
There will be no upward pressure on prices, and wages won’t go up.
That’s bad news for everyone.
You can make it better, though, and profitable with Treasury Profits Accelerator.
Good luck out there,

Lance

The post Have Prices and Wages Peaked? appeared first on Economy and Markets.
May 16, 2018
A Bad Sign for Stocks and Real Estate
We’ve been waiting years for our fixed income trade of a decade…
Our target’s at the top of the long-term Treasury Bond Channel near 3% on current 10-year yields. And recently, we advised our Boom & Bust subscribers to buy long-term Treasurys at around 2.99% on the 10-year.
Now we’re thinking it could get better… much better.
Yesterday, we emailed subscribers with instructions to tighten their stop losses on our Trade of the Decade play. If yields break much higher (above 3.15%), then we’ll exit our current position and wait for a much better long-term opportunity.
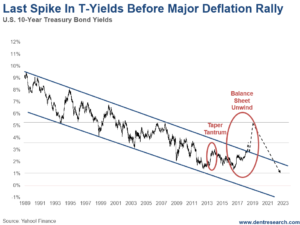
Treasurys are breaking above the best long-term indicator we’ve ever had: the 10-Year Treasury Bond Yield Since 1989.
That’s almost 40 years…
The last low, at 1.38% yields, didn’t quite test the bottom of the channel. But, this first break above the top of this 40-year trend-line is significant. I’ve been forecasting late-stage inflation, as has David Stockman, editor of Deep State Declassified.
If this break out continues, we face the opportunity of buying secure bonds at 5%-plus yields, instead of 3%, then we’ll ride them down towards 1% or lower yields over the next several years, banking higher dividends than stocks
With the 20-year AAA corporate bond and 30-year Treasury bond yields rising, they’ll become increasingly better than stock dividend yields. The bonds have greater safety and appreciation in the asset class, which has proven to do well during times of deflation and debt leveraging. High-quality bonds tend to go up in value and accrue more interest, similarly to cash – which has no yield – but does appreciate dramatically, when everything else goes down.
Just look back at the worst of the 2008 crash when stocks dropped 50%. Gold went down 33%, and silver 50%… while the U.S. dollar went up 27% and Treasury bonds surged, likewise.
Your gut may tell you: Money printing can only be bad, and only end up in inflation.
But that only happens in rare cases, and is NOT happening here.
We’re only printing such unprecedented amounts of money to prevent the greatest deflationary crisis since the Great Depression – when debt gets written off and financial bubbles bursts. That destroys money!
That’s deflationary, not inflationary.
Money printing and artificial stimulus will only make the coming crisis worse!
This bond breakout underway is issuing a stark warning: Get out of passive stock investments and real estate on any near-term rallies… If yields spike, as I expect we’ll see, it’ll send both asset classes into free fall.
Baron Rothschild said that the secret to his wealth was: “He always got out a bit early!”
Be like Baron Rothschild, if you’re not following a proven strategy like those we provide here at Dent Research!

Harry

The post A Bad Sign for Stocks and Real Estate appeared first on Economy and Markets.
May 15, 2018
The Wrong People Are Having All the Sex
We’re definitely not short of sex scandals lately.
Think Stormy Daniels and President Trump.
Or Missouri’s governor, Eric Greitens, and his hairdresser.
Or NBC’s Matt Lauer.
Or all the victims and offenders brought to light through the #MeToo movement.
Without passing judgement or belittling any of it, it seems like there’s so much sex going on that we can’t get away from it.
Yet, the most… ahem… capable among us, our youth, seem to be struggling to get around to it.
That’s a problem. Not just for those youth who haven’t found a partner, but also for the countries they live in.
The social systems in advanced economies share the premise that the youth will support their old-age dependents, through national programs like Social Security and Medicare. For the system to work, it needs a replacement-level supply of children, and then adults, to support its aging citizens.
That replacement level comes out to a little more than two children per woman (2.1 to be precise).
However, it’s recently come to light in the U.K. that 12.5% of its 26-year-olds are still virgins! The number climbs to 17% if you count non-respondents. This assumes that virgins would be too embarrassed to admit their lack of experience.
These numbers more than double (possibly triple) the 5% rate of virginity previous generations have held.
Sex just doesn’t seem to be that big of an attraction for kids these days.
The issue isn’t limited to the Brits…
Last year, researchers found that 31% of Japanese, age 18 to 34, were virgins!
The youth of both countries suffer from high levels of social-alienation anxiety. The U.K. youth cited fears of humiliation and the pressures of the social media. In Japan, some report the trauma of rejection and their retreat to the safety of internet pornography.
This tendency toward prolonged virginity will only hurt the long-running trend of falling births:
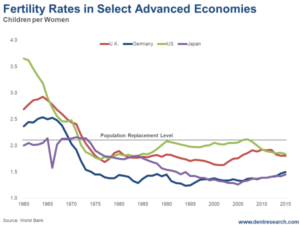
As you can see, the U.S., U.K., Germany and Japan’s fertility has been below replacement levels for decades, long before the outbreak of virgins. Low fertility means less and less people to grow up, get a job, contribute to society, reproduce, and support retirees.
There are a lot of factors that contributed to this dive. There’s birth control, the reduction of teen pregnancy, and the bringing of women into the workforce en mass. None of these developments were bad things. But they’ve undeniably depressed fertility and advanced economies haven’t found a clear way to bring it back.
Sprinkle in the social alienation and fear of rejection now holding young people back and things look bleak.
Still, countries with falling births are looking for creative ways to get people together. Russia offers cash payments for couples with a second child. The 2015 “screw for Denmark” ad campaign launched by the Danes led to a 14% increase in births in 2016.
Money is good motivator and increasing the status level of childbearing women can move the needle.
Another line of thought policymakers hold is to supplement the aging population with younger immigrants.
When German Chancellor Merkel opened her country to over one million Middle Eastern refugees, part of the rationale was economic. The refugees would get jobs, become productive members of society, and support German pensioners.
Japan, on the other hand, doesn’t view immigration the same way. The nation has remained highly restrictive on who it lets in, despite facing an old-age crisis of its own. The graying nation looks to be banking on an automation revolution to make up the slack of missing workers.
Only time will tell which approach is best. In the meantime, nations will push the buttons and pull the levers of public policy to help increase births. Trouble is, these policies just haven’t done enough. But that might be OK…
If there’s one thing I’ve learned over the years working with Harry, Rodney, and the rest of the Dent team, it’s to respect the power of cycles.
Viewing fertility rates as a downward linear trend ignores the cyclical nature of the beast. So much of the data we observe tends to ebb and flow. We’ve been in the ebb phase for a while, and so I expect an increase is on the way. Otherwise, birth rates will trend to zero and humanity will disappear.
I think this unsustainable trend will self-correct over time. If modern civilization is hostile to reproduction, then it’s going to have to change. The fertile will survive and remake society in their image. But before that happens, advanced economies will have to find a way to get through this painful period and support their aging populations.
[Signature]
Dave

The post The Wrong People Are Having All the Sex appeared first on Economy and Markets.
May 14, 2018
People Are Retiring Earlier Than They Plan
People assume that most retire at age 65 or a bit later. Some plan to work later in life or not retire at all. But that turns out to be wishful thinking. Our research has shown that the average retirement age over the last decade is closer to 63, and is currently at 63.5!
The Motley Fool quotes surveys from the Employment Benefit Research Institute (EBRI) that say 39% of people intend to work until age 70 or older. The reality is, only 4% report that they actually do so. And I saw a Census-based survey that reports 21% of people retire at age 70 or after.
That’s still almost half of the ones that intend to, but it may also include more people that didn’t…
Nine-percent of people indicated that they planned to retire before age 60, but 39% of current retirees actually did. The Census-survey said 18% retired before age 60, still far more than intended. That’s what creates a younger average than the “official” age of 65. Just over 40% of retirees did so due to health issues. While 26% did so due to corporate re-organizations that offered early retirement incentives for termination.
For decades I’ve observed the statistics and demographics. Around their early 60s is when many people get their first serious health challenge – like a stroke or heart attack, a cancer diagnosis, dementia or Alzheimer’s, etc…
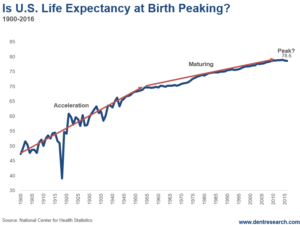
After rising steadily over time, about one and a half years per decade since the surge of four years per decade, which occurred between 1910 and the 1950s, our research has shown that life expectancy has started to stall between ages 78 and 79. That suggests that we are no longer getting healthier. The opioid crisis doesn’t help this. Neither does the inflation-adjusted wage gains, which have been flat or declining since 2000.
Even with longer life expectancies, women tend to outlive men by five years. If you live to be 63, around the average age when a person retires, you’re likely to live to be 84, and one spouse (typically the woman) is more likely to make it to 90 or older.
So, people tend to underestimate how long they’ll live and how big a nest egg they’ll need. And retiring early can cause a gap between your employer health insurance coverage and when you qualify for Medicare/Medicaid, or force you to sign up for Social Security earlier with lower annual payments.
We already have a retirement crisis with Baby Boomers overwhelming the system. Their retirement numbers have increased, and will continue to do so, between 2000 and 2024, then don’t begin to die off until 2016 to 2040.
Only overly rosy economic projections without recessions make it look remotely possible to fund through present entitlement programs.
It isn’t…
Especially as the economy faces downward trends into the early 2020s with near-zero workforce growth and low productivity for decades to come.
And even if you do get your promised Social Security, which is likely be less in the future, it only covers about 40% of the average peak working wages. Retirees need about 80% to live comfortably.
A survey from the Nationwide Retirement Institute shows that 26% of people that have been retired for over 10 years say life is worse, and 27% of recent retirees say the same. About 75% of recent retirees blame a lack of income, while 85% of those retired for over 10 years blame higher living costs – things like health care and housing.
Modest Social Security adjustments with low inflation over the last few decades don’t reflect what’s happening in these two areas of senior living costs.
The retirement and entitlement crisis we have been predicting for decades has begun!
So, try to stay healthy, save more, and invest wisely during this treacherous bubble era that’s about to come to its dramatic end.
Harry

The post People Are Retiring Earlier Than They Plan appeared first on Economy and Markets.
May 11, 2018
Inflation: Mission Accomplished
It was a busy week for the Treasury bond market: A Federal Open Market Committee (FOMC) meeting, a manufacturing outlook, inflation, wage and spending updates, and, to top it off, the monthly jobs report released Friday morning!
Last Monday’s March Personal Income and Outlays report didn’t include a lot of surprises. Monthly personal income was up 0.3% on the expectation of a 0.4% rise. Consumer spending was up 0.4%, as expected.
The Federal Reserve’s preferred inflation gauge, the core personal consumption expenditure price index (the PCE price index), was up 0.2% month over month, as expected. The year-over-year pace of 1.9% was below data-watchers’ 2% forecast.
In other words, there were no surprises in the report.
The Institute for Supply Management (ISM) Manufacturing Index for April came in below expectations, seeming to contradict a sector in growth mode, as the outlook was also weaker than expected. Metal tariffs and other input costs are affecting the outlook, but orders are still strong.
Treasury yields held steady… until the FOMC concluded its policy meeting Wednesday afternoon. The Fed held the line, but a subtle change in its policy statement did move markets a bit.
The Fed thinks inflation is under control, even though it might overshoot the central bank’s 2% target.
That’s probably because, in the Fed’s estimation, wage inflation remains low.
The FOMC changed the wording of its statement to note that the economy is growing at a moderate rate and consumer spending is also moderate while business investment grew. The Fed removed the phrases “the economic outlook has strengthened in recent months” and “the Committee is monitoring inflation developments closely.”
The markets seemed to translate the change to this: “Inflation hit our target, mission accomplished, but the economy isn’t continuing to strengthen…”
Yields jumped at this slight change but quickly backed off and settled the day lower than they began it.
The April employment situation was a mixed bag and, overall, a bit disappointing.
The market expected 191,000 new non-farm jobs. It got 164,000. The unemployment rate ticked a little lower than expected, down to 3.9%. But the labor force participation rate fell, against expectations, to 62.8%.
Most important, though, is that take-home pay grew by 0.1% month over month and 2.6% year over year. The market wanted 0.2% and 2.7%.
So what happened with long-term Treasury bonds?
Traders were buying, and yields were dropping – and that was good for my system that tracks the Treasury bond market. It means one of my positions is going in the right direction.
Good trading,
Lance

The post Inflation: Mission Accomplished appeared first on Economy and Markets.
Successful Investing Boils Down to Your Best Guess
Let’s talk about the difference between long-term and short-term forecasting. Both are critical to giving you an edge with your financial and business planning. But they’re entirely different beasts, and I explain why in today’s video.
Long-term forecasting is about identifying the fundamental trends that are important to the economy, and then projecting them into the future. And I’ll tell you, it’s easy to do (which I explain in the video, along with why I really do care about the longer-term cycles like the 500-year one)!
Short-term forecasting, on the other hand, isn’t about predictability (like long-term forecasting). Rather, it’s about probability, and that’s why you need an edge.
In fact, that’s one of many reasons why we have Adam O’Dell on our team. He’s probably one of the best short-term market players I’ve ever seen (to be clear, Adam isn’t a long-term forecaster).
Listen to today’s video. I elaborate and explain it all.

Harry
Follow Me on Twitter @harrydentjr

The post Successful Investing Boils Down to Your Best Guess appeared first on Economy and Markets.
May 10, 2018
Japan’s Monumental QE Has Done NOTHING for Its Inflation or Growth
The biggest debates I have are with gold bugs. They believe endless money printing will inevitably lead to hyperinflation and that will push the gold price over $5,000 an ounce while sinking the dollar to near zero.
They are (and have been), quite simply, wrong!
Japan has already proven that money printing doesn’t lead to much higher inflation, and certainly not hyperinflation… especially when in a deflationary period of debt and bubble deleveraging like the 1930s. Such an environment destroys money and creates deflation, with fewer dollars chasing goods and services.
The truth is, Japan TRIPLED down on its money printing efforts in 2013 after 14 years of more typical levels of QE… and it had a minor impact on inflation or the economy.
Look at this chart…
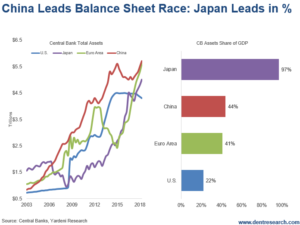
It shows the insanity of Japan’s (and all others’) QE efforts. We’re the only sober country since early 2014…
China leads the central bank balance sheet race when it comes to total assets. Europe’s next in line, then Japan, and then the U.S.
But look to the right of the chart. As a percentage of GDP, Japan’s central bank created total assets at a whopping 97%, yet its GDP is only 25% of the U.S.’s.
Japan’s QE has been about four times that of the U.S. For the U.S. to do what Japan has done, the Fed would have to QUADRUPLE down and print $12 trillion in addition to the $4 trillion it has already printed.
Try proposing that after the last round of QE finally fails.
But even if the Fed tried to print a fraction of that, it still wouldn’t result in hyperinflation.
An aging, flat or shrinking workforce is deflationary.
Debt deleveraging and bursting bubbles are deflationary.
We’re in the deflationary Winter Economic Season, and it’s almost impossible to create high inflation in such a period.
Consumers, businesses, and governments have over-expanded and can’t, or don’t, need to borrow more. They don’t need to leverage the money central banks print.
All the newly “printed” money does is create financial asset bubbles in stocks and real estate. And such bubbles always burst in the end, creating a larger financial disaster.
Europe has printed almost twice as much as what we have, when compared to GDP, and it has very low inflation and lower growth than the U.S. That’s because our workforce and demographics are flattening, but not declining, as is the trend in Europe and Japan.
China has created the most central bank assets, but in its case, from the massive debt bubble that resulted from the government’s implicit guarantees rather than QE. It’s spurred a massive export boom that has accumulated foreign exchange reserves of over $5 trillion, $1.2 trillion of which is invested in U.S. Treasurys.
Such buying of sovereign bonds suppresses interest rates and is similarly stimulating globally as QE policies.
The big question is: Will central banks have any credibility to take QE up to higher levels if the economy crashes when such unprecedented stimulus finally fails and we end up in a worse crisis than 2008 to 2009?
I doubt it.
And if Japan’s tripling down, producing four times the stimulus compared to the U.S., didn’t create inflation or any significant growth, would even 10 times make that big of a difference? (Ten times globally would mean $150 trillion or two times global GDP).
Unlikely.
My view is that the next bubble crash will nearly end, or totally destroy, central banks.
People will realize that markets are better at managing interest rates and our economy than a bunch of pin-headed academics are.
Central banks should just provide short-term liquidity in crises, not endless stimulus or macromanagement of markets and economies.
Besides, now that tapering is the trend, central banks will be a bit slow to react and be behind when an inevitable crash does occur.
If you bet on a hyper-acceleration of QE, on hyperinflation, and on gold… you could get your ass handed to you… even if you’re right about a financial crisis ahead.
On Monday, I sent our 5-Day Forecast email to our Boom & Bust subscribers showing why the dollar is starting to head back up again and how it may curb gold’s bear market to the lower end of the $1,375 to $1,428 range I predicted. If you missed that, learn more here.
Deflation has happened many times at the global level, as has high inflation. Hyperinflation has rarely happened and only in isolated countries, like Germany after losing WW1 and being burdened with massive reparations… Zimbabwe, Argentina and, now, Venezuela and Argentina again.
It’s the opposite impact for stocks, high-yield bonds, real estate, and commodities.
Deflation’s the same, but worse than high inflation. So, understanding the difference between deflation and inflation is MORE IMPORTANT than understanding how much the economy will grow or crash.
The logic of gold bugs is that printing money causes inflation. Rather they should be asking: Why are central banks printing so much money, so desperately?
They’re doing it to fight the already pernicious deflationary trend that began in early 2008, and that I predicted in my first book back in 1989…
And since you don’t get something for nothing and you can’t fight fundamental trends forever, deflation will win in the end.
Bet on that!
Harry

The post Japan’s Monumental QE Has Done NOTHING for Its Inflation or Growth appeared first on Economy and Markets.
May 9, 2018
Why We’re Headed Toward Oil Independence
Almost two years ago, the Saudis acknowledged they had a problem. The price of oil was too low.
The oil-rich county had fought a surge in supply from American frackers by opening the taps, and the move pushed oil prices to their lowest level in decades.
Even though the Saudis and other OPEC members still held onto market share, they were bleeding cash because their government budgets were modeled on oil closer to $80 than $30.
After several years of gushing the black crude, Saudi Arabia led a movement inside OPEC, along with several non-OPEC producers like Russia, to trim supply and push the price of oil higher.
I was skeptical. No, that’s not quite right.
Closer to the truth, I laughed at the notion that any member of this group would hold to their agreement to limit production. They’d so often lied to each other in the past.
Today, the price of oil is 80% higher than it was in 2016, and OPEC, along with its non-member co-conspirators, has kept to its agreement to shave production by 200,000 barrels per day, which has dramatically cut the global supply glut.
Add to that the geopolitical concerns swirling around our nuclear agreement with Iran and the potential for new sanctions that could cut Iranian oil supply, and you have a great recipe for sustained high oil prices.
To that, I only have one thing to say to OPEC, et al. Thank you, thank you very much!
The Saudis tried to stem the rise of American fracking companies by pumping more oil from 2012 to 2016, but the genie was already out of the bottle.
The increased supply weighed on the price of oil, and caused frackers and their investors a lot of pain, but the approach wasn’t enough to overcome the technological advances made in the North American oil industry.
The land oil rig count in North America, which is mostly U.S. frackers now, peaked at 1,592 in October 2014.
With OPEC and others producing oil like mad and driving the price lower, oil companies here shut down their rigs, dropping the count to 292 by May 2016.
But with prices once again on the rise, the count is back up to 1,101.
That’s particularly good news in my neck of the woods, near Houston, Texas, the oil refining capital of the U.S.
It’s great news for America in general because we’re now producing a record amount of oil, and in 2015 the Obama administration lifted the ban on exporting crude oil.
These circumstances are a complete turnaround from what we saw in prior decades, when higher oil prices meant that Americans shipped more cash to overseas producers.
Yes, we still buy foreign oil because of logistics and efficiencies, but on net, we’re getting closer to oil independence.
By the mid-2020s, we’ll be the largest oil producer in the world.
Higher prices mean that other nations will pay us more for our resource, and that’s a great thing.
But What About Gas Prices?
Now, there is the sticky (no pun intended) issue of gas prices.
With rising oil prices, consumers will definitely pay more at the pump.
It hurts to watch the digits roll by when we fill up our cars, but when we compare the overall cost of fuel today with previous eras, we’re in great shape.
In 1972, before the oil shock, a barrel of oil cost $4.75 and gasoline cost a mere $0.36 per gallon.
Today, oil sits at $71 and gasoline costs $2.81. The inflation-adjusted prices from 1972 are $28.63 for oil and $2.17 for gas. That puts oil prices today 147% higher than the inflation-adjusted rate, and gasoline up 30% more than inflation.
For drivers, this would be awful news, except for one thing. We don’t buy as much gas.
In 1972, the average driver traveled 10,100 miles per year, which is fewer miles than today’s driver at 12,000 miles.
But back then, we drove land yachts that averaged a whopping 13.4 miles per gallon so we burned 754 gallons of gas. Today we drive more miles, but our cars get much better mileage, covering more than 24 miles per gallon.
The average driver in the U.S. uses about 500 gallons of gas, or one-third less than the driver in 1972. Comparing inflation-adjusted dollars spent, today we cough up $1,405 for gas per year, whereas our 1972 counterpart paid $1,636 per year.
I’m not a big fan of paying more for, well, much of anything. But the pain is softened when I know the extra bucks are flowing down the road to American companies and workers.
In that sense, it feels pretty good to have been so wrong about the price of oil.
So again, I say thank you to Saudi Arabia, OPEC, and Russia. Thank you very much.


The post Why We’re Headed Toward Oil Independence appeared first on Economy and Markets.


