
Harry S. Dent Jr.'s Blog, page 49
July 2, 2018
Why Puerto Rico? Let Me Explain…
I moved to Puerto Rico in mid-2016.
Not for the tax advantages (at first), but to be closer to my vacation house on Culebra (a Puerto Rican Virgin Island) and to have a high-end beach-front lifestyle for one quarter the cost of moving back to South Beach, Miami.
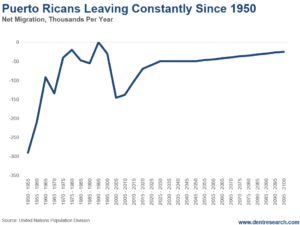
Puerto Ricans are U.S. citizens and have free movement to and from the U.S. The truth is that it’s always been more of a one-way street from Puerto Rico. The chart below shows the trends of net migration to the U.S. since the 1950s.
Such constant outmigration hurts the Puerto Rican economy. But it gives incentives for policies that attract people and U.S. businesses from the mainland.
The pharmaceutical-oriented tax incentives from 1976 to 2006 transformed Puerto Rico by creating high-wage jobs that tripled the cost-of-living-adjusted standard of living here.
Since those were discontinued in 2006, Puerto Rico has been in a long recession that has worsened due to the destruction of Hurricane Maria.
In 2012, Puerto Rico initiated Acts 20 and 22, which offered very attractive tax incentives to financial, investment, and service businesses.
After I moved to Puerto Rico, I found out I could qualify for those tax advantages that I didn’t expect to qualify for. I finally applied for and acquired Act 20/22 status, and became a Puerto Rican resident, yet still a U.S. citizen.
Here’s a quick summary of what that involves:
You don’t give up your U.S. citizenship or passport.
You must physically live in Puerto Rico for six months a year just to qualify.
You pay normal U.S. taxes on U.S. – or global-sourced income outside of Puerto Rico.
On Puerto Rican-sourced income you pay a fair salary at their maximum rate of up to 33%, and then after that you pay 4%… That’s 4%, not 39.6% plus state income taxes. Wake up California and New York!
Even better, on short-term trading and long-term capital gains you pay ZERO… This is a much greater advantage for short-term traders than even long-term investors.
Early qualifiers will get grandfathered in even if this gets cut off later, so act sooner than later.
Act 20 for business taxes at 4% is likely to be extended longer than the zero capital gains for short-term traders and investors under Act 22.
You must be in this program for three tax years. If you move back to the U.S. before that, you must pay back all your tax savings.
The best tax advantages go to investment managers and traders, or newsletter writers and publishers like myself.
For people like me who speak around the world, but research and write here, the advantage is a bit less because the income from appearances is sourced in the U.S. and globally.
The lifestyle in Puerto Rico has improved dramatically over the 25 years I’ve been coming down here. But the real advantage is lower costs for real estate: 60% lower on average, and as much as 75% lower on the high end.
The beach areas here are safe, even though crime is still higher than in the U.S. in the outer areas.
That also creates an advantage for retirees in the U.S. to move here as well.
Your nest-egg will go much further here while the weak economy only keeps real estate and the cost of living lower. And your income typically does not depend on the Puerto Rican economy if you are retiring here and living off your savings or retirement plan.
There’s also a move in progress to extend similar tax advantages to wage and salary earners that move here from the U.S. I’ve heard from a few officials that it’s coming.
It’s obviously not for everyone, but I’m happy I moved here. I say more U.S. businesses should consider Act 20/22 advantages, as well as lower wages and real estate costs to export back to the U.S. more profitably.
The first step is to take a week or more vacation here and really see the island. It has a vibrant urban culture to add to the beaches, mountains, waterfalls and two Virgin Islands.
Retirees, keep Puerto Rico in mind.
For a more in-depth look at the paradoxes and attractions of Puerto Rico, check out the latest issue of The Leading Edge.

Harry
Follow Me on Twitter @harrydentjr

The post Why Puerto Rico? Let Me Explain… appeared first on Economy and Markets.


June 29, 2018
Escalations in America
The markets keep reacting to the escalations in trade tensions.
People keep reacting to the no-tolerance policies on immigration, separating children from their parents. Though this policy was finally reversed by Trump, there are still many issues…
Our politics are so charged with ideological differences that there’s no focus on the facts.
That’s where we can shed some light.
The so-called “flood” of illegal (and legal) immigrants is long over. Immigration first peaked in 1991, and again in 2000.
It’s been falling sharply since.
And the illegal immigrant population peaked in 2007, but has declined 4%… More are leaving than entering.
So, where’s the flood?
Arrests per month at the border were down to 21,000 in 2017 compared to 134,000 in 2000.
Yes, there are unfair tariffs and trade agreements that counter U.S. interests.
But they are something different, and need to be solved individually based on the facts.
The 10% tariff against autos in Europe also protects American automakers — who have a substantial production there for European markets — from the Japanese. Germans largely export luxury cars where there is little competition from the U.S. automakers, except “style-dated” Cadillacs.
Do you think that will stop the status-conscious rich here?
China has the worst imbalance of exports to us versus our exports to them. But we should realize that stopping the trend will cause higher prices to everyday Americans at stores like Wal-Mart.
I’d rather hear a lot more facts and realistic policy solutions rather than heated rhetoric and ideology.
And I’ve got more to say in today’s video. Click here, or click the video below to watch.
Harry
Follow Me on Twitter @harrydentjr

The post Escalations in America appeared first on Economy and Markets.
June 28, 2018
Are You on the Road to Retirement?
If you’re a Baby Boomer, it’s very likely that you have retirement on your mind. Even if you love your job and have no immediate plans to stop working, there is a certain peace of mind in knowing you can walk away when the time comes.
If you’ve regularly maxed out your 401(k) plan (or have even gotten close), you may have hundreds of thousands or even a couple million dollars sitting in your account. But with the cost of living what it is these days, can you be sure it’s enough?
According to the National Institute on Retirement Security, 92% of working households don’t meet the savings target they need to retire at age 67.
But there’s no magical age for retirement. The fork in the road doesn’t suddenly appear at age 67, 65, 60… or any other number. It’s here right now, TODAY… no matter how old you are.
That’s because whether you’re 40, 50, 60, or somewhere in between, there’s never a better time than right now to make your financial independence and your retirement dreams a priority.
It’s important to recognize that every day, every month, or every year that you wait to fix it only puts you further and further behind.
So, ask yourself, where are you on the road to retirement?
In our latest infographic below, we map out where you SHOULD be, based on age and income. Click the image below to check it out!
If you’re lucky enough to be on track, then congratulations, you’re officially one of the 8%!
But if you’re among the 92% of us who aren’t anywhere close to having enough saved, you might need to rethink your strategy.
Don’t worry. There’s still time to catch up, and I’ll help show you how it’s easier than you might think. Check out our new infographic, Are You on the Road to Retirement?, to learn more.

Harry
Follow Me on Twitter @harrydentjr

The post Are You on the Road to Retirement? appeared first on Economy and Markets.
June 27, 2018
Fact: Americans Aren’t Getting Rich. So What To Do?
Unemployment sits under 4%, and wages are inching higher.
Home prices are almost 7% above where they were this time last year, have marched up 5% to 7% per year for several years, and the S&P CoreLogic Case-Shiller Home Price Index has reached new highs.
The Dow and S&P sit just below record highs, while the Nasdaq is in record territory. That all sounds fabulous!
We should be dancing in the streets. But there’s a problem.
Most Americans aren’t getting rich. In fact, compared with the mid-2000s, things look downright depressing.
The Federal Reserve conducts the Survey of Consumer Finances every three years. The data they compile is catnip to number nerds like me. The Fed publishes the results about a year after the data is collected, so the 2016 figures came out at the end of 2017.
The survey asks questions about retirement accounts, savings accounts, debt, pensions, income, and a host of other things. It’s easy to get lost in the weeds. But if we focus on just one big number – assets – we can put the issue of wealth in perspective.
Considering six age ranges, under 35, 35-44, 45-54, 55-64, 65-74, and 75 and over, wealth increased in only one age group between 2004 and 2016.
Only the oldest set made headway, improving their lot by 27.7%. The next oldest group, those 65 to 74, went backward by 7.3%. Everyone else took a bath.
Those under 35 dipped 38.3%, the 35 to 44 set lost 32.3%, and the 45 to 54 group gave up 32.8%. Those closest to retirement, ages 55 to 64, took the biggest hit. They had 41.4% less in 2016 than they did in 2004.
We can debate why or how we got here, but it won’t change the fact that we’re here. Now what?
How do millions of Americans pay their way – from education through retirement – if they aren’t accumulating assets?
Another good question along the same line is, how do we provide the benefits these Americans have earned and will demand when our entitlement programs go broke?
The answer to both is simple. With our current financial structure, they won’t pay their way and we as a nation won’t support them in retirement.
As the old economist Herbert Stein said, “If something cannot go on forever, it will stop.” If a situation can’t continue, it won’t. Something will have to change.
In this context, the change is obvious. The government will step in with greater force, adjusting the levers of financial incentives and distributions. That’s a fancy way of saying, get ready for higher taxes.
Just as with the Survey of Consumer Finance, there are a million different ways to look at taxes, but I’m only interested in the ultimate question.
Will I pay more, or less? For me to pay less, or just stay even, we’d have to tell tens of millions of Americans that they don’t get the benefits they’ve earned, much less any additional assistance.
Given the structure of wealth and income in the U.S., and the size of the promises we’ve made, the most likely outcome isn’t to let benefits fade away.
When the government starts looking for a way to shore up its finances, it will look in the most obvious place – your pocketbook.
The time to start preparing is now.
You can build your own streams of income to protect against the government cutting your benefits because it determines you have too much already.
You can create your own assets.
And you can minimize your taxes to thwart higher payments in the years ahead.
We’ve covered this territory often, using everything from Charles’ Peak Income newsletter to the new Instant Income Alert offering from Lee Lowell.
No matter how you choose to approach it, the key is to make a plan and get going as soon as possible.
Because something will have to change.

The post Fact: Americans Aren’t Getting Rich. So What To Do? appeared first on Economy and Markets.
There Are More Job Openings Than Unemployed
You’re probably thinking that that’s a paradox.
If job openings are greater than the total unemployed for the first time since 2000 (when job openings were first measured), you’d think: the economy is so good that this can only continue.
Here’s the big problem: We are running out of workers to hire in this unprecedented over-stimulated economy after over nine years of QE, and, most recently, major tax cuts.
It’s simply a matter of projectable demographics.
The chart below shows how total employment never gets as high as the civilian labor force, or what is more commonly called the workforce. This number only includes the people that are looking for work over time, which naturally excludes retirees, college students, caretakers and people on disability.
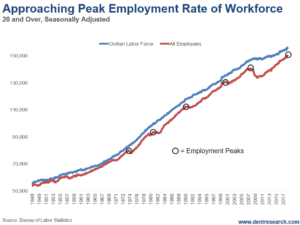
There’s always a gap between the employed and those seeking employment, or the labor force.
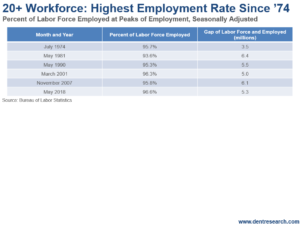
Looking at recent employment peaks, that gap is presently the smallest since 1974, as the table below shows.
In other words, we’re running out of workers to hire in this artificially overstimulated economy.
The previous high was in early 2001, after the greatest demographic and technological period of growth and productivity in our lifetimes. I’ve been warning for months that there’ll simply be a point when the workforce naturally slows.
By our projections, people enter the workforce, on average, at age 20.
The average age of retirement is around 63.
There’s a peak projected to take place by late 2018, with a minor slowing of about 1% that bottoms out around 2026.
Then workforce growth is very slow for decades to come – about 0.2% on average – and declines rapidly after 2038.
Given that we’re at the highest rate of employment that we’ve seen in four and a half decades, it’s logical to assume we’re running out of workers. Job numbers aren’t far from slowing, and likely will at some point. The only question is: Are there more people that will re-enter that aren’t currently in the workforce and/or actively seeking a job?
You’ve likely heard that there were 14 million people that gave up looking for jobs after the Great Recession. There’s a recent estimate that suggests there are still five million of those left after rehiring most of those 14 million.
But I think that’s overstated.
I looked at the number of people that want a job, but are not actively seeking. That number was 5.7 million. Out of that, 3.35 million haven’t looked at all in the last 12 months.
If you aren’t even looking after 92 straight months, with over 200,000 jobs created, when are you going to look?
Maybe you’re a drug dealer, or something.
That leaves 2.35 million who have looked in the last year.
Then you have to subtract the 0.9 million people who say they can’t work now – could be caring for someone sick, or themselves sick, or in short-term training, etc…
We’re left with 1.45 million people.
I’d say that’s a decent pool of people to pull into the workforce again. And that’s just a six and a half month’s supply at the recent rate of 223,000 per month.
In an in-depth 2016 survey, only 1% of people out of the workforce said it was because they couldn’t find a job. That would imply that there’s just under a million potential people coming into the workforce – only four months’ supply of 223,000 monthly jobs created.
Another survey showed that, for the first time, there are more job openings than there are unemployed and seeking – 6.7 million versus 6.1 million. That’s a sign to me that we’re running out of people who’re returning to the workforce due to strong opportunities.
And as Baby Boomers age, more will choose to retire. That’s why workforce growth overall is peaking this year, and will decline or flat line in the coming years.
So, there’s no way for sustained 4% growth. Especially with productivity rates having declined to 0.5%, and still falling with aging.
There’s always a certain percentage of workers who’re in transition between jobs after being fired or choosing to leave for a better opportunity. That tends to be 3.5% to 4%, which is why we never get 100% employment of those seeking.
That’s four and a half to six million workers, and that’s about the present gap between employed and the labor force.
The lowest unemployment rate before now, which is 3.8%, was 3.5% in 1969, before a 14-year downturn with four recessions and record inflation rates.
That’s what I call the “summer” economic season.
“Winter” is coming, and it’s much worse…
Harry
Follow Me on Twitter @harrydentjr

The post There Are More Job Openings Than Unemployed appeared first on Economy and Markets.
June 25, 2018
Bitcoin Crashes to New Lows
Bitcoin and cryptocurrencies are at a critical point.
On Sunday, bitcoin hit new intraday lows of $5,782, falling below the previous lows of $5,968 on February 6.
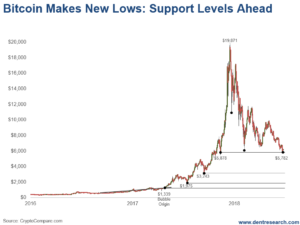
The first crash happened over five days, dropping down to $10,876 (first point after the peak). bitcoin was down 45.3% from the all-time intraday highs of $19,871 on December 17, 2017.
In a more typical five to six-year stock bubble, the first crash averages 42% in 2.6 months. But this bubble was the most extreme in history, even topping the infamous tulip bubble of 1636. It took only 7.7 months to build from its bubble origin of around $1,339 on April 27, 2017 (first point on chart).
That’s a 14.8 times gain!
The first intraday low overall hit just 1.4 months later at $5,968 on February 6, 2018 (second point after the peak).
That was a crash of 70% from the intraday high.
The low on Sunday beat out that low by almost 200 points, and is bouncing today (June 25th) up to over 6,300 so far.
If bitcoin cannot hold near these recent lows of $5,782, it could be ominous in the weeks ahead!
Keep in mind that I’m using intraday numbers for the crash points as that’s what will trigger stops for most traders and investors.
Now, look at the support levels from the bubble on the way up. I quote these on closing numbers, not intraday, as that is more typical for that type of analysis.
The first one is at $5,878 on November 12, 2017. We’re in the process of testing that level. Intraday numbers have already breached that level. If bitcoin closes further below there, it would be more dangerous.
If that’s broken, the next support level would come down around $3,243, the low on September 14, 2017. That would be down 83.2% from the closing all-time high of $19,345.
The next support level comes in at $1,975 on July 15, 2017. That would be a crash of 89.8% from the high… real bubble crash territory…
If it goes that far, it’s likely to go all the way back to the bubble origin of around $1,333 on April 27, 2017, with a 93.1% crash. That’s comparable to the dot-com bubble from 1999 into early 2000 – and the tulip bubble as well.
Frankly, I think there are two likely scenarios:
The first being that bitcoin does hold near the recent lows and support levels of November 2017.
And for the second, the bubble bursts fully and we see a 93%-plus crash.
A clear break below $5,782 favors the second scenario.
While a break up above $7,800 leans towards the first.
If the bubble takes the same time to crash as it did to build, then the lows could be seen around early August.
The dot-com bubble had a similar crash after a very sharp and quick buildup – which went on to see a 16-year bull market, along with another great bubble from early 2009 into 2018 (so far).
This isn’t the end of the broader blockchain technology movement… but it is the end of the first sharp bubble…
Harry
Follow Me on Twitter @harrydentjr

The post Bitcoin Crashes to New Lows appeared first on Economy and Markets.
June 22, 2018
We’re Moving Sideways
The markets don’t seem to be moving in any specific direction. It’s been this way since late January.
If the bubble was to burst, it would’ve done so by now, sharply falling down. But it hasn’t.
The damn market is moving sideways.
There could be any number of reasons for this to happen, but after talking with some of the guys here at Dent Research about it, we think that the Trade Wars have a heavy hand in it.
Bonds have been going through a downtrend and they could finally break up, but, now, they don’t seem to be giving way in either direction.
There’s gold, which broke below the bottom trend line…
Real estate continues to remain at high prices, which is a cause for lower birth rates…
The government continues to fight against the bursting of bubbles…
Sooner or later, something will give way. The bubbles will burst. And when this happens, it’s best to be prepared for it.
I’ve more to say about this in my video below…
Harry
Follow Me on Twitter @harrydentjr

The post We’re Moving Sideways appeared first on Economy and Markets.
June 21, 2018
Deutsche Bank’s Stock Down 91.5% to New Lows
A few years ago, I wrote an issue for Boom & Bust outlining the biggest problems in the Eurozone after the QE-stimulated recovery that saved the banks and financial system from going under. The point made was that Italy was still bankrupt at the banking level, and in dangerous levels of public debt. Deutsche Bank was not recovering with other banks, and instead was languishing near the lows with other major Italian banks…
I looked at Italy in a recent . And now I want to update you on Deutsche Bank, as it has recently hit new lows since late 2016 and the crash in early 2009.
How could such a prominent bank be hitting new lows after over nine years of an economic recovery, albeit a more reserved one?
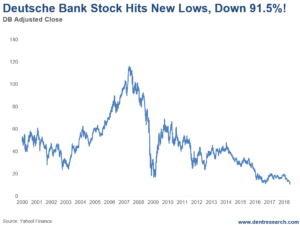
This stock peaked on May 11, 2007 at $116.40 at its close (with an $152.44 intraday high). It crashed down to a low of $17.20 on February 23, 2009, an 85.2% loss. After rallying a bit in 2009, it recently hit a substantial new low of $11.00 on June 5…
That’s down 91.5% from its all-time high.
This, again, only topped a by a few large banks in Italy. It’s a clear sign of trouble for Germany’s flagship bank, and will almost certainly go under in the coming years if it’s performing this badly now.
I’ll keep it simple: Deutsche Bank had, and still has, the highest exposure to derivatives – the most toxic and most leveraged of financial assets – of any bank in Europe, and globally.
And like many large French banks, it has a lot of bad loans, especially to ailing Italian companies.
Deutsche Bank is the most obvious sign of how challenging the bad debt situation still is in the Eurozone, with Italy, alone, housing 40% of the non-performing loans.
Now, let’s contrast that with the U.S…
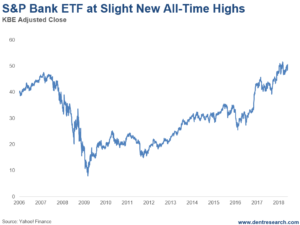
The S&P Bank ETF shows U.S. banks are doing much better. But from how we see things, they’re still in trouble if there’s a recession (depression) and real estate crash worse than last time – as I expect to happen.
This index peaked on February 20, 2007, as the subprime crisis was starting to rear its ugly head, at $47.60.
It crashed 80.5% to $9.30 on March 6, 2009.
By March 12 of this year, it peaked at $51.90. That’s a 9.0% gain over its high in 2007.
Banks in the U.S. aren’t as healthy as they look though…
After being bailed out and propped up by QE and free money over the past nine years, the banks have greatly underperformed.
A broader look at the S&P 500 suggests new all-time highs 82.5% higher than in 2007 on January 26 – and looks to go higher before a likely very long-term peak.
I expect a retest of the 2009 lows, and likely lower for the U.S. banks.
If that’s the case, Deutsche Bank will be taken over by the German government, or merged into another financial institution like Bank of America was into Merrill Lynch in the last financial crisis…
And Europe will be in a deeper crisis than the U.S…
Harry
Follow Me on Twitter @harrydentjr

The post Deutsche Bank’s Stock Down 91.5% to New Lows appeared first on Economy and Markets.
June 20, 2018
Trade Wars, Rate Hikes, and a Whole Lot of Maybes
Last week, Federal Reserve Chair Jerome Powell dropped a couple of surprises on Fed watchers.
What didn’t come as a shock was the quarter-point hike to the overnight federal funds rate. Markets were fully prepared for that move.
But they were caught unawares when the Fed highlighted the potential for an additional hike this year. That would bring the total number of hikes in 2018 to four.
Since the March meeting, the Fed revised its median projection for full-year economic growth to 2.7% from 2.6%.
The central bank’s updated outlook also calls for the unemployment rate to dip to 3.6%, an improvement from the previous forecast of 3.8%. A 3.5% jobless rate is the target for 2019 and 2020. Not bad.
Inflation is also expected to tick up. The Fed bumped up its projection for the core personal consumption expenditure (PCE) index – one of the central bank’s favorite inflation signposts – to 2% from 1.9%.
Starting in January 2019, Chairman Powell will conduct a press conference after every meeting. That means traders will have to stay on their toes, as market-moving decisions will be on the table each time.
Up until now, the Fed chair held a press conference after every other meeting; the market had assumed that, in the absence of a presser, no policy changes would be announced.
More Fed press conferences could create more trading opportunities in the Treasury market. No matter how we feel about the Fed, we’re always in favor of that!
Overall, Powell thinks the U.S. economy is in “great shape,” which is reflected in the strong job market. Though he warned that rising oil prices could push inflation beyond the Fed’s 2% target, he doesn’t believe it’ll last long enough to be an issue.
Powell also conceded that the lack of wage inflation was still a mystery, despite labor shortages and low unemployment.
He also mentioned that we’re about four rate hikes away from “neutral.” What does that mean? Our Fed-speak translator tells us that’s Powell’s way of saying that monetary policy isn’t helping or holding back our economy.
There were no questions about the Fed’s balance sheet, but Powell did note that the effort to run off the central bank’s portfolio is proceeding as planned.
Powell didn’t seem too concerned about the yield curve, asserting that a flattening of the curve after a hike in short-term rates was natural.
After the March policy meeting, some participants expressed concern with the yield curve’s slope. Others shrugged it off.
Here’s what I think.
Take a look at the Treasury yield curve since the last Fed meeting in March.
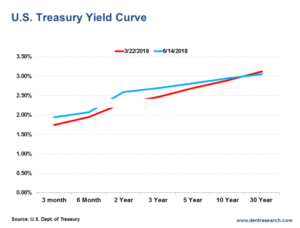
Notice how long-term rates fell while shorter-term rates climbed over the last three months.
Like I’ve said before, a flattening yield curve is a “DANGER!” sign. When the yield curve inverts, the economy will likely fall into a recession.
So, if the Fed hikes twice more this year and a couple more times next year, the overnight rate will sit at about 3%. If long-term rates don’t move much, it’s a near certainty that the economy will contract.
I doubt the Fed will consider that a “neutral” situation…
Of course, the projected policy path doesn’t account for changes in economic growth, inflation, or even the jobs market. If the economy deteriorates, don’t expect those rate hikes to happen.
Cold, Hard Facts and A Lot of Maybes
The Fed meeting wasn’t the only news of significance last week.
Consumer spending has been mixed this year, but low unemployment and slowly rising wages helped drive retail sales sharply higher in May.
Consumer spending accounts for about two-thirds of our economy, while retail sales make up about half of total consumer spending. So, it’s an important metric.
Retail sales were up 0.8% on the month, doubling the market’s expectations. Excluding auto and gasoline sales doesn’t change the magnitude of the surprise.
Normally, Treasury bond yields would spike higher after such a strong report. In this case, long-term yields fell.
Why?
Maybe it’s because the Fed hiked rates last week. Maybe it’s because investors saw that hike as a sign of an economic slowdown ahead.
Or maybe it’s the escalating trade tensions between the U.S. and China. It seems increasingly likely that tariffs are coming down the pike for trading partners that engage in unfair practices… just as President Trump promised.
That’s a lot of maybes. Uncertainty is king for the time being.
The threat of tariffs has already pressured Chinese stocks, which are down sharply over the past few trading days. We’ll see if those concerns spread to other markets.
Will the Fed stay the course and hike rates two more times this year?
I wouldn’t bet on it if the economy weakens, inflationary pressure abates, and wage growth remains contained.
Good trading,

Lance

The post Trade Wars, Rate Hikes, and a Whole Lot of Maybes appeared first on Economy and Markets.
June 19, 2018
[Video] We’ll Survive the Tariff Tiff
I think we could all improve our mental health by viewing most news as warped entertainment instead of education or edification.
Listening to reporters treat each twist and turn of political, social, and economic sagas as the end of the world can be exhausting.
I find it much easier on my blood pressure, and my psyche, to treat the news as a game of finding actual facts while dismissing most of the analysis.
As far as I can tell, our world hasn’t ended based on, well, anything. And we’ll survive tariffs, no matter what you hear on the news.
Let’s put this in perspective… I talked with our Dave Okenquist about the tariff tiff on Economy & Markets TV today.

Governments claim they use tariffs to protect important domestic industries. That might be true, but it’s not the main reason such taxes exist. It’s all about money.
When nations were agrarian and citizens could sustain themselves through farming, countries had a hard time raising revenue for the state.
The natural path was to tax goods as they entered and exited the country, which is why stamp taxes and tariffs abounded until the 20th century.
As the industrial revolution took hold and more people worked in factories, government officials found personal and corporate taxes to be a more efficient way to raise cash.
By taxing wealth creation (income), governments focused their efforts on something we all want to grow (our pots of cash) and imposed smaller burdens on the largest number of people.
In contrast, tariffs change consumption patterns and create perverse incentives.
The U.S. sugar program puts an artificial floor under domestic sugar prices, raising the cost to industries that use the sweet stuff. Since 1999, U.S. sugar prices have been between 17% and 238% higher than world prices.
As consumers, we pay $1.2 billion per year more for sugar than we would without government interference. The sugar industry claims this saves 40,000 jobs while detractors note that it costs the economy 120,000 jobs.
The artificially high price is why we get goopy high fructose corn syrup in our sodas instead of sugar, which is why my kids order “Mexican Coke” when they can find it.
The imported cola is made with real sugar and definitely tastes better. The Sugar Program has been a boon for corn growers as well as sugar producers. For the consumer, not so much.
As long as governments can generate sufficient revenue with broad taxes, then their citizens are better served by allowing market forces to dictate the flow of goods and services, which is why most wealthy nations impose relatively small tariffs.
On average, the U.S. charges just 1.61% in tariffs. That’s pretty low, but not the lowest. The countries in the European Union charge 1.6%, and our neighbors to the north in Canada charge a mere 0.85%. Even Japan, which we typically think of as trade unfriendly, charges a modest 1.35%.
The numbers get bigger as you move farther from countries of wealth. Mexico charges 4.36% and Brazil 8.0%. The biggest tariffs in general are in Africa, where Chad and Gabon charge 16.4% and 16.9%, respectively. The dubious winner of the largest average tariff is closer to home, the Bahamas.
The island nation slaps imports with a massive 18.6% tariff. That sounds heinous, because it is, but at least it’s 10% lower than it was in 1999!
China falls in between the rich and poor countries with an average tariff of 3.54%. That’s more than twice the rate of the U.S., but still not extreme.
The problem is that tariffs aren’t spread equally to all products, and the pain is generally felt in a small way across the nation while the benefits are narrow and deep. Sugar producers reap a rich reward while we pay a bit more for candy and have worse tasting soda.
The sugar industry makes much bigger political donations for one specific purpose than anyone on the other side of the sugar tariff argument. This makes tariffs a game of political football, where the only certain loser is the consumer.
The biggest issue with China is that the country almost compels a technology transfer from any company that wants to set up a local operation.
While this might gall foreign companies, they don’t have to enter such agreements. Instead, they can simply refuse to domestically manufacture goods in China and pay the applicable tariffs on their imports.
Maybe Trump’s negotiation tactics will work with China and he will get a concession to ease the technology transfer issue. But as for NAFTA, particularly as it pertains to Canada, it’s hard to see what the fight is about. Maybe the president thinks their average tariffs are too high at almost 50% less than ours.
While the current fight, with claims of national interest and crippling financial burdens, makes great headlines, the facts tell a different story.
Yes, we have tariffs, as most nations do. We should probably address specific inequities by industry as trade changes over time.
But the constant move toward lower tariffs since World War II has generally served us well.
Now if we could only get industry lobbyists out of the picture, but that’s a story for a different day.


The post [Video] We’ll Survive the Tariff Tiff appeared first on Economy and Markets.


