
Harry S. Dent Jr.'s Blog, page 48
July 16, 2018
The Death of a Dream, Part 1
It’s no secret that Millennials are not buying homes as early or to the degree that Boomers did.
They saw the first major real estate crash since the Great Depression. So, rentals are up and home buying is down.
But this is being called “the Dream on Hold.”
Our view is based purely on demographics, and it is more extreme than that: By 2024 the home ownership dream as a means to wealth will be DEAD!
This is not a theory.
It has already happened in Japan. They’ve seen declines in home prices for 27 years now!
That just isn’t supposed to happen in a world where they aren’t making more real estate. I study Japan intensely, as they have gone through the whole Boomer bubble and burst cycle many years before us – and we haven’t seen the worst yet by this example.
Look at this chart. It fits our bubble model for real estate too well…
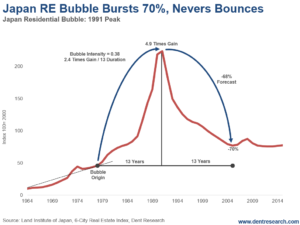
Their home prices peaked in 1991. This was the demographic peak for home buying at age 42.
Prices dropped 70% into 2013.
Our bubble model follows the male orgasm trajectory (scientifically plotted). It predictably took the same time to build as to bottom – 13 years. It was much larger and longer than the U.S. bubble in 2000 until 2006, which is why it burst deeper.
The bottom at 70% down was very close to the model that projects that real estate will crash back 85% to the bubble origin in 1978, or a forecast down 68%.
Who says that was a “Black Swan” and unpredictable?
But that’s not the real story…
They’ve not bounced since, even though the young generation came along to buy again, albeit smaller than the Boomers in Japan.
It took me years to figure out why Japanese real estate didn’t at least bounce modestly when its Millennial generation went into a positive buying trend from 1998 into 2015 (on a 42-year lag).
The reason: “Dyers” are sellers.
And real estate lasts forever, making that more impactful.
So, like the workforce projections where I add new entrants at age 20 on average and subtract the retirees at age 63, I had to change the model to subtract dyers (at age 84 in Japan) from the peak buyers at age 42.
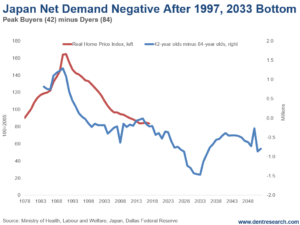
This created a whole different forecast.
“Net Demand” fell from its peak in 1991, and doesn’t bottom until 2033.
That means 42 years of falling trends in home prices, and likely more down the road farther.
You can imagine that virtually no one in Japan thinks real estate prices will go up substantially after a 27-year bear market…
The dream is already dead there.
But by this chart, net demand is already accelerating down again and prices could drop 80% from the top, or another 15% by 2033.
How dead do you think real estate will be as an investment by then?
On Thursday, I’ll look at the bubble and net demand in the U.S.
The good news: It’s not nearly as bad as Japan.
The bad news: Trends from the first bubble peak in 2006 will be down for at least 33 years.
Yes, our home ownership dream will die as well…

Harry
Follow Me on Twitter @harrydentjr

The post The Death of a Dream, Part 1 appeared first on Economy and Markets.


July 13, 2018
[Video] China Feels the Pain… U.S. Stocks Likely Break Higher This Fall
Markets have been very choppy and indecisive in recent months.
In his latest Facebook video, Harry updates where we stand on stocks, gold, and the U.S. dollar, with an eye toward whether the market will break up or down during the higher-volatility months of August through October.
Readers should stay alert and pay attention to our daily and monthly commentaries.
Growing odds suggest that the sideways correction could morph into one more rally. Whether that takes the form of a short burst or extends into the second half of 2019 remains to be seen.

The post [Video] China Feels the Pain… U.S. Stocks Likely Break Higher This Fall appeared first on Economy and Markets.
July 12, 2018
Tech and Sun Belt Dominate
Many studies focus on whole states for GDP and job growth, but I prefer looking at the cities people actually live in, which can be quite different from other parts of states.
That’s where it really happens.
Here’s a ranking of the top 15 cities for job growth over the last year.
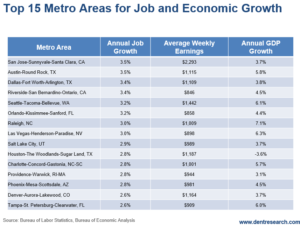
It’s not surprising that San Jose and Silicon Valley are at the top with 3.5% given the continued technology explosion happening there.
San Francisco isn’t up there since there’s nowhere left to expand. Though the housing cost and average income are second to San Jose and Silicon Valley, it’s well below the average at $99,533 GDP per capita versus $126,341.
Silicon Valley has higher average wages at $2,293 to partially compensate for the high cost of housing and living there, as does San Francisco.
San Francisco simply doesn’t have the same job growth and wages to compete.
But guess who ties San Jose at 3.5% growth… Austin! A hip area in Texas that attracts high-tech and California migrants who’re tired of the over-the-top home prices.
Seattle comes in at 3.2% job growth. The wages are generally higher, along with GDP per capita and cost-of-living, thanks to the high-tech jobs.
Those three cities are hip and trendy tech-driven areas.
Dallas and Riverside (a city on the south side of the broader metro area of Los Angeles) are very different. Though they sport different styles, these areas have high growth and a relatively low cost-of-living. They’re tied at the third and fourth spot with 3.4% job growth.
Orlando has a 3.2% job growth, benefiting from – like Dallas and Austin – domestic migration, and international migration, especially from Puerto Rico (over 400,000 to date).
Out of these 15 cities, 13 are in the Sun Belt.
That’s the two trends: Sun Belt for weather and tech for wages and lower costs.
The top six in wages, in order, are: San Jose, San Francisco, Seattle, D.C., Boston, and New York. But the high cost of living largely offsets the appeal of those cities.
GDP growth is the highest in Raleigh (7.1%), Las Vegas (6.3%), Seattle (6.1%), and Tampa (6.0%).
Unemployment rates are the worst in Buffalo (5.1%), Las Vegas (5.0%), Cleveland (4.5%), Hartford (4.4%), and Philadelphia (4.4%) – mostly areas in the Rust Belt…
No surprise there.
Now, where would I suggest my kids or grandkids look to move for opportunity?
If they aren’t in the high-tech arena, I’d say Texas, particularly Dallas and Austin.
North Carolina for Charlotte and Raleigh/Durham.
And Florida, to Orlando or Tampa.
To look at a full list of the top 40 cities and how they stack up against one another, click here.
Harry
Follow Me on Twitter @harrydentjr

The post Tech and Sun Belt Dominate appeared first on Economy and Markets.
July 11, 2018
Who Says You Can’t Have a Trade War Without Volatility?
Stocks rebounded nicely on Monday, despite the burgeoning trade war between the U.S. and China.
Nothing’s changed on that front. But no news was apparently good enough for a market bounce.
If the stock market is the score card, the Shanghai Composite’s 22% loss (as of last week) suggests that China isn’t faring as well as the U.S.
Of course, this battle is still in the early innings.
Just last Friday, the U.S. imposed tariffs on $34 billion worth of Chinese imports, turning rhetoric into reality.
China retaliated with its own duties on U.S. goods.
We’ll see which country blinks first in the standoff.
I’m not sure President Trump has the right approach… but I agree with his goal of leveling the playing field.
You often hear trade deficits mentioned as the reason for the tariffs.
However, China’s intellectual property theft from U.S. companies poses a bigger threat than any imbalance.
Show of Strength
The Institute for Supply Management’s manufacturing index is still on fire. The forward-looking indicator surprised to the upside in June, coming in at a strong 60.2.
Readings above 50 imply an increase in activity levels, while a move over 58 implies manufacturing growth of about 4%.
The ISM manufacturing index is a proven market mover, but this upside surprise didn’t move the market whatsoever.
A Minute of Our Time
I didn’t think the minutes from the Federal Open Market Committee’s June meeting would move the markets.
I was right.
The market already registered its disapproval of the Federal Reserve’s plan to hike rates twice more, despite a flattening yield curve and an intensifying trade war.
Traders bought the long end of the curve, reducing its slope even more.
Since last month’s rate hike, the difference between 30- and two-year yields has compressed from 55 basis points to a measly 39 basis points.
If the Fed delivers on its targeted rate hikes, the yield curve could invert. We don’t want that to happen. An inverted yield curve usually means a U.S. recession.
The minutes showed that at least some Fed officials appear concerned about the yield curve and feel it’s important to monitor. So, that’s a relief!
On the Payroll
Friday’s payroll report was a mixed bag.
Here’s the good news: the U.S. economy created 213,000 non-farm jobs in June, topping the consensus estimate of 190,000 new positions. The labor participation rate also climbed to 62.9% from 62.7%.
Don’t get too excited.
Here’s the bad news: the unemployment rate increased to 4% from 3.8%.
What happened? More people entered the workforce than were hired.
Wages increased 0.2% on the month, falling shy of the expected 0.3% uptick. On a year-over-year-basis, wages grew 2.7%; the consensus had called for wage inflation of 2.8%.
That wasn’t enough to get a tradeable rise (or fall) out of the market.
On the Horizon
Later this week, we’ll get a couple important inflation gauges.
Most important, the June consumer price index (CPI) will be out Thursday morning.
CPI is tracking above the Fed’s 2% target. A surprise fall or jump in CPI is a proven market mover so, stay alert!
Hit the Accelerator
At Treasury Profits Accelerator, volatility is our friend!
When the Treasury market overreacts to surprise developments (economic or otherwise), we pounce on these short-term trading opportunities.
Happy trading to you,

Lance

The post Who Says You Can’t Have a Trade War Without Volatility? appeared first on Economy and Markets.
July 10, 2018
The Real Facebook Shocker
I can watch the same movie 100 times. But I don’t sit down and enjoy the show from start to finish. I’ll typically stumble across an old favorite when flipping channels, watch 30 to 45 minutes, then turn off the TV.
It drives my wife crazy. Watch it, or don’t. But don’t watch just part of it!
I don’t think of them as movies, or even TV shows. I think of them as old friends.
And there’s none more endearing than “Casablanca.” The film has little action and just a few simple sets, but the storyline and dialogue draw you in.
Visitors to the real Casablanca can visit Rick’s Café, but there was no such establishment in the 1940s. It’s a knockoff meant to play on people’s sentimentality for the movie.
I don’t have to travel to Morocco to get my fix. All I have to do is listen to people talk about companies, and then watch how they invest.
One of my favorite lines in “Casablanca”comes when Captain Louis Renault, who is allowed to win at the roulette table in the café, shuts the place down.
He tells Rick, “I’m shocked – shocked! – to find that gambling is going on here!”
Captain Renault was feigning outrage to appease the Germans, even after he’d profited at the very tables he closed down.
The scene reminds me of Facebook (Nasdaq: FB).
In the past several weeks we learned that Facebook shared user data, including access to friends, birthdays, hometowns, etc., with app developers long after the company claimed to have quit the practice in 2015.
These app developers help Facebook attract and maintain users, which drives ad revenue, the essence of Facebook profits.
I’m shocked – shocked! – to find that Facebook continues collaborating with companies that help it drive revenue!
Give me a break.
What really shocks me is that this story deserves front page status at The Wall Street Journal.
We all know that Facebook, and every other company that makes money on digital advertising, sells everything we give them. And no matter how loudly we protest, we’re willing participants in the transaction.
As I wrote in March and then followed up in April, we want everything for the lowest possible price, and we’re willing to trade our private information to get it.
After revelations in March that Facebook shared our data with the world, the stock swooned. Analysts expected users to revolt and head for the exits because no one wants to share their data. But I didn’t think so.
After a brief dip, I expected Facebook to bounce back because users like the price they pay (zero) for sharing cat videos and pictures of their dinner. We might yell and scream with indignation, but we can’t help ourselves when it comes to sharing online.
Facebook shares fell roughly 20% during the dust up, but are now up 24% since I noted it was time to buy on April 12. The S&P 500 is up 3.8% over the same time, and the Nasdaq is up 8.1%. Go figure.
This isn’t about stock picking. I didn’t personally buy Facebook in early April.
Instead, this is about our national psychology and changing social fabric. It extends well beyond the share price of an online social media company.
As a nation, we’re reinforcing our differences while marginalizing our common interests. The outcome is predictable. We move further apart from those with different views.
Instead of meeting in the halls of social clubs, churches, or at company picnics where we might exchange ideas, we meet in the marketplace, with little more in common than commerce.
Our shared interests are narrowing to what we buy and sell.
On that basis, our standing can be summed up by computing how much money we make, spend, and save. If we can shave a few bucks off the expense category by giving up personal data, so what? We’ll be outraged for a few minutes, then look past it as we check out our Facebook page.
The series of events might not make for a feel-good story, but they were predictable.

Rodney
Follow me on Twitter @RJHSDent

The post The Real Facebook Shocker appeared first on Economy and Markets.
July 9, 2018
Another Drawback to the Housing Bubble
I’ve been ranting for weeks now about it… People don’t understand that sky-high home prices are bad for countries, cities, businesses, and consumers.
And only the 62% of people who already own homes are feeling the “bliss” of the bubble. They’re the ones who want prices to keep going up so they get something for next to nothing…
There’s another side effect of this housing bubble. We’ve seen it in the bubbliest areas for years…
Birth rates fall when bubbles make it even more unaffordable to raise a child.
Long-term data is crystal clear on this. People who move from rural to urban areas, and become more affluent as a result, have fewer kids. They strive to educate and raise them better as a result.
In rural areas, housing costs are much lower and the kids often help on the farms – even after elementary school, historically speaking.
But in urban areas, the cost of living is much higher – along with real estate prices – making it costlier to raise kids in the city. That cost then increases as they get older, especially if they decide to go to college.
But there’s more recent evidence to support this as the second housing bubble rears its head…
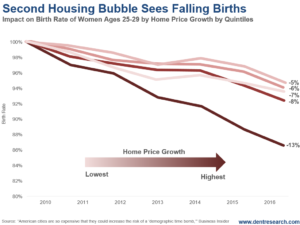
Births have fallen substantially with home prices rising again in recent years.
The five lines in this chart represent the five quintiles of degrees of housing appreciation. The darker the line, the higher the housing appreciation.
The highest quintile, or top 20% for home appreciation, have seen a whopping 13% decline in birth rates between 2010 and 2016. The next highest quintile has seen an 8% decline. The lowest three quintiles have seen between 5% and 6.5% declines.
It’s perfectly clear: Rising home prices correlate with falling birth rates, and the higher, the greater!
That’s just what we need with already falling birth rates and long-term demographic stagnation/decline in the developed countries: A housing bubble that makes that trend even worse.
The sooner this housing bubble crashes, the better…
Despite how difficult it will be for the banks, businesses, and households that own real estate, it’ll be a Godsend for the younger families that are our future. It’ll help lower costs for businesses as well.
All you can do is get out of the way of this inevitable – and ultimately healthy – reset in home prices, which is likely to hit us in 2019, or as late as 2025.
Harry
Follow Me on Twitter @harrydentjr

The post Another Drawback to the Housing Bubble appeared first on Economy and Markets.
July 6, 2018
The American Illness
Our government’s debt is approaching $21 trillion. The stimulus packages, tax cuts, and QE have driven it to new highs.
It didn’t start with Trump though, despite him claiming to have initiated the largest tax cuts.
President Reagan beat Trump to it back during his time in the White House during 1981 through 1989. His tax cuts were, and are still, the largest seen in American history.
GDP grew 6.3% during the years that Reagan implemented the tax cuts.
Meanwhile, debt tripled during that boom period. And over the years, the deficit that was generated then remained.
It’s ridiculous thing to have happened.
Instead of letting surplus balance out the natural deficits, the government kept pushing free money to leverage the economy.
It’s not natural! And it doesn’t work…
Our government doesn’t let our economy work in a natural way, which is similar to how our bodies work when we become sick. Instead of resting and letting the sickness run its course, the government keeps leveraging and fighting against deleveraging, wearing it down until there’s a flat-line state.
This crap doesn’t work!
I’ve much more to say about this, and IES, in the video below. Click here to watch.
Harry
Follow me on Twitter @harrydentjr

The post The American Illness appeared first on Economy and Markets.
Are You Ready for Some Bonus Fireworks?
I hope you all had a safe, fun Independence Day.
But get ready for some fireworks after the fourth!
Market volatility over the past few weeks has been all about trade, specifically China and the U.S. trading tariffs. Those worries haven’t abated.
The Dow Jones Industrial Average has tumbled since mid-June, though the index rebounded a bit last Friday. The S&P 500 has also struggled.
How have Chinese stocks fared?
The Shanghai Composite is down 22% this year.
The stock market – our favorite voting machine – indicates that China is clearly the loser in the trade war, at least so far.
Long-term Treasury bonds, on the other hand, have done much better over the last couple weeks.
The 30-year government bond yielded 3.10% on June 13, the day the Federal Reserve decided to hike rates; on Monday, the long-dated government bond closed under 3%.
That makes six of the past seven rate increases when the yield on the 30-year Treasury has fallen at least a week after the Fed made its move.
What does this action tell us?
Perhaps investors aren’t convinced the Fed is on the right path. Or maybe the market has come to the right conclusions about inflation, economic growth, and future rate hikes.
Danger in the Flatlands
The rosy scenario the Fed paints should have convinced market participants to move long-term rates higher and the yield curve steeper. The central bank’s actions also should have prompted investors to take on more risk and buy stocks.
I remain concerned about the flat yield curve… so should you.
Historically, a flat curve has warned of trouble ahead. And if long-term rates move below short-term rates, a recession is a near certainty. I’ll continue to keep a close eye on the yield curve.
Treasury yields had been stuck between 3.01% and 3.06% for a while.
That changed last week when the saber-rattling about trade tariffs intensified, sending yields to 2.97%
If stocks fall hard in the months ahead, we could see another stampede to the safety of Treasury bonds and an even flatter yield curve. In the worst-case scenario, the yield curve could even invert.
May Home Sales Don’t Move Market
The last real estate crash preceded the 2008-09 financial crisis. Real estate markets have recovered nicely since the that implosion, but signs of weakness have started to emerge.
Sales of existing homes fell 0.4% sequentially in May and 3% year over year. Even though sales of previously owned homes aren’t as important to the economy as new-home sales, this metric provides useful insight into overall housing demand.
New-home sales handily beat expectations for the month, with the number of transactions increasing 14.1% from year-ago levels.
Unfortunately, prices fell by 1.7% on the month and 3.3% on the year.
That’s not a disaster, but it is a mixed bag.
PMI on Fire
On Monday, the Institute for Supply Management released the June purchasing managers index (PMI) for the U.S. manufacturing sector.
The monthly survey queries purchasing managers from about 300 manufacturing companies about the general direction of production, new orders, order backlogs, inventories, employment, and prices.
This forward-looking indicator surprised to the upside, coming in at 60.2. That’s a 1.5 percentage point increase over May. PMI readings above 50 reflect an expansion in economic activity, while values above 58 usually imply economic growth of about 4%.
PMI is a proven market mover, but this upside surprise didn’t move the market much at all. At these levels, stocks have already priced in a lot of good news.
On the Horizon
After Independence Day, the economic releases come fast and furious.
The Fed releases the minutes from its most recent meeting today, providing investors with more insight into the central bank’s views.
I wouldn’t expect the minutes to include any earth-shattering news.
However, Friday might bring more fireworks than the Fourth of July! That’s when the June jobs report hits the tape.
Remember, the May report was a barn-burner, beating expectations for job creation, the unemployment rate, and wage growth.
Treasury yields could spike if this strength continues.
With volatility in the Treasury market somewhat muted, the odds of a market surprise increase.
Happy trading to you,
Lance

The post Are You Ready for Some Bonus Fireworks? appeared first on Economy and Markets.
July 4, 2018
To Celebrate This July Fourth, Start a Fight
I love cheeseburgers. And citrus-infused beer (don’t judge me!) in the hot summer months.
I also love to sail. But when I say that I love my wife, my children, and my friends, everyone knows that I’m using the word love in a different way.
There’s another take on this oft-used word that’s appropriate for today.
I love my country, and I’m unabashedly proud to say it out loud. Love of country isn’t unique to America, although we’ve definitely cornered the market when it comes to enthusiasm!
I love the fact that we’re based on the premise of self-government. We start from the idea that governments serve citizens, not the other way around.
And everyone has a voice.
Everyone.
But lately our fair country has suffered a self-inflicted wound. We’ve stopped debating issues. We’ve replaced healthy and vigorous conversation with insults and dismissal, taking offense at, well, everything.
This didn’t start with the Trump administration, but it certainly has intensified since the last election.
This is un-American. We’re the land of ideas and opportunities, which stems directly from our willingness to stand toe-to-toe with others and fight over ideas.
We search for the truth, or as close as we can get, as well as consensus. At least, we used to.
We can blame the internet, cable news, or even our elected officials. But those aren’t the real culprits.
Muckrakers have existed for as long as the printed word, and we have more than our fair share of what I call the outraged class, like commentators on cable news, often offended college kids, and friends who rant without allowing anyone else to talk.
But they aren’t the ones holding us hostage. We are.
*** [spad] ***
We’ve allowed the outraged class to dictate the terms of conversation. Pick most any controversial topic, and chances are we can’t talk about it.
Halloween costumes, race, college admissions, campus sexual assault, immigration, voting districts, crime, bail, wedding cakes, and now simply going out to dinner (if you serve in the current administration) are all off limits.
Civility calls on us to avoid conflict when possible, but there is a limit, and I think we’ve passed it.
Too many of us don’t engage so that we don’t accidentally offend others. That’s polite, but we’ve come to a point where those who feel offended take our silence as tacit agreement. That’s a problem.
We’re American. Unlike Jack Nicholson’s assessment of Tom Cruise in “A Few Good Men,” we can handle the truth.
If some of the outraged class can’t handle open, measured conversation, well, that’s their issue.
So today, to celebrate America’s birthday, let’s have a barbeque, a beer, and a (verbal) brawl.
We should exercise our freedom to say what we’re thinking, knowing that we’re protected by the very document that outlines how we govern ourselves, the U.S. Constitution.
The best way to stop the outraged class from gaining ground is to remove the scarlet letters they’ve put on every topic. Make the conversations ordinary, with no stigma or horror attached.
And then, do the next American thing. Listen.
Our nation was founded on the principle of self-government. Not my self-government, or your self-government, but ours.
If your friend/neighbor/co-worker/whatever isn’t interested in talking, that’s OK. You tried.
If they chose to scream and rant, well, you know they are part of the outraged class. Bring up a few more topics. Get them really riled up.
You might not reach a consensus, but at least you’ll be entertained.
And then, remember that you can do all of this because of where you live.
Happy Birthday, America.

The post To Celebrate This July Fourth, Start a Fight appeared first on Economy and Markets.
July 3, 2018
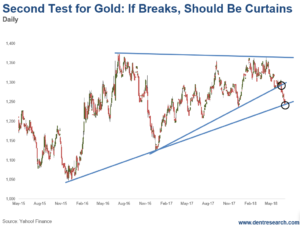
Breakage Below $1,240 Could Be Fatal
Shortly after gold fell to $1,046 in December 2015, I called for a bear market rally that ranged from $1,375 to $1,428.
That low mark of $1,375 has been tested three times since without being able to break above.
That’s not a good sign…
Gold has been steadily down since the third test on April 11th.
I first warned our Boom & Bust subscribers on June 4th that a break below the late 2016 rising trendline would likely trigger a further fall.
Then again on June 15th as the break was occurring, saying that it “may be the last chance to sell gold for any kind of decent profits.”
Gold went straight down from there.
After giving a sell signal at around $1,290, it has now tested a second bottom trendline that extends back a year earlier from the major low of $1,046 on December 11, 2015. Yesterday’s low should be the final support, which will be a “make or break” point for gold.
If it cannot hold here…
If it breaks significantly below Monday’s low of $1,240…
Then the next real support is back at that $1,046 to $1,050 range.
After that, it’ll drop to the lows seen in late 2008 around $700.
Silver is at a similar critical level. It was just under $16 on Monday, and has been tested several times since late 2015.
Gold is oversold short-term, and is bouncing a bit this (Tuesday) morning, as expected.
This bounce could easily go back to $1,270 or so.
But a clear break of this rising bottom trendline ahead would be the last stand for gold.
Mark Hulbert, a financial analyst, measures long-term sentiment in many indices. He doesn’t see gold at levels that invite a major bottom and rally ahead. His sentiment indicator for gold is at -13% on Monday against -30%, which is more ideal for major bottoms.
He says gold bugs are only moderately bearish, but that’s not bearish enough.
The dollar has also been rallying from its lows of 88, and is trying to break above the resistance at 95.
A break like that would be further bearish for gold. Gold trades in dollars and a rising dollar means falling gold prices. The rise in short- and long-term interest rates prompted by the Fed don’t agree with gold either since it yields no interest to compete.
And that looks to continue for many months ahead.
Now, if gold were to mount a strong rally and break above $1,375, then that could actually be a bullish move that projects it towards $1,650 or so.
This is what bitcoin is doing after testing the critical $5,800 to $6,000 levels that I recently warned about.
But, again, that doesn’t look likely.
So, how much do you love your gold?
Hopefully not enough to be like the gold bugs. They’ve so much emotional and ideological attachment…
Despite heroic attempts to stimulate growth and inflation, we’re in a deflationary era until at least 2020, and likely into 2023…
This isn’t favorable for gold since it hasn’t fully deflated from its bubble that peaked in September 2011.
Gold’s bubble deflation requires the minimum of a $700 low – the level seen in the 2008 crash.
It’s bubble action (bubble origin) started in 2005 at $450. That would be the ultimate deflation and low for this bubble.
If that happens, then load up the truck and get ready for the next long commodity and inflation cycle. One where gold could see something like the $5,000 that gold bugs are forecasting – it’s just that they will be dead by then!
If you make the rational decision and sell on the break, you can buy back if it does happen to break convincingly above $1,375 without missing too much.
But again, that’s the unlikely scenario of chance here with greater downside than upside near term…
Harry
Follow Me on Twitter @harrydentjr

The post Breakage Below $1,240 Could Be Fatal appeared first on Economy and Markets.


