
Harry S. Dent Jr.'s Blog, page 44
September 11, 2018
Aston Martin’s $6.5 Billion IPO: Good Timing for Who Exactly?
Aston Martin is riding Ferrari’s bumper with its proposed IPO launch that values the company at around $6.5 billion.
It’s on track to sell between 6,200 and 6,400 cars this year, with projected sales of around $1.26 billion…
So, that looks like a monster valuation, at around five times sales and as much as 60 times earnings, which are only forecast at $113 million this year.
Still, on closer inspection, it’s obvious that Aston and the ultra-luxury market is on a roll and the company’s looking to expand into Asia more aggressively with projections of selling 7,200 or 7,300 cars in 2019.
There’s good reason that this sector is doing so well, although it is hypersensitive to the economy, especially this bubble economy.
In July 2008, I was interested in the new, really sexy, two-door Maserati coupe. I went to the dealer and he told me to put down a deposit that same day to ensure I got one. They were backordered for months. And, of course, I was lucky he “wasn’t charging a premium.”
That was a warning signal to me as the stock bubble back then was already starting to burst.
So, I waited.
I went back to that same dealership in February 2009, just seven months later, when the stock market was bottoming. I got the car with a 25% discount! I got the dealer AND manufacturer’s margin as savings.
Obviously, the high-end car market does very well when the rich are doing well, but that can reverse quickly.
I can see the shape of this luxury car bubble even more clearly from the major updates we are doing to our Spending Waves book, that will be ready for you in October.
The bubble boom, especially since 1995, has made the older and the most affluent richer because they own most of the financial assets that are bubbling.
In turn, cars, especially the luxury segment, are one of the most responsive to bubbles and a strong economy.
Look at the change in where auto spending peaked between the 1996-1998 period and the 2014-2016 period more recently.
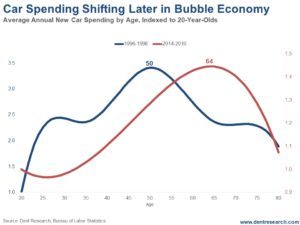
This shows us (as I’m sure some of the other charts we’re updating will) that peak spending has shifted over the last 18 years from age 50 to age 64. Guess what else peaks at age 64? Net worth.
Car buying has been following peak wealth more than peak income and spending!
Splurge and buy that dream car… especially if you’re older, have less obligations, and are richer from huge capital gains!
But, would I buy into Aston Martin’s IPO at these valuations? Especially considering this final and even more extreme stock bubble is likely to peak within a year (if not less)? Or would I buy an Aston Martin car?
No on both counts!
I suggest, as I did in 2008, that you wait until 2020-21 or so, when this next bubble has burst, before you get behind this particular wheel.
Yes, the global ultra-luxury car industry has been on a tear, growing from 62,027 in cars in 2015 to 86,148 projected this year. That’s a 39% increase in just three years.
But that won’t last, especially if I’m right about this greatest bubble bursting starting by early 2020!
Even industry projections are for a slowing of sales down to 85,614 in 2020 as they see this market getting saturated.
Great deal for Aston, bad deal for investors…
And just another sign of a major bubble peaking!

Harry
Follow me on Twitter @harrydentjr

The post Aston Martin’s $6.5 Billion IPO: Good Timing for Who Exactly? appeared first on Economy and Markets.


September 8, 2018
Generation Z: The Rise of the Technologically Inclined and the Socially Impaired (Part I)
When I was a kid, my friends and I would clean out the pantry of all the junk food my mom bought.
My sister was never happy about not having Twinkies to devour, or Fruit Roll-Ups to munch on after her soccer games. And my mom certainly wasn’t pleased with our gluttonous ways since it was doing nothing but burning a hole in her pocket every week.
But we were young. We needed junk food.
One of the most satisfying treats in that pantry was the soda… and we had it all: Coca-Cola, Barq’s, Sprite, Canada Dry, IBC Cream Soda, Welch’s Grape Soda, you name it. Our favorite was Mountain Dew. We’d suck down case after case like it was water.
Life was good until we hit middle school. During sex ed classes we heard a rumor: Mountain Dew makes you infertile.
We didn’t care. We were in middle school. The Dew remained our drink of choice.
Then we were in high school. By then, the rumor had morphed somewhat: Yellow-5 lowers sperm count (and that’s what’s in Mountain Dew).
We still didn’t care. I don’t know many adolescent boys who’d stop drinking such a delicious, refreshing beverage because it might lower sperm count. If anything, such rumors might encourage even more consumption. No high school boy sets out to become a dad that early.
Mountain Dew could almost replace the condom, or so they believed.
Their logic behind that belief was sound, but…
The Decline of Man
While I never found out if there was truth to that “Yellow-5” rumor, just 18 short years later (yes, I’m a Millennial) we’re witnessing the greatest drop in birth rates seen in the U.S. since 1987.
It’s something that Harry has talked to you about before.
Over the years, researchers and epidemiologists have been looking over the data to figure out what’s going on here (and globally). What they’ve discovered is unsettling…
To start, men are more prone to die before women, regardless of age. It’s just how it is.
Studies have also shown a severe decrease in sperm counts per milliliter of semen by more than 50% since 1973. Overall sperm counts were down by about 60% as well.
The cherry on top? Testosterone levels have dropped drastically. And this drop, from what scientist are learning, is starting in utero and going all throughout adult. Even to the extent that the lower testosterone levels are being passed on from parent to child.
In short, men are dying earlier, producing less spunk, and are being born with lower levels of testosterone across the board.
If this trend continues, at this rate, men could lead humanity to extinction in the next 40 years or so…
Thankfully, technology (think IVF and stem cell stuff) is advancing to the point where the human race could still survive, even if men – in all traditional senses – disappeared.
Still, things aren’t looking good for modern men.
And most scientist believe that it all started to go south for our swimmers around the time of the Industrial Revolution, when plastics began to infiltrate every aspect of our lives. Foreign chemicals and compounds, like BPA, have taken their toll on our little soldiers.
Take care, take care.
Coty
P.S. Smoking a reefer and drinking some whiskey alongside of Joe Rogan in his podcast. Elon Must has fallen off his rocker! Here’s what Rodney thinks about that and its impact on Tesla investors…

The post Generation Z: The Rise of the Technologically Inclined and the Socially Impaired (Part I) appeared first on Economy and Markets.
September 7, 2018
Why Politics and Financial Engineering Are Failing
Our government is in chaos.
It’s failing.
And all the financial engineering and manipulation we’ve witnessed since 2008 (aka QE) is coming undone… which Dr. Lacy Hunt will talk passionately about at this year’s Irrational Economic Summit in Austin, Texas. Will you be there to hear what he has to say and shake his hand?
It’s all part of a critical revolution that’s begun… a revolution I started talking about back in early 1998. It’s called the Network Revolution and it’s going to transform how we run society, corporations, even government.
This is the beginning of the biggest political and social revolution in history.
Listen to my video to get the details.
Harry
Follow me on Twitter @harrydentjr

The post Why Politics and Financial Engineering Are Failing appeared first on Economy and Markets.
September 6, 2018
More Signs of a Correction Ahead: But How Soon and How Much
The broader stock market via the S&P 500 finally broke to new highs in August, while they drifted insignificantly lower on Wednesday.
And as Adam O’Dell recently commented, that typically means substantially higher highs ahead… like 13% plus.
What does this mean for my great crash forecast?
Well, my favored scenario right now, with the strong tax cuts Trump handed us, is that the great bubble peak comes in late 2019, not now.
There are also many indicators to support this, including my new 90-year “Great Reset and Bubble Buster Cycle,” which Andrew Pancholi, my co-author on Zero Hour, first suggested to me. I have since found more reasons to get serious about its importance.
It’s a cycle that brought us the two greatest resets since the Industrial Revolution: the first in 1873 to 1843, the second from 1929 to 1933.
But there are some indicators that suggest the possibility that markets don’t go a lot higher before they peak. The more trusted indicators of the past may not work that well now that massive government intervention has turned everything upside down. Markets are “not so free” anymore!
In the September Boom & Bust issue I discuss both scenarios and talk about the potential of a surprise crash just ahead. Let’s explore that a little now…
Bigger Than Before, But Not Imminent
The Smart Money Flow Index strongly suggests that we’re heading toward a larger crash than the prior two, but it’s not necessarily imminent. They have not been buying into the rally of 2018!
Goldman Sachs has a Bull/Bear Sentiment indicator that is now at an extreme 75% bullish reading. It hit a 70%-bullish level near the 2007 top and 72%-bullish level near the 2000 greater bubble top.
Both of these indicators warn of a major top coming, not a minor one.
But I’ve been warning this for years now, so this is nothing new!
Really, the question is: WHEN?!
There is a nearer-term indicator warning of at least a minor correction ahead, even though most stock indices have made new highs. This could just be another correction on the way up… but also, if it continues to build, it could be another warning of the larger crash ahead.
When stocks make new highs, the volatility indicator (VIX) tends to make new lows. When new lows in the VIX don’t confirm new highs in stocks, that is a divergence that suggests some level of correction is coming.
We’re seeing this divergence “starting” to form now, as the chart shows…
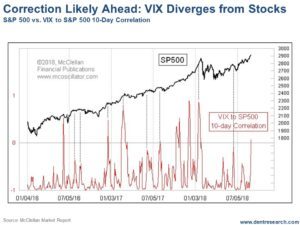
Most analysts typically look at periods when this happens, but Tom McClellan of the highly respected McClellan Oscillator indicator has come up with a better way to measure this divergence (and how it builds) more directly and obviously.
When his 10-day Correlation Indicator spikes up, it means lower volatility in the smart-trader options market is NOT confirming higher stock prices.
But, as you can see in the chart, such a counter market trend tends to build typically over three, or even four surges before it peaks, and stocks finally correct.
We’re only in the second surge right now. That’s why I emphasized “starting” to form before.
Possible Triggers…
My overall reading of these indicators (and more) is that we have at least a minor setback just ahead. But my more bullish scenario still favors Adam’s historical analysis of a near 15% rally ahead, well into 2019… a rally that could see the Dow hit as high as 30,000!
But we can’t ignore Trump’s political meltdown and legal storm or the trade wars… They’ll impact the markets… and maybe now, much sooner than later.
In this manipulated, un-free market, it’s going to take a few more months to get clearer indications on likely outcomes – especially after the mid-term elections. That’s why this is the theme of my presentation at this year’s Irrational Economic Summit in Austin, Texas (October 25-27).
It’s also why I discuss this in my September issue of Boom & Bust.
And it’s why I also focus more deeply on that 90-year great reset cycle in my upcoming issue of The Leading Edge, where I look more in depth at the most important issue facing investors: Are we about to peak near term in the final phase of the greatest stock bubble in history… or do we have a more minor correction in the next two to five months and then see the final peak on our now most powerful 90-year cycle around late 2019 (which would create a nearly identical event to the late 1929 to 1932 crash 90 years ago)?
That’s the trillion-dollar question for the U.S. and global economy!
It’s the million-dollar question for your family, investments, and business.
We’re going to be on this like a fly on… and when we see or hear anything that brings more clarity to this, we’ll let you know immediately.
Harry
Follow me on Twitter @harrydentjr

The post More Signs of a Correction Ahead: But How Soon and How Much appeared first on Economy and Markets.
September 5, 2018
Bullseye!
According to Federal Reserve Chair Jerome Powell, the U.S. economy is doing just fine.
And, because of fiscal stimulus, slowly rising incomes, and high levels of consumer and business confidence, Powell believes the current strength will persist.
That’s some of what Powell said during his speech at the recent gathering of global economic and financial eggheads in Jackson Hole, Wyoming, hosted by the Federal Reserve Bank of Kansas City.
If we live in a bubble where the economy grows at 4%, and the calculation for unemployment just keeps getting better, while wages and inflation are slowly creeping higher, Powell could be right in what the Fed’s prepared to do.
That’s to hike rates later this month and once again by year’s end.
There should also be a couple more hikes next year… if all goes according to plan.
Inflation Is on Target… Finally
The personal consumption expenditures index – also known as the PCE Index – was up 2.3% year over year in July. The core index also moved up to 2%.
After six years of extraordinary measures, we’ve finally hit the Fed’s inflation target!
The July Personal Income and Outlays report included even more good news for the Fed.
Personal income was up 0.3% following a 0.4% rise in June. Personal outlays – or “spending” – were up 0.4%, consistent with June.
And core inflation – or the prices of everything except food and energy – ticked up a modest 0.2%.
Housing Gets Weaker
The housing market is in trouble, with two more reports last week confirming the trend.
The S&P CoreLogic Case-Shiller 20-City Composite Home Price Index showed a meager 0.11% month-over-month increase.
And year-over-year growth slowed to 6.31%. That’s the weakest reading in nine months.
David Blitzer, the chair of S&P’s index committee, noted that, even as prices climb, the market is softening.
Sales of new and existing homes have been relatively flat over the last six months – and that’s with increasing inventories.
Meanwhile, the National Association of Realtors’ pending home sales index – a pretty accurate look-ahead at “official” existing home sales – came in 0.7% lower for July. The market expected a flat reading.
The next set of housing data won’t come out until the third week of September – just ahead of the next Federal Open Market Committee meeting.
Maybe after the FOMC boosts rates we’ll hear something about housing.
So, if the Fed continues to ignore housing, we can count on another rate hike in September and maybe another by year’s end.
Friday morning, the Bureau of Labor Statistics will release its Employment Situation report for August.
The Fed is hoping to see a pop in wages to justify its planned course of interest-rate hikes.
We’ll be watching for a surprise in either direction.
Uncertainty is a good thing for the well-prepared; indeed, interest-rate volatility is what we exploit in Treasury Profits Accelerator.

Lance

The post Bullseye! appeared first on Economy and Markets.
Trump’s Troubles
Whether you like Trump or not, one thing is clear: He’s in trouble.
Only his strongest supporters seem to still want him around. They elected a non-politician to change the system. To them, he’s doing just that.
They’re not as concerned over his contradictions and the growing legal testimony against him, even if everyone else is.
After Manafort’s conviction on eight out of 18 counts, and Cohen’s guilty plea that stated Trump did direct him to make payments that impacted the election, Trump’s disapproval ratings are the highest ever for him at 60%, with 53% strongly disapproving.
That’s higher than any president since 1948.
[inset Chart]
More troublesome than that, 63% support the Mueller investigation with a majority at 52% strongly supporting it. That means there will be hell if Trump fires him.
Trump’s Loss of Support
Out of the 49% in support of Congress beginning the impeachment proceedings, 57% are women. It’s not much of a surprise considering the videos and recordings that have surfaced, as well as the Stormy Daniels scandal…
And yes, this all does – and will – have an effect on the economy and markets at some point.
But Democrats might want to be careful about an outright impeachment move. There’s 46% against that… do they really want Mike Pence in place of the Donald? Think about it!
Perhaps least shocking of all is that 43% feel like corruption in Washington has increased since Trump won the presidency. Only 13% feel it has decreased.
So much for draining the swamp.
Out of it all, 66% say Trump shouldn’t pardon Manafort.
And 18% say he should.
Even the one juror that saved Manafort the 10th out of 18 counts warned Trump not to pardon him.
Support for the Donald is strongest when it comes to handling the economy. Still, that’s only 45% favorable versus 47% unfavorable.
The Watergate Parallel
Trump’s growing impeachment issues are following Nixon’s Watergate on an almost exact 45-year cycle.
I talked more on this point last Friday.
Watergate erupted during one of our biggest cycles. John Dean claimed Nixon approved the cover-up in June 1973. That’s comparable to Cohen implicating Trump in the sex scandal payments in August – 45 years and two months later.
However, there’s not been any major stock market reaction yet…
Before Dean’s testimony, John Mitchell was implicated and Nixon’s two top aides – H.R. Haldeman and John Ehrlichman – resigned.
The market finally reacted abruptly with the “Saturday Night Massacre” when Nixon fired the Special Prosecutor on December 18, 1973, out of desperation. In the already economically charged crash of 1973-74, the worst came between then and October 1974, two months after Nixon was forced to release his tapes and promptly resigned in August 1974.
If we mirrored this rough timeline, Trump fires Mueller between December and February, and could be forced to resign between August and September 2019.
September 2019 is also the anniversary of the 90-year Great Reset Cycle that saw the greatest crash in U.S. history from September 1929 to July 1932. I’ll be talking more about that in the September issue of The Leading Edge.
It was Trump himself that just said if he is impeached, the markets will crash.
I’m not saying that this will happen, but we would all be fools to ignore this growing political challenge that parallels Watergate.
If these events accelerate sooner rather than later, we could see stocks top in the next few months rather than more like around September 2019 on the powerful 90-year cycle.
And the same goes for the China trade war, if it continues to heat up instead of being resolved. Trump has the leverage on them, but they appear to be as stubborn as he is.
Keep in mind that polls show the Democrats have the widest advantage in mid-term vote preferences – 52% to 38% – since 2006 when they took over both houses.
I doubt the markets like that either.
Harry
Follow me on Twitter @harrydentjr

The post Trump’s Troubles appeared first on Economy and Markets.
“Mostly” Made in America
In honor of Labor Day, President Trump tried to give workers across this land something to celebrate – the new trade deal with Mexico.
The proposal requires cars to be made at least 75% in the trade bloc of the U.S. and Canada (considered domestic) plus Mexico to escape tariffs, and for at least 45% of the cars to be made in areas with wages of $16 or more.
Clearly if we’re setting those thresholds, then we’re driving (pun intended) more auto production to the the U.S. Why else would we choose those levels?
After looking at the numbers, I can only guess that we picked percentages and prices that were the most favorable to Corporate America, not Working America.
To illustrate my point, here’s a little quiz.
Try to put the following trucks sold in the U.S. in order, ranked by the highest percentage of parts made domestically.
Chrysler Ram 1500
Chevrolet Colorado
Chevrolet Silverado
Ford F150
Honda Ridgeline
Nissan Frontier
Nissan Titan
Toyota Tacoma
Toyota Tundra
Given that we hear a lot of chest-thumping about Made in America and patriotic, flag-waving advertising from truck makers about keeping America strong, you’d expect these high-profit vehicles to be pounded out right here at home.
Well, it doesn’t exactly work that way.
While the truck with the lowest percentage of American-made parts is the Nissan Titan at 45%, the Chevy Silverado is close by at 46%.
The truck with the highest percentage of domestic parts is the Honda Ridgeline at 75%.
Allow me a truck review for a moment: I’m a fan of the Ridgeline for functionality, but it doesn’t quite carry the cache of a decked out Ford F150 4×4 SuperCrew (which happens to be my daughter’s vehicle of choice).
A lot of that Ford, in fact 65%, is made here at home, which matches the percentage of the Toyota Titan made here.
Much of the rest of these vehicles come from Mexico, so none of them would be subject to the new tariff when it comes to country of origin.
And, amazingly, we set the cutoff for the amount of the car that must be made in a country with wages of at least $16 per hour (45%) – just below the amount of Chevy Silverado made domestically. It’s hard not to see that as intentional.
Very few cars fall under the new tariff rules, and those that do are not high-volume money makers.
So after months of posturing and strong words, we ended up with a trade deal that effectively acts a lot like the existing one, though don’t call it NAFTA.
There are some changes, like a six-year review and a 16-year term with the ability to renew, and it’s harder to avoid penalties for breaching the deal.
But maybe we should be thankful. We should all raise a beer (or other beverage of choice) on this holiday that President Trump didn’t press for dramatic changes that would force auto production back home.
If he had, it’s possible some of the millions of working Americans involved in car manufacturing might have made more money, but it’s certain that all of the car buyers would have paid more for new American cars.
So this Labor Day, relax, enjoy the end of summer, and if you feel like it, stroll across a new car lot and pick out a vehicle that’s “mostly” made in America.

Rodney
P.S. Here’s the answer key to the quiz:
Percentage of Domestic Parts
Nissan Titan
45%
Chevrolet Silverado
46%
Nissan Frontier
50%
Chevrolet Colorado
51%
Chrysler Ram 1500
57%
Ford F150
65%
Toyota Tacoma
60%
Toyota Tundra
65%
Honda Ridgeline
75%

The post “Mostly” Made in America appeared first on Economy and Markets.
August 31, 2018
New Highs, Same Overdue Correction
The stock market broke to new highs — this, of course, we learned about last week.
As it stands, the S&P 5oo and the Nasdaq have hit these highs.
The Dow and NYSE have yet to breach record highs.
And all the stocks are slowing down.
September is a slow month. This is a known fact in the investing world.
But what’s not to be ignored is the fact that we are long overdue for a correction.
Harry’s been saying this for weeks now.
This loss of momentum could be a signal for that coming correction.
Not on its own though.
With Trump under siege by the Mainstream Media for his dealing with Stormy Daniels, Michael Cohen, and Paul Manafort, things could crash sooner rather than later.
There’s talk of impeachment, and many of those who once wanted Trump in are now displeased with his performance.
They want him out.
For now, the markets remain strong.
Though the outcome of the current political situation could shift the markets at any moment.
Harry has some updates for you now and will continue to keep you in the know.
Click here or the video below to see what he has to say.
As the S&P 500 and Nasdaq break into new highs and the DOW gets closer, stocks are beginning to slow down a bit, possibly signaling the overdue correction. How telling will this next correction be?
Posted by Economy and Markets on Friday, August 31, 2018

The post New Highs, Same Overdue Correction appeared first on Economy and Markets.
August 30, 2018
The Bitcoin Train
A few weeks ago on CNBC, an analyst compared the bitcoin bubble to the early internet bubble.
What?!
We’ve been saying that since late December 2017, when bitcoin was just starting to crash.
And oh, did it crash.
It dropped 37% in just two weeks from December 16 through the 30th.
After a brief bounce – there was another 63% drop into February 5, 2018. In less than two months, it was down 69% from the top…
I’ve never seen that before, but I know how quickly bubbles first burst when they finally do.
Seeing as it’s old news to us that the two big bubbles are similar, let’s recap what we see…
The Similarities to the Internet
I’ve warned about what happens when bubbles first burst and why to get out a bit early, rather than a bit late. They suck everyone in, then the smart money pulls the plug.
It was that way with the Internet. It was that way with bitcoin.
Bitcoin’s bubble was extreme. So, it’s first crash was equally dramatic.
My argument from the beginning was that bitcoin’s a major new trend. It’s like the internet 2.0.
Kevin Ashton, a keynote speaker at our Irrational Economic Summit, coined the term “The Internet of Things.” How does the internet account for things of value and protect their security? That’s what it is failing at after exploding knowledge and communication for information.
Bitcoin had its first bubble based on nothing but a vision, albeit a real one down the road. You get invisible coins – which don’t give you ownership in the company.
The first internet bubble saw stocks with little sales and almost no earnings soar for no good reason, except that “this was the next big thing.”
And it was. But not until many years and almost two decades later.
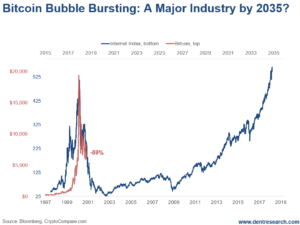
Look at this chart based on the internet index back to 1997 compared to bitcoin in recent years.
As most will remember, these early internet stocks made little in sales. Rarely did they have profits… What?
Yet they got stratospheric valuations right off the bat (400 times earnings for AOL). Internet stocks rose seven times in just 1.4 years between late 1998 and early 2000, then crashed 956%.
The first hit was a 56.5% drop between March 9, 2000 and May 25 – in just 2.5 months.
The second whack was down 83% from December 5 into April 3, 2001 – just 4 months – and down 91% from the top.
It finally bottomed in late 2022 down 95%.
The internet index was slow to come back at first, but a second bubble developed after the March 2009 bottom.
It reached all-time highs earlier this year…
That would have been the trend to buy into.
It took 18 years for the 2000 bubble highs in the internet to be exceeded.
If bitcoin follows a similar path, it would hit new highs by 2035.
It’s amazing – and just bat-shit crazy – that investors would so heavily value a new sector, in its infancy, at what it will be worth in its maturity decades later!
Bitcoin made the internet bubble look like child’s play. It only emerged in the late stage of this bubble, like the internet did in the late 1994 – early 2000 tech bubble. And it skyrocketed about 20 times in less than one year in 2017.
Bitcoin: Harry Warned You Before
I’ve warned before about bitcoin testing its major support since the July 1 lows of $5,537, and other lows back into the latter part of 2017.
That’s also around its current mining cost. A sharp break below there could take bitcoin down to its bubble origin around $1,000, similar to the 95% crash of the internet…
However, I have also commented that bitcoin and cryptocurrencies are acting a bit more like the gold bubble.
Gold did finally burst big time in early 2013, and has continued to mostly drift down ever since. It bounced back to $1,375, which we warned about – but said it was only a bear market bounce.
Recently, it has fallen as low as $1,173…
But gold has not burst as fast or deep as most other bubbles at this stage and will, at worst, retest the 2008 crash lows around $700. I see less likelihood for that $400-$450 bubble origin retest.
Bitcoin and cryptos may find support in this $5,000 to $6,000 range. If not the next targets are more like $3,000, and as low as $1,000.
It should be clear by now that this is not a game for everyday investors.
And one not even for most traders.
I’d look to buying the best remaining crypto currencies and companies when the next broader stock and tech crash appears to be bottoming, likely somewhere between 2020 and 2022. They’ll be far and few by then.
The Turkish Lira Slump
Recently, I wrote in Economy & Markets about Turkey and the trouble it faced with its current government.
Erdoğan was meant to modernize the nation. Instead, he’s ruined its economy.
Yesterday, the Turkish lira dropped again after only briefly stabilizing.
The reason for this is tied to Moody’s – a rating agency – decision to downgrade the credit rating of 20 Turkish financial institutions.
It all comes about due to higher risk, which is bound to happen when a currency crashes!
But it’s not merely a fault on Erdoğan’s part – even if he had a heavy hand in the situation. The issues in Turkey started coming to light when Trump smacked a number of sanctions against Turkey as an act of retaliation when they refused to release Andrew Brunson, an American pastor who was held by Turkish authorities due to the belief of his support for the Kurdistan Workers Party and the Gulenist movement.
Both of these parties came about due to the failed coup against Erdoğan.
After knowing the lira dropped more than 40%, who could blame them for trying…
We’ll be watching Turkey closely as the situation continues to unfold.
Harry
Follow me on Twitter @harrydentjr

The post The Bitcoin Train appeared first on Economy and Markets.
August 29, 2018
Guided By Stars? Really?
If there were any lingering doubts the Federal Reserve intends to boost its benchmark interest rate by another quarter point next month, Chair Jerome Powell settled them last Friday.
Powell, during his speech at the annual gathering in Jackson Hole, Wyoming, hosted by the Federal Reserve Bank of Kansas City, established a clear case that our economy is ready for “normalization.”
He also provided an interesting glimpse into how the Fed makes policy decisions.
In sum, the Fed is cautious – and that reflects a level of uncertainty about outcomes of policy decisions that will create opportunities to profit.
According to Powell, the U.S. economy has strengthened substantially; that’s reflected in the fact that unemployment has declined for almost nine years and is now near a 20-year low. Most people who want a job can find one.
Meanwhile, inflation is close to the Fed’s 2% target after six years of running below that level.
And, because of fiscal stimulus, slowly rising incomes, and high levels of consumer and business confidence, Powell believes current strength will persist.
Powell noted that “navigating by the stars can sound straightforward. Guiding policy by the stars in practice, however, has been quite challenging of late because our best assessments of the location of the stars have been changing significantly.”
That’s a signal Powell also believes traditional methods of determining policy aren’t working today.
A particular problem the Fed is encountering is how to calculate the level of employment where rising wages begin to fuel unconstrained inflation.
The traditional “Phillips Curve” model hasn’t worked of late.
The Fed is on the horns of a dilemma.
Unemployment is far below the longer-term historical rate. So, why isn’t the Fed tightening policy more sharply to stave off an overheating economy and get in front of inflation?
At the same time, there are no definitive signs inflation is “breaking out.” So, why is the Fed tightening at all, when to do so risks job growth and economic expansion?
As Powell framed it amid the splendor of Jackson Hole, the current path of slowly but steadily tightening monetary supply policy will let the good times roll without fear of inflation.
The chair also identified longer-term, structural challenges beyond the reach of monetary policy:
Real wages for lower-income workers have grown too slowly in recent decades. Economic mobility has declined and is now lower than in most advanced economies.
The budget deficit is on an unsustainable path, which will become more important as a large part of the population retires.
There’s no telling when or if the economy will break out of the low-productivity mode of the last decade, which has to happen before incomes will rise meaningfully.
According to Powell, the U.S. economy is doing just fine. And the Fed will continue its current course until either the economy or inflation collapses.
At the same time, his “stars” analogy revealed that a lot of “gee, we really just don’t know for sure anymore” is happening inside the Eccles Building.
And if the Fed’s confused, you can expect more volatility, especially in the Treasury bond market.
And that’s a good thing for people who do have a rational plan.
Lance

The post Guided By Stars? Really? appeared first on Economy and Markets.


