
Harry S. Dent Jr.'s Blog, page 43
September 24, 2018
The Hardest Part of Forecasting
Today I want to talk to you about the hardest part of forecasting…
There’s an important distinction between our long-term forecasting, which is deterministic – we can project when spending will peak and cycles will bottom – and short-term forecasting, in which we must take into consideration so many more variables.
That’s why I always have two scenarios. And it’s essential to do this because there’s no way to predict the short term as accurately as we can the long term.
As it happens, right now we have numerous scenarios playing out, so listen to this week’s video to get all the details.

Harry
Follow me on Twitter @harrydentjr

The post The Hardest Part of Forecasting appeared first on Economy and Markets.


September 20, 2018
Trump, Treasurys, and You
The thing about politics is nobody knows anything. We learned that in November 2016.
There’s a particularly high degree of “know-nothingness” in Washington these days. That creates a lot of uncertainty.
Markets are reacting to it… and that’s really good news for us, actually, because it makes our work that much easier.
I don’t much care either way for “MAGA,” walls, coal, or even tariffs, for that matter.
I do concern myself with how those things might impact markets – the U.S. Treasury market, in particular.
Usually, we focus on stuff like the upcoming reports on the housing market. We’ve seen signs of weakness in June and July, so August will provide an important set of data.
But, still, markets are moving more than ever to political winds.
We saw that on Monday, as stocks opened lower on worries of an escalating trade war with China.
And, yet, this morning the S&P 500 Index gapped up to a new intraday all-time high.
Volatility: It’s our friend.
Of course, it’s not so much the S&P 500 we’re concerned with. It’s yields on U.S. government debt we follow.
They move, too, sometimes a lot…
But volatility in the Treasury market is our friend – and it can be your best friend…
I’d love to show you how. In fact, I’m hosting a presentation on September 25 where I’ll explain the simple and easy system behind a “two-hour work year”…
Data Dumps
Our attention now is on that housing data.
It’s not likely to have much impact on the September 25-26 meeting of the Federal Open Market Committee. The Fed is pretty much locked in for another quarter-point rate hike next week.
But inflation pressures did abate last month.
Both the headline and the “core” Consumer Price Index (CPI) readings came in below consensus forecasts. Headline and “core” producer prices were also short of estimates.
Headline CPI came in at 0.2% against an expectation of 0.3%. “Core” CPI, which excludes food and energy prices, was up 0.1% versus a consensus estimate of 0.2%.
August’s Producer Price Index (PPI) declined by 0.1% versus an expected gain of 0.2%. “Core” PPI was also down 0.1% against a forecast gain of 0.2%.
And, while retail sales were up in August, it was the smallest gain in six months.
Nonsense and Cents
More weakness in a critical part of the broader economy might/should give our monetary policymakers pause.
But we don’t know how the Fed will interpret the data. Indeed, the Fed doesn’t know how the Fed will interpret the data.
It must be concerned about raising the cost of money this late in a recovery cycle. But it also must be concerned about having “dry powder” in case of another downturn.
“Dry powder” means “room to cut interest rates,” in short. So, it has to raise rates before it can lower them.
Makes perfect sense…
Well, I’m glad for the nonsense.
Because it’s the uncertainty – and the volatility that comes from it – that creates opportunity.

Lance

The post Trump, Treasurys, and You appeared first on Economy and Markets.
September 19, 2018
Why This China-U.S. Trade War Could Last 20 Years
I agree with him!
The richest man in China, Alibaba co-founder Jack Ma, reckons the trade war is the beginning of a long-term battle for supremacy between China and the U.S.
He’s sees no effective short-term solution to this big global issue.
China needs to strengthen its economy to fulfill its long-term shift to stronger domestic consumption while focusing on the real global growth markets in Southeast Asia, India, and Africa.
That’s what its huge “belt and road initiative” and global investment program is all about.
Ma’s view is likely the same as the Chinese government.
If the U.S. wants to play hardball here, they’ll just make that shift to focusing on those other markets harder and quicker, beating the U.S. and Europe to them.
Currently, Trump has the near-term advantage. His September 17 hike to tariffs on $200 billion of Chinese goods – 10% on September 24 moving to 25% on January 1, 2019 – is 3.3 times China’s retaliation of tariffs on $60 billion of U.S. imports since September 18.
But China’s top-down government has always had a long-term time horizon. That’s why they are being so stubborn.
And like I started by saying: I couldn’t agree more with Ma.
Here’s a prominent chart from my recent Zero Hour book with Andrew Pancholi of the Market Timing Report…
This chart shows that the second great surge in globalization from 1949 to 2008 has already peaked and will see a multi-decade regression similar to the one between World War I and World War II.
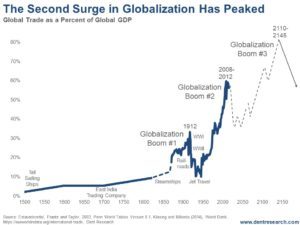
The first wave peaked in 1912, just before WWI.
The biggest crash in global trade came during that war because the modern world that dominated GDP was fighting… and warring nations not only don’t trade with each other, but they’re too busy producing war goods to export much.
That was a HUGE boon to the emerging U.S. We exported heavily to the allies even after joining the war later.
Then in the Great Depression, countries reacted like today. With a shrinking pie, they became increasingly protectionist. There was even a populist revolution back then, that Hitler and Mussolini led.
The tariff wars then just made the Great Depression worse. That was the second shock to global trade. The third shock in WWII was the mildest as global trade had already contracted over 60%.
The second and even steeper surge in global trade came after WWII into around 2008. The decline since then has only been minor but the steepest crash in trade here is likely to come in the next global depression we forecast for 2020 to 2023-24.
Of course, there are likely to be repercussions for many years to follow as China takes the biggest fall from massive overexpansion and debt implosion…
Then the third surge should take us to full globalization, urbanization, and middle-class saturation by around 2145.
Three very projectable cycles converge and peak between 2140 and 2150:
Urbanization at 90%.
The 500-year Mega Innovation Cycle.
And the 165-East/West Cycle with peak Asian dominance by then.
As much as demographic cycles of aging and falling births project increased slowing forever into a black hole… that is NOT going to happen as these other cycles are more dominant and would strongly suggest another revolution in our life expectancies in the decades ahead that would trump falling births!
But near term: don’t take a likely compromise in the U.S./China trade war as sustainable.
This is a bigger trend – and a necessary step on the way up to greater globalization and prosperity.
Harry
Follow me on Twitter @harrydentjr

The post Why This China-U.S. Trade War Could Last 20 Years appeared first on Economy and Markets.
September 18, 2018
Dow 30,000 or Dow 6,000?
The Trump rally into January 2018 looked like the classic final blow-off top.
It had been advancing in a clear channel, then it broke above that in a classic “overthrow” pattern, followed by a sharp correction.
Was that the beginning of the final and greatest crash?
Maybe not, which is why I detailed, in the September issue of Boom & Bust, the two scenarios I believe we face in the months ahead.
My first problem with the idea that we saw a top at the beginning of the year was that past major bubble peaks in stocks have averaged a 42% crash in the first 2.6 months. This has been the case for seven global stock bubbles since 1929. The range for the initial crash is 30% to 50%.
But, this time around, the S&P 500 only crashed 12% and has moved mostly sideways, with an upward bias, since then.
My second problem was that such extended sideways patterns, following a strong advance, tend to break up in the same direction to new highs.
In late August, the S&P 500 followed the Nasdaq’s break to new highs. The Dow was just 3% behind the S&P in doing that. Only the broader NYSE lagged further than that.
Markets spent some time in the red on Monday, but as of this morning they were back in the green, and we’re still near record highs.
So, is this that new high that precedes a sharp 40% or so crash in the coming months, forbearing the next great bubble crash?
Or will stocks pull back more modestly after this break up, while the Trump rally continues well into 2019 before we see an even bigger blow-off top – like Dow 30,000?
Those are the two most likely scenarios as we approach the late stage of the longest bull market rally without a 20% correction.
As of yesterday, this rally from early March 2009 has lasted 3,480 days. That’s longer than the longest one from late October 1990 into early March 2000.
By that measure, we’re in new territory for bull markets.
And many classic indicators are not pointing to a major high and crash ahead.
The advance/decline line measures how broad the rally is and that tends to narrow in the late stages of a major bull market. That line has continued to make new highs with this rally and is saying it’s still healthy.
However, the FAANG stocks (high-tech large-cap leaders) are showing such narrow buying, while the tariff and trade war threats favor small caps over large, as they are less exposed. That could throw this indicator off.
The yield curve – 10-year Treasury yields minus six months – tends to invert before a major top and recession. This is approaching but has not occurred yet. And even if it does, it can be many months before the downturn starts.
Gross domestic product growth is accelerating out of the 2% doldrums of past years. Normally it would decelerate a bit before a major top.
The Fed is raising rates, which will eventually trigger a top. So far inflation and long bond rates haven’t risen enough to signal danger, as investors expect rates to rise when economic growth accelerates.
Household net worth just passed $100 trillion after peaking at $69 trillion in late 2007 and $45 trillion at the 2000 top. Compared to GDP, it has risen from just over 4.4 times in 2000 to 4.8 in 2007. Now it’s just over five times that amount.
This is another good sign the bulls tout, but I think this is one of the biggest reasons that the economy has been holding up amidst declining demographic trends and record levels of debt.
Central banks – and now Trump through tax cuts – have been able to dramatically goose financial assets and net worth while real wages continue to stagnate or fall, all the while economic growth has been subpar.
But as we’ve seen thus far and throughout history, such bubbles are fleeting and always burst.
Trump has been proposing a second tax cut through adjusting capital gains for inflation that he may be able to force through without going through Congress. That will again favor the top 1% to 10%, but not the broader economy or his supporters.
Suffice it to say, the broader consensus is that this market is not ready to top yet.
But I’ve a sneaking suspicion that we may see a surprise crash just ahead; one that almost no one expects. It’s one of the two scenarios I explore in the September issue of Boom & Bust.
The actions of stocks and some key indicators over the next few months should tell us which scenario is more likely to come…
I urge you to read the latest issue of Boom & Bust for all the details.
Harry

The post Dow 30,000 or Dow 6,000? appeared first on Economy and Markets.
September 17, 2018
Did You Agree to This Tax?
There have been many stories popping up about the tight labor market and how businesses are running out of people to hire.
This is a result of White House policy that limits working and student visas, which has created a bottleneck in the supply of labor. The goal is boost wages and bring more Americans into the work force.
We’re talking about temporary worker migration here… NOT immigration.
This is a big issue and it’s changing our economy, so I called Rodney to discuss this issue and the implications. Possibly the biggest is that we’re all going to end up paying a tax that none of us signed up for, in the form of rising prices for consumers. Or is it worth it paying a bit more for goods if it means hiring an American worker at a higher wage?


The post Did You Agree to This Tax? appeared first on Economy and Markets.
Generation Z: The Rise of the Technologically Inclined and the Socially Impaired (Part II)
Last week, in “Generation Z: The Rise of the Technologically Inclined and the Socially Impaired (Part I),” I talked about my fond, Mountain-Dew-soaked childhood memories, the rumored side effects of Yellow-5 lowering sperm count, and the actual data that shows modern men have not only lower sperm count, but lower testosterone levels as well.
Ever since the Industrial Revolution, men’s swimmers have been drowning. Foreign chemicals and compounds have taken a toll on our bodies without anyone knowing.
Now we face the challenge of widespread infertility, which may peak within the next 40 years.
But what does any of that have to do with ?
Demographics, my friend. It’s all about demographics.
Rise of the Social Inept
We’ve come to the point when a new generation is beginning to enter the workforce.
Generation Z are the next up to bat. They proceed the Millennial generation (which I am a member of).
Speaking of, in some ways Gen Z may be better than my generation, who mostly grew up during the technological revolution… who witnessed 9/11 and still remember… who were old enough to understand the 2008 Financial Crisis, but perhaps weren’t at the age where it’d influence their behavior.
On the other hand, Gen Z grew up during the 2008 Financial Crisis, but were at the age of impact. They were raised with smartphones in their hands, where everyone was always accessible, and when physical social interaction was drastically limited due to these technologies.
And because of the limited social interaction — bringing about an ineptitude in how they handle day-to-day dealings with actual people — they are having much less sex than we Millennials do.
Surveys have shown that Gen Z’ers don’t have the ambition to be entrepreneurs like those of previous generations, and instead are opting for jobs with guaranteed safety.
Instead of attempting to gain acceptance into the more prestigious schools, they’re opting for local, cheaper colleges to avoid the burden of debt they’ve witnessed the Millennials bury themselves in.
Growing up in the turbulent times has made them, by and large, less risky, and more focused on simply getting the job done.
Even at young ages, many worry about not being able to find a well-paying job due to the overwhelming competition of today’s job market.
When it comes to the hiring process, many companies and corporations — such as Ruby Tuesday — are turning to training videos that are formatted to resemble YouTube. It’s a response to the fact that physical interactions are more difficult for Gen Z’ers, and they learn more quickly through a visual walkthrough that cuts out the human element to it. (Although I shudder at what that means for customers at the mercy of these new servers.)
But with this comes their aptitude for learning new technologies more quickly than previous generations since they’ve grown up with them. This is beneficial in a workplace that deals with ever-changing tech routinely.
It’s no coincidence that they’re also a mostly sober generation.
Some scientists have even started comparing their generation to that of the Silent Generation (1925-1945): the one where children were seen, but not heard.
Only now, Gen Z is the generation that doesn’t wish to be seen, and doesn’t wish to be heard. Rather, they want to be acknowledged and kept safe…
The August Jobs Report:
Where Does This Leave Us?
The August Jobs Report was released last Friday (September 7). There were 201,000 jobs added in August, but wage growth remained low.
Those who aren’t actively looking for jobs remained about the same, at 434,000.
And unemployment remained relatively unchanged in the grand scheme of things.
Considering the lowering rates of fertility, and the increased prudish behavior of Gen Z, the future doesn’t look promising…
Though the Gen Z’ers will thrust themselves into the world of employment much more willingly than the Millennials did, who will take their place when they begin to die off? Or will we even be able to reproduce by that time?
We’ll look more into the data and talk more about this demographic trend over time.

The post Generation Z: The Rise of the Technologically Inclined and the Socially Impaired (Part II) appeared first on Economy and Markets.
September 14, 2018
Get Ready for the Bubble Buster
I saw an article recently that said we’re in the 7th inning of this bull run.
That’s wrong!
We’re absolutely in the 9th inning, which is why I dedicated the September issue of Boom & Bust to reviewing the two scenarios we face ahead.
And it’s why I’ve recorded this brief video for you today, to give you a glance at what chaos we might be heading into and when.
I’ll tell you, Scenario One is the least expected, but we can’t rule it out just yet.
And Scenario Two lines up perfectly with an unbelievably powerful 90-year cycle that increasingly come to my attention. I call it the Bubble Buster cycle.
Listen to this week’s video now.
Then strap yourself in.
Harry
Follow me on Twitter @harrydentjr

The post Get Ready for the Bubble Buster appeared first on Economy and Markets.
September 13, 2018
The Emerging Countries to Bank On… And the Ones to Avoid
Just saw a chart with the second quarter GDP results for the fastest growing countries in the world, and…
Of course, emerging countries – largely Asia – dominated.
India topped at a whopping 8.2%, followed by waning China at 6.7%, Indonesia at 5.3%, and Turkey at 5.1%.
Other notable emerging countries were struggling, with Brazil at -1.2% and Argentina at -0.7%.
No surprises, except the underperformance in South America.
But these are trends that most see continuing.
The thing is, some will perform as expected… and then some won’t. And we know how this will shake out!
Our longer-term indicators tell us who will grow or not in the future.
And there are very different stories for these emerging countries looking forward. This table tells the future with much analysis and many graphs to back it up.
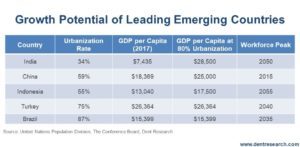
Our unique analysis shows how emerging countries accelerate the most through rising urbanization and then secondarily through rising demographics in workforce growth.
Both are highly projectable.
So, which country in that table can most sustain its growth for decades ahead?
That’s easy: India!
That’s why we created a special Boom & Bust report entitled Get Rich off the Demographic Dividend King.
It is the least urbanized at 34%, hence has many decades ahead to continue to grow in GDP per capita, which tends to triple when households move from rural to urban areas.
And its trends in standard of living growth indicate it could reach $25,500 GDP per capita compared to today’s $7,435, when it’s 80% urban and has the largest population in the world, surpassing China.
Both measures – GDP per capita and urbanization – are the lowest on that table, suggesting that India has the highest potential ahead and for the longest time.
It’s trajectory of GDP per capita versus urbanization is as high or higher than China, but it will take a little more time to confirm this early-stage trend…
India is the next China, especially in the next off-and-on global boom between 2023 and 2055.
The Emerging Market with the Least Potential Is…
On the other hand, Turkey has the least potential. It’s already 75% urban and that trend slows down rapidly at 80%-plus. And it’s GDP per capita PPP (adjusted for purchasing power) is already ahead of its urbanization trends due to high borrowing and over-investment in infrastructures. That means higher GDP per capita is not likely and may be a bit lower ahead.
Remind you of China?
Also, its demographic/workforce trends are slowing and will peak by 2040. Never mind that its government is heading in the wrong direction – towards autocracy – after seeming to become more democratic and western-leaning to get into the EU (an application that the Union rejected; a political mistake if you ask me).
And the Emerging Market with the Worst Outlook Is…
China has, surprisingly to most, the WORST outlook.
Even though it still has a few decades of urbanization ahead, being only at 59% today, it has overbuilt and borrowed even more than Turkey and more than any major emerging country in history.
The difference is that Turkey borrowed more from foreign sources and more in U.S. dollars at U.S. rates, and so is more vulnerable in the near term.
But China’s crisis will follow and very likely be the worst in modern history when it hits.
China’s workforce growth was projected to peak around 2015, but already peaked in 2011… the only emerging country to experience this. So, demographics are negative for decades ahead… and overbuilding with the most massive borrowing of any major country will be a negative for the next decade.
Then it will urbanize further and grow again, but never close to 8% to 12% growth rates again.
Then There’s Indonesia
Then there’s Indonesia, the third largest country in Asia. It’s like Brazil, the largest in Latin America.
Indonesia is a bit less urbanized than China, and not forecast to be quite as rich. But its demographic trends peak the latest, around 2055, and it has no major debt and overbuilding problems like China and Turkey.
Speaking of Brazil…
It’s in a temporary downturn after major political problems. It has only demographic potential ahead as it’s already uber-urban at 87%… but those demographic trends are slowing and peaking ahead of most of Latin America in 2035. So, good, but not that hot in the next global boom.
And its neighbor, Argentina, has similar peak urbanization and slowing demographic trends, AND a history of repeated debt and currency crisis… like NOW. Its currency is crashing about as fast as Turkey from overborrowing from foreign lenders!
So, Who’s in Your Wallet?
After the next crash, our research says bet on India, and more broadly Southeast Asia in countries like Indonesia, and hotter Vietnam.
Oh, and I have a 160-year cycle that says the next peak in world dominance will be in the East and Asia, not in the West and North America/Europe.
I expect that when the world sees mighty China collapse the worst in the coming years they’ll think the next big thing is India…
We know that already, so why not read up on this topic and learn how to position yourself ahead when the next big crash hits.
The country’s urbanization will accelerate through massive foreign investment and a pro-business government if its new progressive leader Modi and his principles survive.
Harry
Follow me on Twitter @harrydentjr

The post The Emerging Countries to Bank On… And the Ones to Avoid appeared first on Economy and Markets.
September 12, 2018
Wages Are (Finally) Blowing Up
Summer doesn’t officially end until September 21. But we’re more than a week beyond Labor Day, and business is business.
And things were booming last week.
Ignore Woodward’s latest “tell-all,” that infamous anonymous op-ed, the Kavanaugh confirmation hearings, and all the other rings of the D.C. Circus.
We have more important things to consider, such as market-moving economic data and the fact that it appears this economic “recovery” is finally making its way down to Main Street…
If You Build Stuff…
The Institute for Supply Management (ISM) manufacturing index just hit a 14-year high.
Observers expected the index to dip, but it jumped from 58.1 in July to 61.3 in August.
All that shook the market a bit
Treasury yields moved sharply higher on that news last Tuesday, triggering a profitable close to one of our positions in Treasury Profits Accelerator.
That’s what we do there: capitalize on mispricing in the U.S. Treasury market. It’s actually pretty simple stuff. But it works…
The ISM’s manufacturing index is based on a survey of around 300 purchasing managers about the general direction of new orders, production, employment, inventories, and supplier deliveries.
It’s forward looking, and it gives us a comprehensive view of what’s still an important part of the U.S. economy.
New orders jumped to 65.1 from 60.2, and production moved to 63.3 from 58.5. Prices did creep lower.
But, overall, this index hasn’t printed this high since May 2004.
The bottom line is that manufacturing is moving at a fierce clip, and the market wasn’t expecting as much.
Thus, yields moved higher, bouncing from a low of 2.97% two weeks ago to 3.07% just after the ISM release.
…Wages Grow
The Bureau of Labor Statistics added a little fuel to the inflation fire on Friday morning, as it reported a 0.4% month-over-month rise in take-home pay for August.
That was only slightly above the 0.3% expectation. But, coupled with the 2.9% year-over-year gain against a 2.8% forecast, it’s just more evidence wage-growth is picking up, too.
Non-farm payrolls increased by 201,000, beating a consensus forecast of 195,000. At the same time, July’s jobs-gain estimate was adjusted lower by 10,000.
The unemployment rate remained steady at 3.9%, though observers expected it to tick down to 3.8%.
The labor force participation rate came in at 62.7%, down from 62.9% and topping a forecast of 62.8%.
The wage growth is the thing. It’s been a persistent problem for 10 years.
But, now, it’ll make it easy for the Federal Open Market Committee to boost rates later this month.
Look for Treasury yields to remain elevated.
Lance

The post Wages Are (Finally) Blowing Up appeared first on Economy and Markets.
September 11, 2018
Finding the Truth by Looking at the Facts
The truth is…
I can’t stand sentences that start with that.
Typically, the author or speaker is discussing a controversial topic and trying to lay the groundwork for his or her position, casting everyone else as a liar or simpleton.
Paul Krugman of The New York Times comes to mind.
He won a Nobel Prize in economics based on his work regarding trade, and now he opines on everything political, claiming to know the “truth” about, well, everything.
If you don’t agree, then you’re the idiot. Or worse, you’re the rural, conservative, Southern voter, which he seems to regard as the same thing.
Newsflash: There’s no truth in politics. At least, none that I can find.
Through voting, we guess at the best way to run the government. Since we can’t reset the clock and try a different method under the same circumstances, we can’t prove A over B.
Things never go perfectly, giving naysayers the ability to claim victory, no matter who’s in power.
Ignoring all of them would be best, but that’s hard to do when the media trots politicians and talking heads out daily as the greatest show on Earth.
But we can try to cut through the noise. We can skim the news looking for facts.
How many people, in what activity, with what outcome, and when.
If those attributes sound familiar, they should.
They are part of the reporter’s code, recounting who, what, when, how, where, and why.
I typically leave off the “why,” question, as that gets back to bias.
I like the facts. I use them to shape my views on trends, big and small.
It’s why I watch CNBC all day, albeit with the sound off. I want the data, which often can be different than the spin.
Life and Death
Take murder, for example.
We have lots of murders in the U.S., with Chicago in front with 650 last year. That’s more than runner-up Baltimore at 343, and more than double the number in New York, 290.
But no one’s surprised by that.
The numbers get more interesting when we add another fact: population.
Per 100,000 people, Chicago still has a lot of murders at 23.8, but it falls from the dubious honor of first place to ninth.
In cities with at least 250,000 people, St. Louis vaults to the top with 64.6 murders per 100,000 residents in 2017. But don’t worry, Baltimore still comes in second, and that’s still no surprise.
Because New York has so many people, it doesn’t even make the top 20 in this category.
Indianapolis, the heart of Midwestern values, comes in at 16. Tulsa sits at 13 and Cincinnati is 10.
Suddenly smaller towns don’t seem so safe.
Luckily, even though 70% of Americans think crime is on the rise (and those in Baltimore are correct), I know that nationally violent crimes have fallen from 747 per 100,000 people in 1993 to 386 in 2016.
Crime fell dramatically in the 1990s and has eased lower more slowly in the years since.
On average, I’m much less likely to be robbed, assaulted, or murdered today than at any point in my lifetime.
But that story doesn’t play in the media.
Nobody wants to read about nothing happening.
We need sensational crimes to create grabbing headlines, which sell newspapers and scare the pants off of people who don’t search for the, er, facts. I’m OK with that.
If more people took my approach, publishers would sell fewer papers, which would make their papers more expensive. Besides, such hype can lead to investable trends.
What’s This Mean for My Investments?
When people worry about violence, the cops get involved.
I won’t get into the research on police violence, but let’s just say there’s a lot out there that doesn’t find its way into the mainstream media.
But the current environment of heightened awareness surrounding police activity means we should see many more body cam videos on the evening news.
Someone has to make those cameras, and it so happens the same company makes Tasers.
Axon Enterprises (Nasdaq: AAXN) produces the Axon Flex camera system and the Axon Flex 2, as well as in-car video systems, docking and charging stations, TASER recording devices, and a cloud-based, digital evidence management system that allows users to store data and pull up video segments on demand.
Want to know what happened during a traffic stop seven weeks ago at 8:29 pm? Just ask.
If the police department in question uses this system, they can identify the correct video quickly and review it.
If they can’t, they might have a PR problem or even be facing a lawsuit because the facts can’t be proven.
You can see how Axon’s products and services might be in demand in today’s heightened sensitivity environment.
That probably explains the company’s 179 price/earnings ratio and 130%-plus gains this year.
I’m not recommending Axon at these levels, I’m just highlighting how perception can run away from the facts, and leave a great opening for investments.
As we peruse the daily missives from New York and Washington, we need to ask, are they feeding us facts, or opinions?
If they’re spreading opinions, do they match the facts?
If not, it just might be news you can use to make a profit.

Rodney
Follow me on Twitter @RJHSDent

The post Finding the Truth by Looking at the Facts appeared first on Economy and Markets.


