
Danny Dorling's Blog, page 24
November 20, 2018
Brexit coincided with peak inequality – causes and effect?
Brexit may be key to the future of inequality in the UK, and inequality may have been key to making Brexit. Growing inequality created so much, from tax-evader-vote-funders to mass discontent.
The UK currently has the highest recorded level of income inequality of any European country. This is probably not a reflection of its economic efficiency. Free markets are often inefficient. It may be part of the reason why Brexit is occurring – creating most of the ‘Leave’ drivers. And Brexit may also make such extremes of inequality hard to sustain for much longer.
Part of the lead up to the events of 2016, 2017 and 2018 were election campaigns that spread fear of immigration in 70s, 80s, 90s and 00s. Hostility to the EU was whipped up, it was not held up at any point for long. The story of the geography of Brexit voters has been distorted by the press and many initial academic reports. Most Leave voters lived and worked in the South of England. But inequality had a strong impact on the vote and voting may also have been deeply influenced by our badly understood legacy of having been the largest ever Empire. Yet 52/48 – may be a good ratio for moving forward. Had Leave lost we would be facing a second referendum. Had they won by more than 52%, a hard Brexit would be far more likely. And today anything is possible:

Share of Labour vote in UK opinion polls May 2015 to September 2018
To listen to the full talk here:
Danny Dorling speaking at the Regional Studies Winter Conference, London, Bloomsbury, 15th November 2018. The day seven UK government ministers resigned over Brexit. The excitement may have made it harder for some to understand the instruction: “Keep in mind that a question is a statement that takes less than thirty seconds and ends with a question mark” 


November 3, 2018
Where will our kids live and how will they afford it?
We used to plan our cities. In most European countries they still plan their cities. What would a plan for the future of Oxford look like that was sustainable, environmentally responsible and affordable?
Where should and could housing be built around the city of Oxford? What size should Oxford be planning to grow to by the year 2030, 2040 and 2050? And, most importantly, why are these questions not even properly asked?
What kind of housing should be built and who should build it? What would ensure it is and remains affordable in the future? How can it be built to double the number of people who cycle and walk to work and increase the use of public transport? Who plans for the future need for new schools, fewer cars within the city and the right of the children of the city to be able to remain in the city of their birth (even into adulthood) if they so wish?
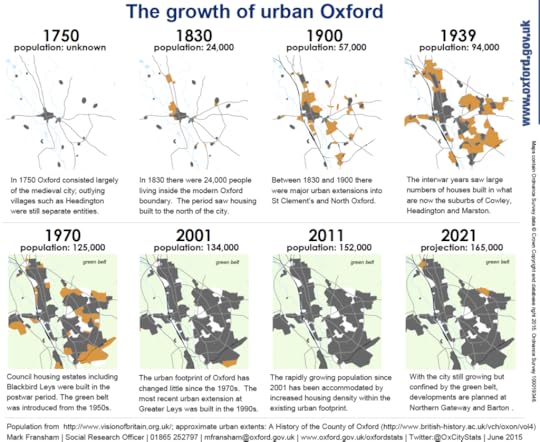
We used to plan our cities. In most European countries they still plan their cities. The last comprehensive sensible plan for the expansion of Oxford was published in 1927 (shown at the very end of this post). It was circular because the main mode of transport at that time was the bicycle. People can only cycle so far from Carfax! Now that electric bikes and trikes are available there is no good reason why Oxford could not achieve what the whole of the Netherlands currently achieves. In that country a quarter of people aged 65, and over, regularly cycle, and a majority of working-age people walk or cycle to work. Surely one city in England should be able to manage that by 2050?
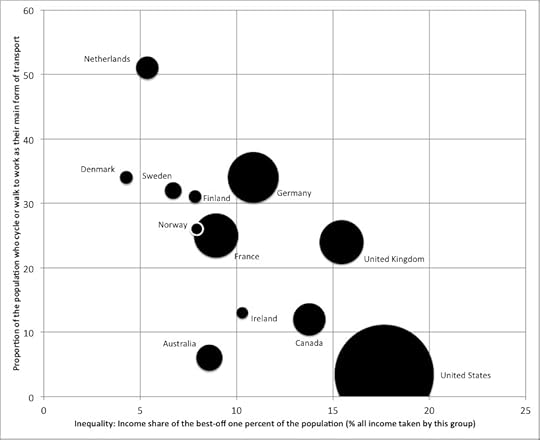
Proportion of people waking or cycling as their main means of travel. Note: Each circle is a country drawn in proportion to its population. Belgium and Austria and not included because they are not in the Paris top income dataset.
Sources: Paris top incomes dataset and Buehler and Pucher (2012).
Oxford expanded rapidly in the 1930s, and again in the years up to 1970. The eight small maps below show how it grew and how it also then hit the limit of its very tight green belt, the belt that artificially constrained its local city boundary. Almost no housing was built in or around the city during the 1980s, 1990s, 2000s, and even into the current decade.
If you look very carefully at the last map below you can see the ‘Barton Park’ addition, the one that is currently being built now, and this is in November 2018! Oxford is the most unaffordable city in England as a result of this dearth of building after the 1970s. It is also one of the least green cities in England because up to 40,000 people drive over the green belt every day, most do this because they cannot live in the city.
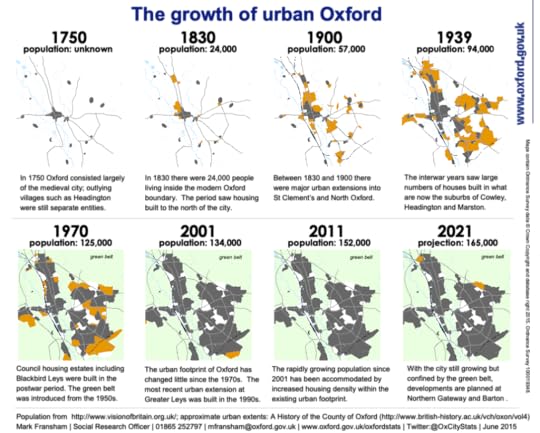
The growth of urban Oxford 1750-2021, new build shown in orange
Oxford Liveable Streets have produced a plan for the major arterial roads within the city, making almost all of them one way for motorised traffic. This would then allow space for four cycle lanes, two on either side of each main road, a faster and slower cycle lane. Bikes could travel both ways on each road; buses and cars only one way.
Long before 2050, cars should be almost entirely banned from the centre of the city. Buses would crawl ever so slowly through the largely pedestrianised centre, just as they have very recently begun to do outside the entrance of the new Westgate shopping centre. This opens up more space in the centre of the city for the many thousands of new tourists that Oxford should expect to see arriving in the decades to come as the middle-income population of the world grows.
When you plan new housing you have to think about everything else as well. Tourism will be one of the ways in which the city and its universities prosper in future, and tourism income should reduce the current reliance on philanthropic funding from men (almost always men with questionable reputations) for the renewal and upkeep of university buildings. Such better transport planning within the city will also make it possible to increase the density of housing within the city boundaries and to add more housing on the edge of the city, most having views of the old university, without creating transport chaos.
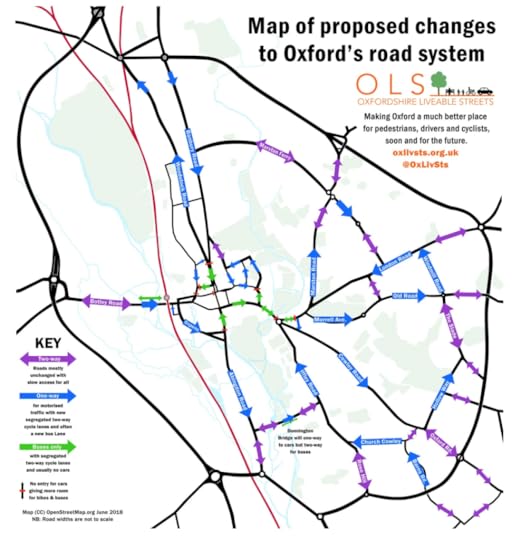
Oxford Liveable Streets June 2018 proposed changes to Oxford’s road system
If you find the map above confusing then think about just one junction you might well use if you live, study, or work in Oxford. Try to imagine how very different it would be to walk or cycle across The Plain (the roundabout just to the east of Magdalen bridge) if cars only entered the roundabout from the London or Iffley roads, and if they could only exit the roundabout up the Cowley road. Can you estimate how many people who unnecessarily drive to there, would still drive there? Imagine if the buses only drove one way along the roads to and from the Plain, leaving so much extra space for wider pavements and four cycle lanes. Imagine how many more people could safely walk across Magdalen bridge at the height of summer and how much better the air would taste. The map below shows how little space is currently given to those who walk or cycle across the Plain:
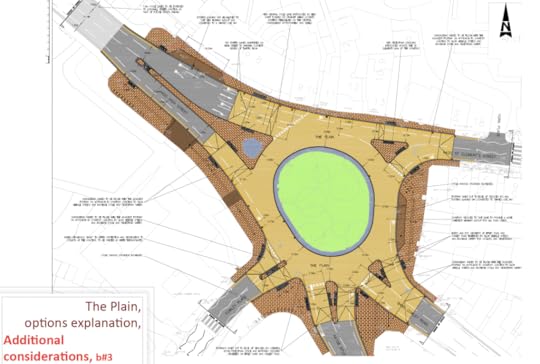
The Plain, as currently operating in 2018, and how much better it could be
Be more imaginative. Think how much Cornmarket has been transformed over the last three decades. How it has been altered repeatedly, from a street jammed full of cars in the 1980s to one that was limited to buses in the 1990s, but where the bus companies filled the street with dozens of buses every minute of the day during the stupidity of the ‘bus-wars’ when planners believed bus companies should fight it out for supremacy.
Think through all these recent follies to how Cornmarket is pedestrianised today, with no buses, no cars, and even bikes only using it in the evenings. Now imagine what will happen over the course of the next thirty years to the Cowley road and how it will end up by 2050 being the pedestrianised equivalent of a mini las Ramblas, the most famous boulevard in Barcelona. Why are we unable to see that far ahead and plan for it, rather than wasting money on small scheme after small scheme that eventually inches towards that almost inevitable conclusion?
Why can’t we imagine building cycle tracks out into the countryside, as suggested in the map below, rather than having to confront the idiocy of a plan to build the first quarter of the outer M25 motorway in an ark from Oxford to Cambridge? Who in their right mind would propose building a huge new motorway unless they desired to rekindle the fervour of the M11 and Newbury by-pass road protests, and to turn a new generation of young people into road protestors?
It is very hard to see why anyone would even think it was not laughable to suggest the building of the Oxford to Cambridge expressway to generate yet more traffic, pollution and people having to drive long distances to the city in which they work, rather than simply live in it. Why not instead, at just 1% of the cost of an expressway, propose to build some high quality cycle tracks out from the city of Oxford to allow people to actually see the greenbelt, and to help protect it in future as the green belt becomes a place people actually use for recreation and exercise? These cycle tracks would also, of course, be very safe for children to use as they would not be next roads.
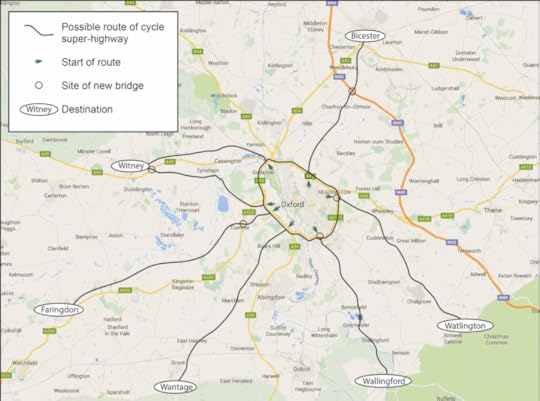
Seven proposed routes for cycle super highways out of the city of Oxford for recreation and some long distance commuting
And then, once you have planned the future long term aims for how transport in the city will work then, and only then, can you plan the new housing. You need to plan for the possibility of trams too, which may be affordable in ten or twenty years from now. Oxford used to have trams running along its main streets. England is currently too poor a country to imagine being able to do that in the immediate future. But short term political folly and economic distress is no reason not to plan, knowing that in future such transport links will again be possible and buses will not be the only form of public transport within the city. Sort out the roads and then you can build the homes.
So, where to build? Go back to the 1927 plan and see where they proposed housing to be built then. The red lines on the map below are the proposed ring road, before it was built (luckily not all of what was proposed was built). Housing was planned for Oxford all around the ring road. The ring road was never meant to be a noose around the city’s neck, drawn tight and constricting its growth. The ring road was meant to be within the city.
Look at how the Oxford ring road currently runs through Summertown to see how that is possible, if the current reliance on cars is greatly reduced by better transport planing. The ring road can be made safe, as it is in north Oxford. It just needs to be slower and for fewer people to rely on using it to get to work, to shop, or to travel in general by car. Now that Oxford has two railway stations again fewer people should need to use their cars as much in future, especially if the railway is also improved so it easier, faster and more frequent to get to get to Didcot, Bicester and further afield by rail, than by car.
And then think how the hospitals would be able to recruit and retain their staff if we had more high quality, low cost, densely built housing, including within very short walking distance of the John Radcliffe hospital, on the fields just to its north. Think how Oxford’s schools would not face repeatedly losing as many as a quarter or even a third of their teachers every few years, as those young teachers give up trying to find the money to pay the rent. Private rent in Oxford is double what average mortgage repayments are for the same property. Just imagine what it would be like to live in a well planned city in one just generation’s time! They imagined it before. Here is what they dreamt of almost one hundred years ago:

Oxford Regional and Oxford Special Area Town Planing Schemes, 1927
But why grow the city? Why not try to keep it like it is. Fossilised as a relic of the 1970s, frozen in time at the end of the era when we used to plan. Why not keep Oxford as it is: a monument to Mrs Thatcher’s belief that planning was bad and that the market would decide who had the right to live in the city; a folly celebrating her belief that if you could not afford to live in the city, then you should not be living there.
If you need to know why Oxford needs more housing, then ask young adults who currently work in the city but rent privately or commute in; they will tell you why.
Ask the people living in tents hidden away from sight along the more overgrown banks of the rivers in the city.
Ask the people sleeping sheds, the very largest of sheds, that you can now see at the ends of many gardens.
Ask those who live three families to a three-bed house along the streets that you once played as a child. Streets where a single family could easily afford to live in a single house in the 1970s.
Ask the postgraduate students who are officially just renting, two to a property, but in which four or five actually live. They live in homes where they worry that they are breaking the law. However, they know there is no other way they can study at one of the universities, and also afford to eat.
Ask why the sewer system overflows each year. It is because many of the new people are already here, just not the housing for them. It is because so many homes are so overcrowded and because we failed to plan better sewers.
Ask why people are always leaving their jobs in such high numbers and we have to recruit again and again to fill posts. We only fill them temporarily because no one without “family money” now stays for long if they have to rent.
Or ask your children, if you have children, whether in future they might want to live in the city in which they are growing up.
Or ask yourself – if you want children – why you live in Oxford, when you know you cannot afford to start a family, because you will never have a proper home.
—
Basing the plan for the future growth of Oxford on the bicycle is how you limit the future growth of the city, because almost no one wants to cycle very far each day.
You can eventually build up to, but just below, the ridge lines of the hills. Build apartments without stairs because we are an ageing population. Build at high density around the edge of the city so as many people as possible get to enjoy the views into the city. And build housing, as they did with the new towns, that is allocated on the basis of need, not greed, and where the rents are regulated. That truly affordable housing should be the large majority of new building around the city. It can be built to be beautiful. It can be built to be sustainable. It can be so much more green than the car-commuting alternative that we currently embrace and plan to extend with the ‘expressway’.
All this dreaming will, of course, will require the election of a Labour government nationally. Labour are committed to the compulsory purchase of land at agricultural prices on the edges of the cities with greatest housing need. The city with the greatest need is Oxford. The danger is that before a Labour government or Labour/SNP coalition is formed, private developers begin to build executive housing on that land for London commuters. Homes with five bedrooms, two garages, maybe even private swimming pools. Oppose that, and plan for a better way. Organise, imagine and be active.
In future our children and their children can live as adults in the city in which they grew up. There is no need for that city to sprawl out endlessly to make that possible. More students, more workers and more tourists can fit within the city than are here today, but with appropriate planning this increased volume need not be felt as oppressive. We who currently live in the city, should we wish, could grow old in the city, on the edge, and with a view into the city that hardly anyone today can enjoy. Should we live within Oxford today in a family sized house, then if this dream becomes true, we can know that another family is now enjoying that house, just as we are enjoying the view of the dreaming spires. We can then grow old near to where our family and friends still live, and can afford to live. It is not very much to ask.
We used to dream of a better future. Before we can get a better future we have to learn to dream again.
A summary of parts of a talk by Danny Dorling, introduced by Susan Brown, leader of Oxford City Council, 2nd November 2nd 2018:

A Fundraising dinner with Danny Dorling: Friday 2nd November 2018
October 29, 2018
Jubilee 2022: Writing off the student debt
The unjust student debt can be written off – if we choose to have a fairer society. Don’t let anyone convince you this is not so.
In summer 2012, English university fees suddenly tripled to become the highest in the world. Children choosing to go to university had no choice in the matter – to the vast majority it was huge debt or no degree.
These fees turn education into a cheap and nasty marketplace where universities that lie about their product can succeed. The supposed benefits of markets simply do not apply to higher education: students and their parents are not repeat consumers. They don’t know what they are buying, while universities know very well how to tart up what they’re selling. Some have become more focused on marketing, thanks to the financial incentive, than on providing a good education.
Labour under Jeremy Corbyn has said it will end tuition fees from the moment it is elected, and return our universities to institutions acting for the public good, not profit-maximisers. However, the Labour party as yet has no policy on what to do about outstanding student debt – how to soften the injustice for students who have already racked up debt at the point when fees cease. University officials estimated the policy of ending tuition fees and bringing back some maintenance grants would cost £10bn a year. But then there is the historic debt.
So far Labour has been struggling to find a way forward. The party cannot go into an election telling young people that if they are unlucky enough to have started university the day before a Labour government is elected, they will still have to pay off a £30,000+ loan to cover their fees. It would not be fair on students, and would create a cliff edge for English universities, offering an incentive for students to defer entry until after a general election, leading to a sudden fall in fee income, empty lecture theatres and probably redundancies across England’s universities.
The solution, though, could be fairly simple: Labour could introduce a cap on maximum future student loan repayments for first-time undergraduate degrees, with the rest of the debts written off.
The principles would be as follows. First, no student who started their course in 2012 should repay more than a student who started the same course in 2011 (when fees were a little over £3000 a year). With interest added that puts the debt cap for a student who started in 2012 at £12,000 (instead of anything from £30,000 upwards).
Secondly, no student who starts their course in the year immediately before the new government is elected should pay more than one who starts the same course a year after. In other words, they should pay tuition fees with a loan, but for them that loan would to be written off entirely if Labour won.
Thirdly, in between 2012 and the year of a Labour election win, the maximum repayable loan should reduce fairly, as shown in the table below. If Labour wins in 2022, then those who entered university in 2017 (midway between 2012 and 2022) should only have to pay back half of the maximum that any student who entered in 2011 would have to pay.
The plan could be called “Jubilee 2022” – in recognition of the final year in which the cap would be implemented, exactly 10 years after exorbitant fees were introduced. If Labour is elected before 2022, the cap could simply begin to operate sooner.
So, how much will you pay?
The “Jubilee 2022” cap on tuition fee debt
Date of start /Fees repayable for a three-year course
2012 £12,000 (the equivalent of £4,000 tuition fees a year)
2013 £10,800
2014 £9,600
2015 £8,400
2016 £7200
2017 £6000 (the equivalent of £2,000 tuition fees a year)
2018 £4800
2019 £3600
2020 £2400
2021 £1200
2022 zero to pay (the equivalent of £0 tuition fees a year)
Debts above this would be written off. For those whose parents paid their fees upfront there will be no refund.
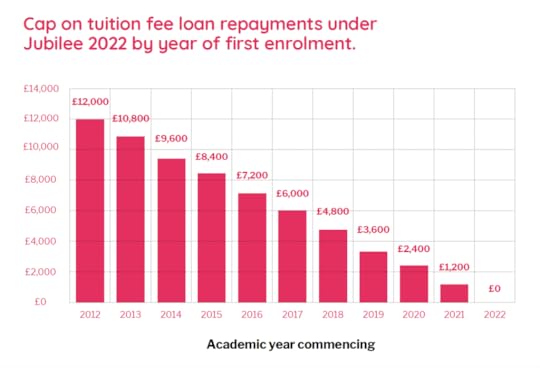
Cap on tuition fee loan repayments under Jubilee 2022 by year of first enrolment
How will we pay for this? The answer is another question: if the rest of Europe can do it, why can’t we? Across mainland Europe, including all the best universities, tuition fees are either much lower or non-existent. We could raise taxes on wealth, on corporations and on people receiving the highest incomes to levels already seen in the rest of western Europe. There is nothing unusual about it. Because higher education is an investment in the productivity of the economy, we should fund it through state, not individual, borrowing.
This plan would not cost as much as some might imagine because – as has become increasingly clear – many, if not the majority of graduates in future will be unable to pay back their loans. Some, such as medical students with huge debts to repay, even have an incentive to leave the UK and never return.
At the moment government is actually paying most of the fees, but pretends it is not through an opaque relationship with the Student Loans Company and the fiction that future graduates will be as well paid as those in the past, when being a graduate was far less common. Implementing this idea moves the funding model away from the fantasy of putting things off-balance-sheet.
The key is that we transform a set of onerous private debts into a social obligation borne by the government – by us all collectively. This is both a progressive way to fund higher education and a recognition of its status as a public good.
Published 30th October 2018 by the Guardian, based on a report by Danny Dorling and Michael Davies for the Progressive Economy Forum, also published on October 30th 2018.
To read the full report this article is based on, and for and a link to that report on the Progressive Economy Forum Website click here.
October 27, 2018
The Brexit vote, declining health and immigration
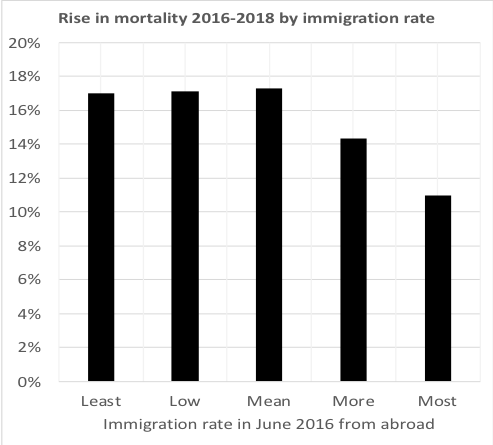
People voted Leave most often in those parts of England which had the worse health trends, which saw the greatest rises in mortality rates in the two years after the vote, and to which the least immigrants had come in the year before the vote.
In local authority areas where immigration to England from outside the UK was highest in the year to June 2016, the fewest British people voted Leave in June 2016 and the subsequent rise in mortality rate from Q1 2016 to Q1 2016 was lowest. It was in areas where there were already the most social and economic problems, and the fewest immigrants, that most people voted for “anything but this”. Most of these Leave areas were in the South of England. Most people who voted Leave were social class A, B or C1 – but they still lived in areas of the south that, like most of the UK, were not fairing well by 2016.
The local authority districts of England and boroughs of London can be ordered from the lows of South Staffordshire (0.11%) and Staffordshire Moorlands (0.13%) up to highs of Westminster (5.9%) and the City of London (8.5%). They are ordered here by the share of the population living in each area in June 2016 who had arrived from abroad within the twelve months to June 2016.
Almost no-one came from aboard to live in those two districts of Staffordshire between June 2015 and June 2016. In contrast, one in every seventeen residents in Westminster at the time of the EU referendum was a very recent arrival, as were more than one in twelve of the residents of the City of London, many of them living in the Barbican towers.
All of England can be divided into five groups of districts by the international in-migration rate of June 2016, from the districts with the least migrants (0.3% on average) to those with the most (still just 2.7% on average). Each group is defined to have almost exactly the same population in June 2016 as ever other of the five groups.
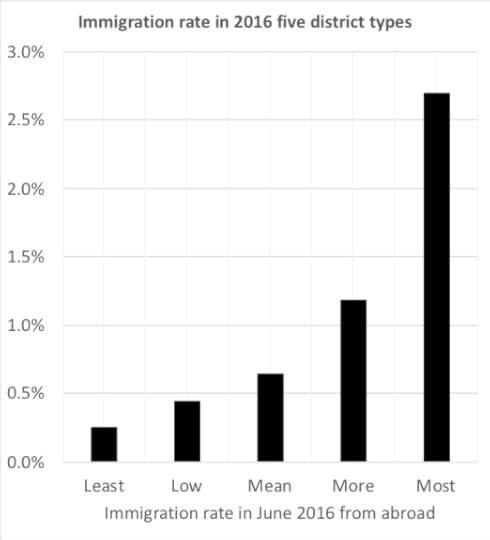
Immigration rate in 2016, five types of English district
You might have thought that this rapid in-flux of new people would have annoyed those who had a right to vote in the EU referendum, which given how the referendum was organised, did not included the international migrants themselves.
In fact, the very opposite occurred.
In Westminster and the City of London less than a third of those who voted in the referendum voted to Leave the EU. In contrast, in both of those two Staffordshire districts with the lowest international immigration rate in all of England, some 65% of all those who voted to leave, almost two thirds!
Nationally, across the five groups of English districts, the fewer migrants there were, the more people voted to leave of all those who voted. In fact, it was only where there were the most migrants that a majority vote to Remain:
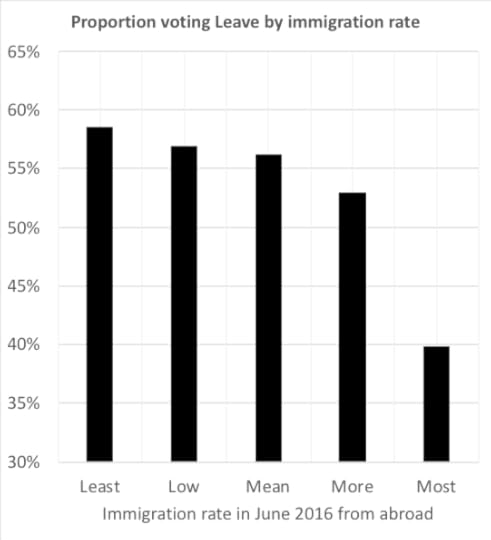
2016 Leave vote by local authority type (authorities grouped by immigration rate 2015-2016), England
This is, however, far from the end of the story of a very interesting anomaly. On the very same day as the EU Referendum was announced, the official mid-year population estimates of the UK were published for the year ending June 2015. Those estimates revealed the most remarkable rise in mortality in that year. It was little commented upon at the time, as the result of the EU referendum was such a huge shock, but among the rise in deaths was one anomaly. There was no rise in deaths rates for people aged 25-29, the age group of highest net in-migration to the UK at that time.
The ‘health migrant effect’ has been known about for a long time, but we didn’t realise just how healthy these migrants were and how unhealthy those of us who were not migrants were (on average) back then. This was despite increasing numbers of people saying when surveyed that they felt more ill, because those reports were ignored. Then more people in the UK began to die earlier than before.
Between the first quarter of 2016 and the first quarter of 2018 the numbers dying across England rose by an average of 15.8%, but by more in areas with fewer in-migrants:
Life expectancy peaked across the UK in 2014 and has been lower ever since, falling most years. The Office for National Statistics revealed an analysis that demonstrated this on August 7th 2018. One of the key graphs from the ONS analysis is shown next and it reveals yet another anomaly that has yet to receive much attention. It is perhaps the pattern for women that is most revealing:
Women:
Rise in life expectancy per year in weeks, 2010-2016 or nearest period and six years earlier
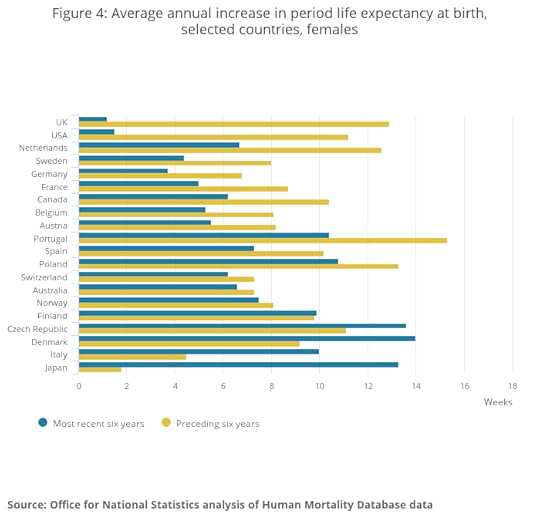
Average annual increase in period life expectancy at birth, selected countries, females 2004-2016
Women: average annual increase in period life expectancy at birth, selected countries. Office for National Statistics analysis of Human Mortality Database
See here.
All the reports on the international comparison of trends in life expectancy concentrated on the fact that women in the UK had seen the lowest rate of life expected improvement from 2010 to 2016 of the twenty affluent states being compared – which itself actually disguises the overall fall since 2014 as there were still some improvements in the early 2010 – 2012 period.
What no one commented on was the huge rise in women’s life expectancy in the UK in the six years prior to 2010: the 2004-2010 period. And, given what we now know about the relationship between migration in the UK and mortality this is, perhaps, important.
In May 2004 the EU welcomed in ten new members states, almost all central and Eastern European. Only the UK, Sweden and Ireland at first allowed migration from these new member states and the vast majority of those who came, came to the UK.
In hindsight it would appear that the women who came may well have been some of the most energetic and healthy, young, and well-educated. This will not be the whole story; but the picture changed abruptly once migration to a wider range of Western European countries was permitted.
So what about the men? Well, again a very similar picture is seen. Rapidly improving life expectancy among men in the UK prior to 2010 (only Portugal sees a greater improvement from a lower base), and then sudden stalling after 2010, with only the USA seeing even less improvement.
Of course, the UK experienced huge cuts to vital public services after 2010, especially to those services necessary for sustaining life amongst people who were most frail and most in need, especially the elderly with Alzheimer’s and dementia. The cuts to local authority budgets and the consequent repeated decimation, year on year of adult social service visits, meals on wheels services coupled with the stalling in the needed rise in health care funding and so much else very neatly matches up to the rising death rates among, at first the most elderly women living on their own and then not quite so elderly women and the most elderly men, and then more and more of the population – almost all originally UK born. It was not the in-migrants who were dying in rising numbers. The migrants were young and healthy and disproportionately worked as health carers.
Men:
Rise in life expectancy per year in weeks, 2010-2016 or nearest period and six years earlier
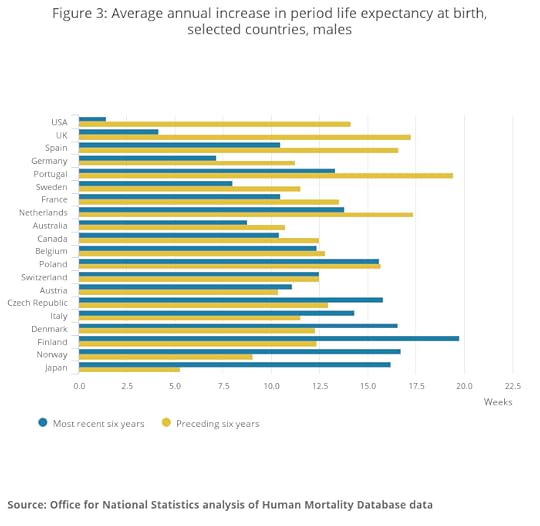
Average annual increase in period life expectancy at birth, selected countries, males, 2004-2016
Infant mortality rates also rose in the UK as midwifery services were constrained. The greatest rises were seen around the time of birth when access to a safe delivery services is key. The rises were statically significant for the most recent two years and not reported from elsewhere in Europe. In some of the best organised countries of Europe, infants are half as likely to die in their first year of life as those born in the UK. Figures released by ONS in late October 2018 confirmed the rise in infant mortality is still continuing in England. This is not happening elsewhere in Europe.
Of course, premature babies are born all across Europe. More that are sick survive in most other European countries and stillbirth rates are higher in the UK than elsewhere in most of Europe. But could there be a relationship between changes in migration patterns and the recent rise in infant mortality in the UK? Here is one potential clue, up to a third of midwives working in some hospitals are EU but not UK citizens. Once all of Europe opened up to migration from the East, attracting midwives from Eastern Europe to the UK became harder.
It will be many years before we understand the full story of went wrong in the UK to result in life expectancy falling significantly for the first time from 2014 onwards and infant mortality independently also rising. Those figures from ONS released in late October 2018 confirmed that age-sex standardised mortality rates for both men and women across all of the UK remained, by 2017, below the levels achieved in 2014. Mortality rates have been getting worse since 2014 for everyone in the Uk. We also know that 2018 has been even worse (so far). I will end with an anecdote.
On Friday September 21st 2018 it was revealed by the BBC that all but one of the many maternity units in Oxfordshire had shut their doors the night before due to lack of midwifery support. That same day the local Oxford Mail newspaper revealed that expectant mothers scheduled to give birth at the Cotswold Birth Centre in Chipping Norton should check Facebook posts to see if that centre, the one near them, was open when they went into labour.
For a PDF of this article and the original October 2018 publication it appeared in click here.
—
The 2018 autumn budget, hypothecation and taxation
Philip Hammond delivers his budget on Monday 29th October 2018. He may be tempted to suggest that any new taxes he introduced are hypothecated. Is this a good idea?
Hypothecation: Beyond the ‘factory model’ of taxation (Part One)
There is an argument that we should oppose hypothecation on the grounds that it is misleading, reducing the economy to a ‘factory model’ of inputs and outputs.
The hypothecation of taxation implies that politics works like a factory making many products. This factory model of taxation implies that you get out of the economy what you put in. Taking the example of a cereal factory, if you Increase the inputs of oats and wheat and sugar and ramp up the amount of cardboard you buy, more packages of cereal will come out of the other end of the production line. In essence, you give the public power over the inputs and they will get more of what they want.
The factory model of taxation is misleading in a similar way to how misleading it is to think that the economics of a whole economy is similar to the economics of a household. That household – or ‘handbag’ – model of economics suggests that if you are frugal, and spend less, you will prosper.
There is, of course, some truth in all models. The handbag model of economics is an analogy that will at times appear to be pertinent. For instance, at some point it will not be possible for the United States of America to carry on spending vastly more money than it raises in taxes every year, increasing its national debt to astronomical levels. Rising to as high as $14,344,566,636,826.26 even as long ago as June 15th 2011 (according to Friedman, T.L. and Mandelbaum, M., 2012, That used to be us: What went wrong with America and how it can come back, London: Little Brown). However, the reason it will not be able to do that is not because the United States economy is like the household budget of a family. For a state, which is made up of many millions of households, money does not play the same role as the money you might have in your handbag. A country’s current account does not determine what its people are able to buy at the shops that same day.
The factory model of taxation, like the handbag model of economics, is initially attractive and intuitive because it reduces a process to something you think you understand well, although most people have never been in a factory and most of us run our household economics on debt. For example, I have a mortgage and no one calls me profligate. The handbag model is Most closely associated with Mrs Thatcher, the first person to call herself a “handbag economist’ (according to James, A. (2015) Orwell’s Faded Lion: The Moral Atmosphere of Britain 1945-2015, Exeter: Imprint Academic Press).
Consider health care. The factory model of health care implies that the more you spend on health care the better your health will be. I am not saying that the opposite is the case – just that it is not as direct a process as simply putting more in to get more out.
The USA is, again, a useful example for this. Far more is spent on healthcare in the USA, per head, than in any other country in the world. As much is spent from the country’s public purse on schemes like Medicare and Medicaid as is spent privately, and yet the results are not good. On closer inspection it turns out not to be health spending that best predicts health outcomes in the separate states of the USA and other affluent countries of the world, but the influence of factors such as historical levels of economic inequality, especially income inequality
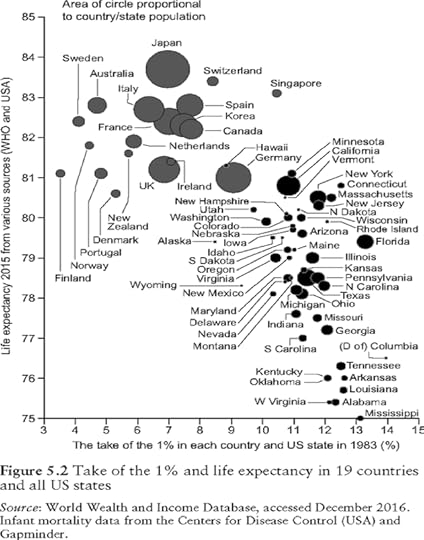
Take of the 1% and life expectancy in 19 countries and all US states
And an interactive version of the graph above can be found here.
Of course, you have to consider multiple issues at once when considering tax. Health spending matters to improve health, but so many other factors also contribute to health outcomes. For example, housing policies to ensure that doctors and nurses can afford to live near their patients. Affordable housing is required so that most of the taxes spent on healthcare do not simply end up being wasted on higher salaries used to pay the rent to private landlords or financing mortgages so that home can be purchased from an older generation who will be cash-rich but health-poor.
The same applies to education policy. Again, it is not just the amount that is spent on education that contributes to the education levels of the population as a whole. When societies are more mixed, children end up better educated.
Social policy is not like a cereal factory. All the inputs go in and all the outputs come out, but they are mixed up in the middle in ways that we are still learning about. All this lends itself to an argument against hypothecation of taxes, which is too heavily reductive about inputs and outputs. However, there is one case were the argument for hypothecation is stronger, and that is in the introduction of new taxes.
For the on-line version of the first half of this blog on the covi website and a PDF click here.
Part 2: The case for Hypothecation: in the introduction of new taxes
The article above makes the case that hypothecation is misleading in that it reduces public spending to a ‘factory model’ of inputs and outputs, whereas in fact there are many complex factors which achieve social outcomes.
However, there is one case where I believe the argument for hypothecation is strong, and that is in the introduction of new taxes.
Taxes can easily be made unpopular when they are first introduced by government. However, after the introduction of a tax, citizens tend to adapt quickly – most people do not perceive the taxes they pay as unreasonable. It is the threat of a new tax that is often imagined as only having bad outcomes.
Indeed, evidence shows that affluent countries that tax at a higher rate have far better social outcomes in terms of health, education, housing, pollution, transport use and happiness levels. In contrast, affluent countries that tax at a lower rate – and especially ones that tax the rich less – have the worst health and educational outcomes, the most inefficient and insecure housing systems, the highest rate of pollution per head, worse public transport provision and higher intake of anti-depressants. All of these factors are, of course, inter-related, but a government generally helps its people by taxing more as long as that government spends wisely.
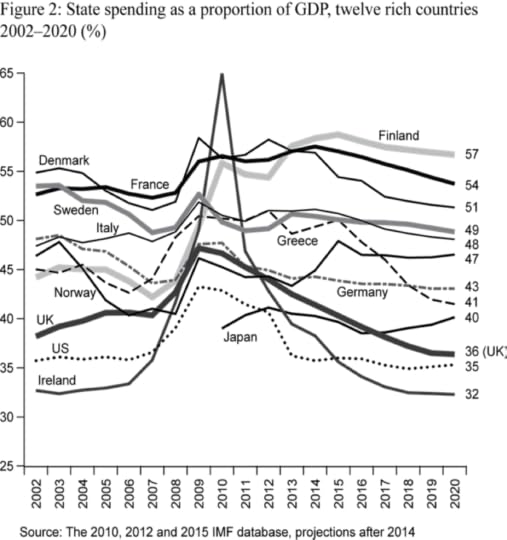
State spending as a proportion of GDP, twelve rich countries, 2002-2020 (%)
From “A better Politics” (2016) A free copy of the book is available here. It only contains two figures. This is Figure no. 2.
In England, I would support the introduction of a hypothecated Land Value Tax to be spent on health and social care. This would free up general tax revenues to be better targeted on education, welfare, housing and much else in the UK that is in urgent need of attention. A land value tax would replace council tax and business rates, and the tax would enhance intergenerational equity as it would be levied mostly on older people.
A land value tax could be introduced to replace inefficient wealth taxes with the promise that all the monies initially raised would be paid on enhancing health and social care. As taxes are tapered in when they are initially raised and as the need for extra health and social care funding is acute this promise could be made to be kept for at least a decade.
Inevitably, the revenues collected from hypothecated taxes reduce over time, and become less ‘ringfenced’. This is what occurred with National Insurance payments, which is now a general tax. But at its point of introduction, people would know what they were voting for when they voted for the political party that proposed such a tax. On implementation, only a very few of the extremely rich would feel much financial pain, but they could bask in the knowledge that they were being taxed for a great cause – to increase babies’ chances of surviving their first year of life across all of the UK and helping more elderly people live with more respect and less fear and pain. It is this sort of social contract on which the tax system is based in the first place, so if hypothecation helps make this case, then it could be effective.
For the on-line version of the second half of this blog on the covi website and a PDF click here.
October 18, 2018
Inequality and Housing: A new economy for the many
What policies could be enacted to end homelessness in England, to ensure decent quality affordable housing, to prevent speculation and to control greed?
Introduced and chaired by Karen Cole of Unite, the Slough MP David Drew, Gloucester Activist Steve Gower and Oxford Professor Danny Dorling speaking together on a panel at a Gloucester Labour Party event held in the Guild Hall Gloucester on October 18th 2018. Organised by the Labour Party candidate for Gloucester, Fran Boait:
October 17, 2018
Finland, the UK and 7 Maps of how the human world is changing
Life expectancy is rising in Finland – unlike in the UK. What’s going right?
Scandinavian countries spend more on public services and excel in preventive health. They should beware the British model
Earlier this week, a new report from the Royal College of Paediatrics and Child Health warned that infant mortality in the UK could be 140% higher by 2030 than in comparatively wealthy countries if current trends continue. Infant mortality rates are already twice as high as in Finland. There are also big gaps between the UK and Finland on rising life expectancy. Life expectancy has stopped rising in the UK, and is now actually falling across much of the country. In stark contrast, Office for National Statistics figures show that out of 20 comparator countries, Finland has experienced the largest increase in improvements in life expectancy for men since 2010, and Finnish women’s life expectancy has also consistently risen.
What is it about Finland? And what’s wrong with the UK?
Read more from an article published in the Guardian on October 17th 2018 here, and/or listen to a lecture about Oxford, the UK, Europe, the World and seven new maps of the world by clicking on the triangle below. The Lecture was given on October 16th 2018. The two subjects of inequality in health and remapping the world are, as if everything, related:
Danny Dorling giving the The Fleure Memorial Lecture, Manchester Geographical Association, Brooks Building, Manchester Metropolitan University, October 16th 2018.
(Note the Guardian piece is written by Annika Koljonen and Danny Dorling. Annika Koljonen is a final-year student at the University of Cambridge. The talk is by Danny, introduced by Sue Birmingham, President of the Manchester Branch of the Geography Association).
October 13, 2018
Inequality and Social Deprivation: Examples of what goes wrong from the UK
I’m interested in inequality and what is happening with that.
I’m going to talk a bit about housing, the problem of getting housing.
A little bit about health, and the health crisis at the moment.
And I’m going to stick a bit about Brexit in – why not?
So I will definitely upset somebody.
Whenever I go somewhere – and I have not been here before (but I have been down to the beech because it is where Geographers go and measure things) – I draw one of these maps:
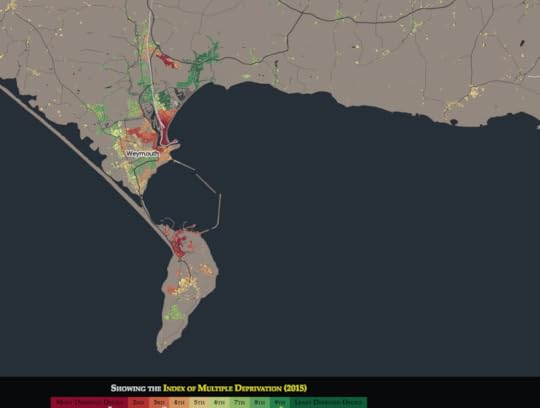
Weymouth and Portland (2015 deprivation index)
These are publicly available and they are quite interesting. It’s simply a map of the government’s [2015] deprivation index.
And this is an interesting area because normally an area of this size would largely be one colour or a couple of colours, but you’ve got more of a colour mix than most places so you should be proud.
You should have a sign up at the train station that says: “Welcome to Weymouth, the most socially divide small urban settlement on the South coast of the country.”
The dark reds are in the poorest tenth of areas, probably ex-council estates, but I could get it wrong. The green is the poshest and the dark green is the poshest of all.
To hear more click play below:
Danny Dorling speaking on Inequality and Social Deprivation: Examples of what goes wrong (from the UK), a Public talk for Weymouth & Portland Action on Wages – WeyPAW, Safewise, Weymouth, October 13th 2018
And find your own map here.
October 12, 2018
Peak Inequality – My Fair London and Oxford
Institutions must recognise the extent to which they are partly responsible for their cities and country’s problems.
If a university sees the city it is in as if the city doesn’t matter, other than for servicing the university. That creates all kinds of problems for the university.
It can become very hard for the university staff to get housing. But then the university thinks it only has to worry about that and doesn’t realise you also want to have local schools and shops that work – and if primary school teachers can’t house themselves, that’s not great either for the children of everyone who works in the university and also the few students who have primary school aged children. It’s is ridiculous that in England it is so often necessary to have to teach people in a university that they are part of something bigger, part of a society and a city – not above it.
In my home town of Oxford the oldest university is more culpable than any other actor for the city’s notoriously high property prices through its role in the creation of the city’s greenbelt and the constriction of Oxford, which mean that the city has seen almost no building in the last 30 years. The university for many years has increased house prices by giving housing allowances to academics:
The stunted growth of Oxford
If you’re trying to work out why the city of Oxford has a secondary school (or two) near the bottom of the league table nationally, a typical job of a mum at that school would be cleaning bedrooms in one of the colleges of the University of Oxford.
Neither the university nor any of the colleges recognise the Oxford Living Wage, a minimum set by Oxford City Council for its workers and agency staff that currently stands at £9.69 an hour. Instead, the university is committed to the rate set by the Living Wage Foundation, currently at £8.75 an hour. But approaches across colleges vary. Some colleges chose not to pay that wage. They could all afford to, and should consider paying £9.69 an hour instead, but some don’t even think that paying £8.75 for an hour’s work in Oxford is the right thing to do. And at the same time they presumably think they provide a good role model of education, knowledge, and understanding.
If the colleges are paying the minimum wage or a living wage but not the Oxford one, then the parent loses about £500 a year on a 22-hour term-time week. This can be equated to the price of a decent secondhand computer.Oxford University and colleges that choose not to pay the Oxford Living Wage are helping a child not to have a computer at home. Try today to get high GCSE results without a computer and access to the internet. It is nearly impossible although, of course, schools set aside computers for the children from the poorest of homes to use. Few people ask – who made the children poor? Or what it feels like for a child to be sitting in the poor room.
Oxford university’s draft strategic plan contains some priorities relating to local communities such as a commitment to “build a stronger and more constructive relationship with our local and regional community” including an aim to “increase the scale of innovation and translation in the medical and health sciences, including with our local NHS partners”. But how do such vague promises compare to concrete commitments to pay a decent wage and see local children as being important?
All English universities need to consider what might happen if we get a Labour government elected in 2022 (or before) in the middle of a post-Brexit crisis, with tuition fees abolished and perhaps levels of maintenance support reduced. Far greater numbers of young students would have to stay at home and go to university, which is the norm in Europe and it’s cheaper for individuals and government.
English universities should realise that they are slowly going to head, or maybe even quickly head, towards a more European model where a majority of children are going to go locally.
We only talk about the civic university in England because we, in all the universities in which I have worked, have managed to become so divided from the cities we are in.
…
This post is based on a conversation with John Morgan of the Times Higher Education is which available behind a paywall here; and which is itself based on an article available open access here.
The Times Higher article was published on the same day that a public lecture was given for My Fair London about how the moral sentiment changes as we reach, and hopefully begin to descend from: Peak Inequality.
And audio recording of that lecture is below:
A public lecture by Danny Dorling hosted by My Fair London,
University College Hospital Education Centre, 250 Euston Road, London, October 11th 2018
October 6, 2018
Inequality and Oxford
(1) In every university city in which I have lived a colleague has always pointed out how remarkably socially divided that city is. There is usually a road which is emblematic of the divide. One along which you pass by the homes of every social class, from high to low. As a child growing up in Oxford I was told that the emblematic example was Divinity Road. The social distance from the former ambassadors’ residences at the top of the hill to the drug dealer’s dwelling near the bottom was as steep as the road itself. I came back five years ago to find the bottom gentrified and the top elevated out of the price range of any retired ambassadors who lacked ‘family money’.
(2) Equitable cities are all alike; every unequal city is unequal in its own way. One reason the UK attracted so many migrants from more socially equal European countries is that inequality produces the chimera of opportunity. But there are far more opportunities at the bottom in more unequal cities. People with very large amounts of family money don’t clean their own homes, work behind a counter, or have a rudimentary understanding of DIY.
(3) Each English city I have lived in has had an area, ranging from just half a square mile in size to ten times that in which the housing was entirely unaffordable, or at least unaffordable to even the highest paid person in the public sector. Newcastle, Sheffield, Leeds, Bristol – each has its exclusive enclaves. The Oxford I left as a child was mostly affordable. The price gap between neighbourhoods was measured in 1986 as being just a few thousand pounds and everyone in need with children qualified for a council house in the city. I came back to find a weird dystopia where the poor were being offered housing in Birmingham and oligarchs were rumoured to be purchasing around Park Town.
(4) In each English city I have lived in someone has at some point told me that it is “the most divided city” in England. In truth, in contrast to what is normal in Europe, almost all English cities are remarkably divided, but Oxford is divided in its own special way. For such a small city it has managed to not only maintain but also increase some of the steepest social gradients found anywhere in Europe. These are the divides along and between its streets, its schools, and which typify Oxford society. This should be a great embarrassment to those of us who work in the University, but it mostly isn’t – which is one of the key reasons the divides are so wide and have grown.
(5) The academics of the University of Oxford appear largely unaware of the role their University plays in tilting the playing field of the city so sharply. Instead of that being acknowledged, what I hear most often are complaints that the housing allowances are not enough to permit one to live in a posher area – in those streets where those fortunate enough to be members of colleges that buy property for their governing body live.
(6) In other universities I have sat on committees set up to monitor the extent to which the university is helping the wider interest of the people in the city. Oxford was the first university I have worked in where the prevailing attitude appears to be that the city is lucky to have the university and exists largely because of it and to service its needs. I say prevailing, because many of you are exceptions to the common view. But if you are an exception please speak up a little more loudly.
(7) The University 2013-2018 strategic plan began by claiming that the structure of the University and colleges ‘creates an enduring sense of community’ and an academy identity that is ‘life-long’. This is questionable, but as someone who grew up in Oxford I can confirm that, so far, I have had a life-long sense that the University is not that interested in the communities of the city. The old plan included a commitment to contribute effectively to the social life of the city. So why are local people, including school children, still barred from our libraries in term time? Opening the doors would be the least we could do.
(8) The plan stated that ‘We believe that the size of the student population should be determined by the University’s capacity to provide a high-quality education to every student.’ I was struck by the arrogance of the statement. No university is an island, even one as surrounded by water as Oxford’s. Were that criteria truly applied then the student body could grew ever larger, the staff would swell, and the city would become a one-horse town. The reason Oxford is better than Cambridge is that there is so much more to the city than just a university, or two. But that advantage is being squandered.
(9) The University’s commitment to the wider community of Oxford in the 2013-2018 plan fitted neatly on a single page, page 10. It reads like the wish list of a selfish lover. Everything the University wanted to further its own expansion and desires was suggested as something it was doing for the wellbeing of the local community! Space does not permit a line-by-line analysis but this should be plain to any clear-eyed reader.
(10) The University is currently consulting on the 2018- 2023 strategic plan and Congregation will consider a draft on 30 October. The current draft contains just one paragraph on how the University will ‘build a stronger and more constructive relationship with our local and regional community’. Remarkably, it is an even more blatant statement of how we will continue to do what we want to do while declaring some of that as: ‘reaching out’. The document will likely be dissected by future social scientists to help explain the Brideshead Revisited moment we are living though today.
(11) I hope to be proved wrong. Perhaps Congregation may insert some lines in the plan that read: “In 2018-2023 the university will examine the extent to which its members’ actions over the course of the last century have contributed to Oxford’s current social problems. We will try to understand the extent to which we are responsible for the city being the most unaffordable to live in in the UK, having the tightest of greenbelts, having one of the most divided school systems in Europe, and suffering from a health divide between Oxford’s neighbourhoods that has grown so widely in recent decades.”
(12) It is laudable that the draft 2018-2023 plan includes a promise to ‘increase the opportunities for staff and students to travel sustainably around Oxford on bike or foot; benefitting their health and wellbeing and improving the local environment through traffic free cycle and pedestrian routes’. But the traffic problems of Oxford need to be solved for everyone in the city, all residents and tourists, not just for our staff and students in our part of the city. Many tens of thousands of people drive across the green belt every day spewing out pollution while the university boasts of its low carbon commitments.
(13) If the colleges as charities were more cognizant of their public interest remit they would look at the wider picture. Soon the first new secondary school since 1963 is to be built in the city. As I write it has no suitable site. Which college has offered up the fields it does not need or use for such a wonderful educational purpose?
(14) The draft plan states that: ‘A staff and student housing programme will be developed to deliver additional accommodation to mitigate the impact of the high cost of private sector accommodation in Oxford.’ But where will the people who staff the shops of the city live, who clean the hospitals and cater to the tourists that are attracted, after all, by the University?
(15) On education you can divide the children of the city of Oxford into ten cohorts of equal size from those sent to schools from which it is almost impossible to emerge without a string of A’s to those who will almost certainly not be going to any university. All this is predictable from home postcode and parental income. It is almost entirely unrelated to any inherent genetic endowment that each Oxford child may have.1 Very few children know others outside of their cohort. It would be hard to design a more segregated social system than this in such a small space.
(16) You may say that the schools of Oxford and the social divisions within the city are no concern of the University, although some schools are named after the colleges that helped found them. You may point out that a few undergraduates volunteer to tutor, but you know how little that has helped. Or you could ask what the University could do to help and why we do not know what that is. There is a great irony that at the very time we talk about decolonizing the university, we barely notice how we have been colonizing the city.
(17) Our attitude matters. The maintenance of pristine cricket pitches hardly ever played on while local schools have had to build over their fields due to lack of space sends a message. The burning of ‘the boat’ by particular colleges when they are head of the river after summer eights – while local schools cannot afford basic sports equipment – does not go unnoticed. There is a painful juxtaposition of new foodbanks and local teachers bringing in food for their pupils to eat, within a short distance of high tables where people (like me) can eat every day for free.
(18) Oxford had soup kitchens in the past. There was a period when they were not needed and the University was more open to students from a wider range of backgrounds. It may be complex but that is no excuse for us to pretend the problems of the city we live in are not also our problems. While we build new constructions out of the most expensive stone and marble, people in the city are sleeping in sheds. And some of them will serve you in some capacity today, but you can pretend it is not happening.
(19) I went to a primary school in Wood Farm and was recently asked by a former pupil, when she learnt we had both attended the same school, where my dad worked on the line. I had to say he didn’t – not everybody’s father did. That same week an old alum asked me which Oxford college I had studied at as an undergraduate. In similar fashion, I had to say that I had not. If you have to look up where Wood Farm is then you do not know the very small city you are working in.
(20) Of course there are positive signs too–often aided by heads of houses who grew up in a more progressive era and desperately wish to see it return. At least the University now becomes acutely embarrassed about admission and does much better than a tier of other universities that rank below it in widening access. At least we now hire from a far wider pool rather than concentrating so much on appointing so many men (and a few women) who gained their own degrees here.
(21) My view of the University is that somehow the parts are much nicer than the whole. It is a place full of well-meaning and concerned staff whose aggregate kindness and sincerity somehow fails to return a net positive outcome. This is a conundrum.
(22) Oxford University is a product of its geography and our society, of being at the heart of England in many different ways. When England was last at a peak of economic inequality in 1913 the university was not a progressive place. When England was most equal in the 1960s and early 1970s the University was changing its intake to include many more women and within the space of a few years more of the working class than it had taken in its entire history. Inequality stupefies the mind. Our new ‘aspirational’ targets are to take less than a single extra new student per college from the poorest 40% of society. Do we really have so little faith in our own ability to do better?
(23) Oxford University often ignorantly blames the country’s schools for not producing children with enough A’s for its admission tutors to consider. But it is much more plausible to blame the current state of England for making Oxford University so unimaginative in terms of what it does, and in not realising that what little it does do to reduce inequalities is so ineffectual.
(24) However, there is a silver lining. The Brexit embarrassment might help. As Brexit takes the shine off England’s many claims to greatness, even if Theresa May were to revoke article 50, we are – as a nation – going to have to take a long hard look at ourselves. The Brexit embarrassment helps demonstrate why being so out of touch is so bad. Oxford excels at out of touch – creating young men and women that it separates from society who then so often blunder when in high office.
(25) Incidentally, if May does revoke Article 50 – and she has the power to do so without having to consult a single official up to about 10pm on 29 March 2019–I would suggest we quickly commission a statue of her. There is a space on a plinth of Oriel College high above the High Street where a lonely-looking man appears to be about to step out and fall. I would suggest bringing him safely indoors and putting her up there instead. But we’ll still be debating our strategic plan long into Trinity term, so there is no need to put that particular suggestion in the strategic mix yet. We will know where we stand on Europe long before we have agreed what our real aspirations are. However, we have – potential.
—
1 There are tiny but still very interesting genetic effects on potential. Thankfully we do look at these in different ways now, rather then believe it is sensible to send the children of dons to America, as we did during World War Two, to preserve their special genes! See: Morris, T. et al. (2018) Testing the validity of value-added measures of educational progress with genetic data, British Educational Research Journal, DOI: 10.1002/berj.3466
First published as Dorling, D. (2018) Inequality and Oxford, The Oxford Magazine, No. 399, pp.3-4, October 5th (noughth week, Michaelmas term).
PDF and one-line access here and a story of the echoes of past divides in Oxford reverberating today can be found here.

Class war? ‘Posh’ end of Oxford street resurfaced (BBC News, September 7th 2018)
Danny Dorling's Blog

- Danny Dorling's profile
- 96 followers

