
Danny Dorling's Blog, page 22
February 4, 2019
A Very British Legacy: Attitude and Brexit
Brexit may be key to the future of inequality in the UK, and inequality may have been key to making Brexit possible.
The rise of inequality had repercussions that ranged from creating tax-evader-funders to fuelling mass-discontent. But behind inequality rising was a legacy of Empire thinking. Sally Tomlinson and Danny Dorling document much of this in the book “Rule Britannia” (1st edition published in January 2019). One point not made in that book follows:
In 1856 Lord Palmerston complained of what he called:”an anti-English feeling, an abnegation of all those ties which bind men to their country and to their fellow-countrymen, which I should hardly have expected from the lips of any member of this House. Everything that was English was wrong, and everything that was hostile to England was right“. Palmerston described the Chinese people, upon whom he was forcing free trade to allow the sale of British opium, as a “set of barbarians – a set of kidnapping, murdering, poisoning barbarians“. He is credited with the invention of gun-boat diplomacy.
Below is the audio recording of a talk given to school children on February 2nd 2019 in a room in St John’s College Cambridge, named after this particular British Lord. In many of his portraits Lord Palmerston appeared to be dead behind the eyes. He had a soulless look about him.


January 31, 2019
Brexit, Demography, Geography and the British
Brexit’s all about Geography; it’s all about borders; it’s all about issues of identity; and a lot of it is about history.
If you’re trying to work out what is strange about Britain trying to leave the EU (because there has to be something odd to be the first country to try to leave) perhaps you could start with its size. The UK is a particularly large European state. You would have expected it to be a small country within the continent that would have tried to go first (there are so many more of those). But the UK is one of the five large states of the EU: Spain, Italy, France, Germany and Britain. One thing that is odd about the British is that they are in the economically most unequal state..in Europe. But that is not all that is very strange
.., a talk given in Oxford on January 30th 2019.
Danny Dorling speaking on Brexit, Demography, Geography and the British. A schools talk at the Oxford Branch of the Geographical Association, North Wall Theatre, Oxford, January 30th 2019 – audio recording above, for book click here.
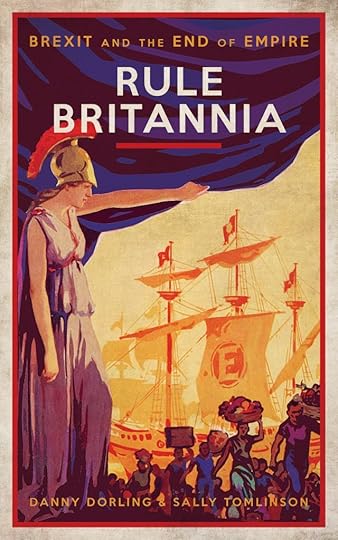
Rule Britannia: From Brexit to the end of Empire – published January 15th 2019
January 27, 2019
Who spends more wisely: Individuals or government?
Will 2019 see an end to austerity? Last year, the Chancellor announced that the ‘era of austerity is finally coming to an end’ nearly four months after Theresa May said she would be willing to break her stance against tax increases in order to fund her pledge for an annual £20 billion for the NHS by 2023. Shadow chancellor John McDonnell reacted with disbelief to the chancellor’s declaration – Labour had just called for £108 billion in additional public spending to address the damages of a decade of austerity.
In previous blogs I have criticised how the factory model of taxation treats the government’s budget as if it is limited to what it chooses to tax. Anyone taught even the most rudimentary economics at school knows this is not true – but, of course, most people are not taught such rudimentary economics at school. Furthermore, politicians who are opposed to public spending often choose to treat the public with disdain, telling them that they ‘cannot spend what they do not tax’.
In the past, politicians have sought to justify new or increased taxes through actual, or presentational, hypothecation – i.e. telling the public that the revenues will go towards a specific service. A national insurance scheme, for instance, has been proposed as a way to pay for a national health service and cover social security spending. Within a few decades the tax is still levied, but by that point has simply become general taxation. And so, again, politicians may somewhat disingenuous in suggesting that such policies can last.
The debate at present often lacks any analysis or recognition of what is best spent publicly and what is best spent privately. For example, in terms of who is best placed to make spending choices on social care in old age, or whether student fees should be paid by the state, through a graduate tax, or through loans taken out by students who do not have their fees paid by their parents.
In general, the state is a far more efficient provider of infrastructure than private toll road entrepreneurs or those who would wish to have all public parks privatized. It is especially the case that when goods are bulky, and infrequently purchased, any individual can be easily duped. No one should wish to become such an expert at heart surgery such that through their repeat purchase of by-pass operations, they become an informed consumer. It follows then that state-funded health care is best. Similarly, no one should wish to repeat so many years at school that they become an expert in selecting educational providers. Painstaking international research has shown that any country that does not have a mixed model of state and private housing provision will quickly have a serious homelessness problem.
In short, for items that you buy often – where the consequences of making a mistake are not dire – the private market can be most efficient. But even in transport, countries that have come to rely too much on private cars suffer from the greatest congestion, pollution and obesity, as well as the inefficiencies of traffic jams and huge debts required to purchase yet more cars.
After over a decade of austerity in this country, I would stress that when it comes to money it is the poor who are by far the most careful spenders. If you believe in the efficiency of private consumption, you should aim for the poor to have more to spend as they allocate money so much more wisely than the rich. Conversely, if a little more of the wealth and income of the rich were taxed and spent better by the state, we would all be better off.
For a link to PDF file of this article and the origin blog on the CoVi website click here.

Nuneaton, December 17th 2018
January 18, 2019
Brexit and Empire: two days after the first ‘meaningful vote’
What is happening with Brexit? Why is it happening and what are the reasons behind the reasons for how the British are behaving?
A public talk by Danny Dorling, given at the University of York on Thursday 17th January 2019
Rule Britannia: From Brexit to the end of Empire – published January 15th 2019
December 21, 2018
Annual Report of the Chief Medical Officer, 2018, Chapter 6: Demography
The UK has fallen down the rankings significantly … for life expectancy at birth. In the most recent two years ONS has reported statistically significant increases in infant mortality across England for all infants.
An edited extract of the start of Chapter 6 of the Annual Report of the Chief Medical Officer: Better Health Within Reach, London: Department of Health and Social Care, published on December 21st 2018:
Health 2040 – Better Health Within Reach
“Every part of the health system has a role to play in
creating a healthier and fairer future. The fortunate
truth is that we already know how to make fantastic
improvements and prepare for better health that is
‘within our reach’.”
Prof Sally Davies, Chief Medical Officer, England
Figure 6.1 Age-sex standardised mortality rates for England Quarter 1 2001-2018
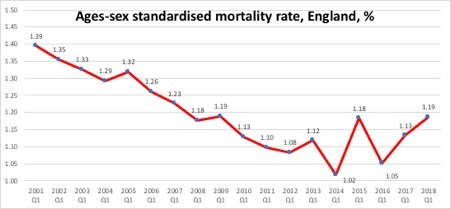
Note: shows proportion of people dying each year in England at quarter 1 rates
Source ONS data, 2018
1.1 Life expectancy
Period life expectancy, derived from age-specific death rates in a given year, is widely used as an indicator of how well a country is performing in improving the health of its people. It has been improving steadily, albeit with some small fluctuations, for decades in high income countries. However, in recent years, these improvements have stalled in England and Wales and, in some older age groups and in some places, it is even declining. There are similar concerns about Scotland and Northern Ireland, but these have been studied less intensively. When the rate of improvement in life expectancy has slowed, stopped, or reversed elsewhere in the past, for example in Eastern Europe in the 1980s, after data artefacts, epidemics, wars, major natural disaster, or mass migration have been excluded, the outcome has often pointed to substantial societal problems.
Figure 6.1 shows the age-sex standardised mortality rate for England from 2001 to 2018, as a percentage. Figure 6.2 shows the resulting trends in life expectancy at birth as reported by the ONS from 1840 to 2016.
Figure 6.2 Life expectancy at birth in England and Wales, 1840-2016
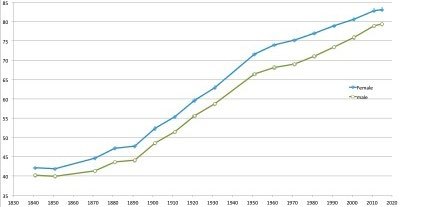
Life expectancy at birth in England and Wales, 1840-2016
Source ONS data, 2018
After 2010 there is a clear slowdown in the rate of improvement of life expectancy, and increase in age-standardised mortality. The reasons have been the subject of much speculation. Proposed explanations include cohort effects, reflecting influences on health and mortality long ago, or contemporary phenomena such as the lethality of seasonal influenza could play a role. However, several studies have also suggested that the austerity measures, introduced by the coalition government that was elected in that year, could also be playing a role, given the sections of the population most affected and the timing of policy changes, as the long term year on year increases in spending on health and social care slowed dramatically.
This last explanation finds support in an examination of changes in life expectancy at different ages. Consistent with the general trend, life expectancy at older ages had been rising steadily, if anything with a slight acceleration in the period immediately prior to 2011. Table 6.1 [see published chapter] presents the change between consecutive three-year averages (to smooth annual fluctuations). A very similar trend is seen for men and women, and for life expectancy as measured from either age 65, age 75 or age 85. In every case, the size of improvements declined markedly after ‘2008-2010’ and ‘2009-2011’. What is especially worrying is how the oldest groups have experienced actual declines in the most recent period. The worsening of life expectancy for women over 85 years was first raised as an issue of immediate concern over three years ago, yet it received little attention then and little since, despite becoming much worse year on year.
Both a PDF version of the full chapter and the link to the Department of Health and Social Care full report can be found here.
December 17, 2018
Brexit: Remain and the Unicorn
We gave people a choice, back in 2016 between carrying on with David Cameron, with life as it was, crap as it was, or a unicorn. The unicorn was Leave. The unicorn was a promise: “Leave and everything will get better”. If you give someone a choice between remain as they are, or fly with the magical unicorn, and where they are is bad, they will vote for that unicorn.
The people who most often voted Remain are in my city in Oxford, they are doing well, and in Cambridge, in London, and in Bristol and in Manchester… but in most of the country most people voted for the unicorn. And the really difficult thing between now and the 29th of March, is telling people: “sorry it has always been a unicorn, you were mislead into believing you were being offered a choice, a real choice, it was never a real choice“.
These are a few words from towards the end of a lecture given on December 17th 2018 in Nuneaton:
Click play, above, to hear the full talk given at King Edward VI College, Nuneaton, Warwickshire on 17/12/2018.
The book this talk is based on is published on January 15th 2019: Rule Britannia: Brexit and the end of Empire.
Most people who voted Leave lived in the South of England, but not in the affluent south:
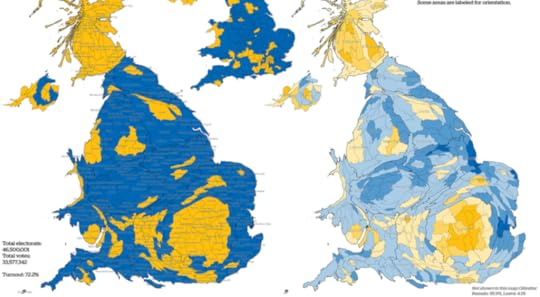
Areas are shaded by whether a majority who voted voted to Leave or Remain and also by the proportions voting in these ways
If you are interested in medicines, if you are interested in aeroplanes, if you are interested in food even – everything becomes very tricky if there is a hard Brexit. The Conservative party are currently having the greatest argument within their party that they have had since the debate over the Corn Laws. They are a party split between a small group of MPs who believe it is possible to Leave with a hard Brexit, and most members of the Parliamentary Conservative party who don’t believe that – and who want a deal with rest of the EU. And then there are so many other MPs in the House of Commons who want to Remain, and want no deal.
If you are the Prime Minster, or a new Prime Minister elected by MPs, and you had to break it to the country that they had been offered a unicorn – the way to do it is to leave it to the very last minute – as project fear turns into real fear.
At some point in March you (if you are Prime Minister) write a letter and you rescind Article 50. But even after that happens you are still going to have chaos, because some people are going to be so very very very angry – for a very long time.
Nuneaton, December 17th 2018
If you want to read more, then there is more here, or – if you just want to listen – just click play below….
For the ‘Brexit 2019 soundtrack’:
Merry Christmas!
December 15, 2018
Short Cuts (homelessness)
Today, one person in every two hundred in England and Wales is homeless – either sleeping rough or living in temporary accommodation. In London the proportion is even higher: one in 53. In Kensington and Chelsea it’s one in 29: in that borough alone 5,263 people are homeless. They are mostly not the same people as the homeless there last year. Most of those will have moved on to another area; some will still be homeless, some will have found housing of some kind, some will be dead
The number of homeless people started to increase around 2010, with the implementation of austerity. Between 2010 and 2011 the numbers living in temporary housing or on the street doubled in seven London boroughs. This pattern wasn’t confined to London: nationally, homelessness doubled and doubled and doubled again. You could argue that the census form should start to ask: ‘Have you ever been homeless, and, if so, when and for how long?’ It is not a question that has been put before. The last time people were asked if they had hot running water in their home was in 1971. We expect progress, but we don’t always get it. Many children spent last Christmas in a single room with a microwave in a B&B. In the first quarter of this year 123,130 children in England were living in temporary accommodation. That figure has been rising every year for a decade; it’s up nearly 80 per cent since 2011. Ten years ago, in January 2009, it was so low that housing charities were focusing instead on children living in overcrowded conditions.
In the 12 months to October, 449 homeless people died on the streets or in temporary accommodation, the highest proportion in January. A fifth of them were women; the gender of a tenth of the bodies could not be immediately determined. The annual number of homeless deaths has risen at least tenfold in the last five years, far more quickly than the increase in rough sleeping.
Why did homelessness rise so quickly after 2010? The problem is not a shortage of housing. The 2011 census confirmed that there are enough houses in the UK, and that there are more bedrooms in these houses than ever before. Even in London, there are more bedrooms in houses and flats than there are people to sleep in them. There are, for the first time, enough bedrooms for everyone to have their own, if they want it.
Since 1981 housing in England and Wales has been increasingly unevenly shared out. For the sixty years between the censuses of 1921 and 1981, as well as new housing being built each decade, the housing stock was better distributed at the end of each decade than at its start. In every census fewer homes were found to be empty or under-occupied or overcrowded than in the one before. A growing proportion of the housing stock was allocated on the basis of need. Families were offered council houses that had a commensurate number of rooms. In the private market, as incomes became more and more equitable, behaviour changed. People were more likely to buy homes closer to the size they needed, instead of much larger ones. Meanwhile, the inefficient private rental sector shrank.
We know that 1981 was a turning point because of work done by Rebecca Tunstall of the University of York. She has found that around this time the number of empty rooms in privately owned homes started to rise rapidly. As income inequality widened more rich people purchased holiday houses and city pads, making it harder for locals to afford homes. After Thatcher implemented her right-to-buy policy in the 1980s, the public housing stock – especially of more desirable properties – decreased, and so fewer homes were allocated on the basis of need, since councils owned fewer properties and weren’t allowed to build more. A maisonette that would have been home to a family of four became the property of a single yuppie (the number of one-person households has risen from 17 per cent to 28 per cent since the early 1970s).
The situation worsened in the 1990s, but the steepest increase in wasted housing space came during the New Labour years, between the censuses of 2001 and 2011. By 2011 the richest tenth of households in England and Wales had five times as many rooms in their homes, per person, as the poorest tenth. There was no longer any slack in the housing system. A much larger proportion of the few homes coming on to the market in the years after the 2008 crash were being bought by private landlords. Rent rose to whatever level the market could take. Homelessness duly began to rise in 2010.
One of the very first pieces of legislation the coalition government passed when it came to power in 2010 was a bill amending Empty Dwelling Management Orders. The Labour government had introduced these to enable local councils to take possession of disused properties and make them habitable. Any property that had been empty for six months could have an order applied to it. The scheme had been introduced in 2006 when homeless rates were low, and had helped them stay that way. Only a hundred or so orders were made while Labour was in power, but landlords knew they existed and made sure that their properties weren’t left empty. The coalition extended the length of time a landlord could leave a property empty in England from six months to two years. The next year only 17 homes had orders applied to them and many thousands of properties were left empty. By 2015 six hundred thousand properties in England were empty, but continued to make money as house prices rose. There has been a huge increase in evictions at the end of tenancies, the result of relentless rent increases. A quarter of all children in England live in properties owned by a private landlord and have on average just two months secure tenancy. Their parents are paying more per square metre to be housed than any other group. Tenancies coming to an end are also the main driver of the increase in street homelessness (families with children receive emergency housing).
When he was housing minister Brandon Lewis, now Conservative Party chairman, said that the compulsory purchase of disused property was ‘an ineffective and unpopular policy of the last administration, which undermined civil liberties and which simply didn’t work’. Lewis held the job until July 2016 when he was replaced by Gavin Barwell. Less than a year later Barwell was replaced by Alok Sharma. Having served for under seven months Sharma was replaced by Dominic Raab. Raab lasted six months before giving way in July to Kit Malthouse. In 2004, as deputy leader of Westminster Council, Malthouse had introduced the policy of using police officers to help street cleaners hose down areas where homeless people slept. Last December, the Public Accounts Committee announced that as many as 9,100 people were sleeping rough on the streets on any one night in England. ‘The Department for Communities and Local Government’s attitude to reducing homelessness has been unacceptably complacent,’ it said. ‘The limited action that it has taken has lacked the urgency that is so badly needed and its “light touch” approach to working with the local authorities tackling homelessness has clearly failed.’
What is to be done? A few schemes are being piloted, often poor copies of ones that have worked elsewhere, for example in Finland, where homelessness is low and falling. But the dominant narrative in this country tells of the perceived failures of those who become street homeless: their alcohol dependency, substance misuse, and ‘high/complex needs’. I saw my first dead body when I was a child, walking to the pantomime in Oxford in the early 1980s. My father told me that the man was sleeping, but he wasn’t. I remember us staying with the body and how long it took for the ambulance to arrive. They were in no rush. I remember that we were late for the show. I couldn’t see the man’s face – only his coat and hair.
References
Butler, P. (2018) At least 320,000 homeless people in Britain, says Shelter, The Guardian, November 22nd.
Osborne, H. (2015) Powers to bring empty houses into use ‘ignored’, The Guardian, February 11th.
Public Accounts Commitee (2017) Government’s complacent attitude has failed homeless, 78,000 households are homeless, HoC, December 20th.
Shelter (2009), Overcrowding Figures up, Press Release, January 29th.
Shelter (2017) 128,000 children in Britain will be homeless on Christmas day, 6 December.
Wearmouth, R. (2018) New Housing Minister Kit Malthouse Admitted Making Homeless People’s Lives ‘Uncomfortable’, The Independent, July 9th.
Click here for a PDF and link to the on-line LRB copy (without references)
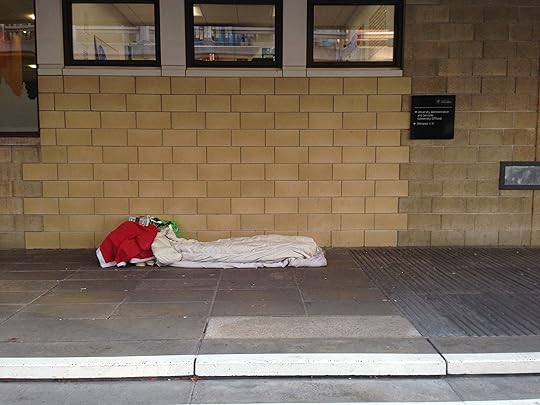
Bedding down for the night, University Offices, Wellington Square, Oxford, December 14th 2018
December 14, 2018
Ireland: When everyone you know buys art, or a sculpture, to upgrade their life
People protest when they can take no more, but also when there is a glimmer of hope: When it becomes obvious that there is enough to go around, but despite that all boats are not being lifted. People protest when they find out just how much is being squandered and how little the elite know; or care.
Seamus Power (2018) quoted Alexis de Tocqueville (1856) who pointed out that it was ‘…in those parts of France where there had been most improvement that popular discontent ran highest’. The French revolution occurred when and where it did within France not only because there was great suffering and poor harvests, but also because the squandering of great and growing riches had become so clear to so many.
Ireland is not about to have a revolution, but in contrast to every other affluent nation it has suffered by far the greatest crash. Figure 1 shows how public expenditure rose to bail out banks in many countries, but more in Ireland and then the subsequent choices made to cut down on public expenditure.
Figure 1: public expenditure as a proportion of GDP 2002-2020
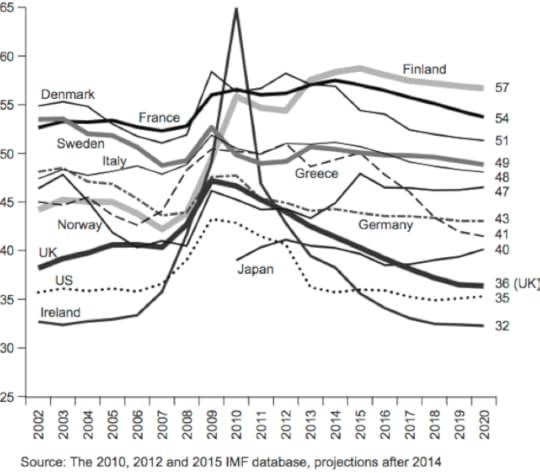
Figure 1: public expenditure as a proportion of GDP 2002-2020
In the USA protest erupted in the 1960s when it became clear that a large proportion of the population were not being listen to. They were simply unheard, not even ignored but unknown. Speaking three years after the Watts riots of 1965 Martin Luther King told an audience at Grosse Pointe High School:
‘It is not enough for me to stand before you tonight and condemn riots. It would be morally irresponsible for me to do that without, at the same time, condemning the contingent, intolerable conditions that exist in our society. These conditions are the things that cause individuals to feel that they have no other alternative than to engage in violent rebellions to get attention. And I must say tonight that a riot is the language of the unheard.’
In England, the riots of 2011 where mainly confined to London. They were not riots over austerity. Instead their geography revealed economic inequality to be key. It was where there was most to be looted, where the riches and ignorance of the very affluent were flaunted most that rioting was most common (Dorling and Lee, 2014).
Figure 2 shows that more rioters lived in a ring of boroughs outside centre London than in entire English regions located far away from the capital and far away from where the shopping malls of the rich (Dorling, 2014).
Figure 2: The regions of England and boroughs of London sized by the numbers of people accused of riot in 2011
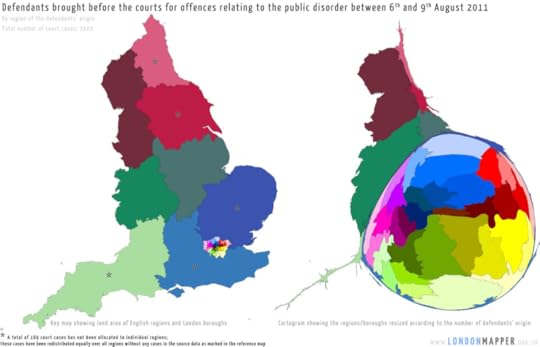
Figure 2: The regions of England and boroughs of London sized by the numbers of people accused of riot in 2011
Seamus Power suggests that: ‘In the Irish context, people accepted austerity because they believed by doing so the entire economy would benefit’ (Power, 2018). However, emigration rose rapidly. Hardly an example of accepting austerity.
On 30 September 2008, a ‘bank deposit guarantee’ was introduced that made people wonder why it was needed. Within days the crash had begun. Most probably just after 10pm on 2 October 2008 when the chief executive of the Financial Regulator of Ireland appeared on Irish television news. As Michael Lewis so eloquently explained, quoting Colm McCarthy three years after these events, the reaction of the Irish public to that man’s appearance was: “they saw him and said, Who the fuck was that??? Is that the fucking guy who is in charge of the money??? That’s when everyone panicked” (Lewis, 2011, p.98).
Analysis of large scale survey data taken each year in Ireland between 2004 and 2014 recently revealed that life satisfaction reached a minima in 2010, driven by the despair of those who were worse-off. Social trust fell and in 2010: ‘belonging to the lowest income quartile … had a significant negative impact on life satisfaction. This is in marked contrast to 2008, where the income stratification of life satisfaction was completely due to subjective economic hardship’ (Weckroth, M., et al., 2017). In other words, by 2010, the poorest in Ireland had come to realise that they were disadvantaged as a group whereas just two years earlier their answers to survey questions did not reveal such a knowledge.
Only analysis of survey data taken from across a whole country can tell you when the overall mood changes. Anecdotes, such as that of Colm McCarthy quoted above, help identify plausible trigger points. Anecdotes also identify the ignorance of the elite, such as the rich Irish women quoted by Power (2018) who said that prior to the crash she did not know anyone ‘who didn’t buy art, or a sculpture, or something to upgrade their life’. Power suggests that when the crash came the rich lost the most. He says: ‘in objective terms their relative loss is greater’.
But, in objective terms, who really lost the most? Was it the person who now has to sleep in a car because they can no longer pay the rent on their old home. Or the person whose home is now worth a few hundred thousand euros less, but they still live in it and own it?
Most recently the situation in Ireland has become much worse as Figure 3 reveals. Cuts are a political choice, not inevitable.
Figure 3: Ireland: public expenditure as a proportion (%) of GDP 2001-2022, original and most recent IMF estimates and projections

Figure 3: Ireland: public expenditure as a proportion (%) of GDP 2001-2022, original and most recent IMF estimates and projections
Coda: On why there was a sudden shift in Figure 3 above see Paul Krugman, Leprechaun Economics and Neo-Lafferism, New York Times, November 8th 2017
References
Dorling, D. (2014) Mapping the August 2011 riots, The New Statesman, August 5th,
Dorling, D. and Lee, C. (2014) Inequality Constitutes a Particular Place, Chapter 7 in D. Pritchard and F. Pakes (Eds.) Riot, Unrest and Protest on the Global Stage, pp.115-131, Basingstoke: Palgrave Macmillan.
Lewis, M. (2011) Boomerang: the meltdown tour, London: Allen Lane.
Power, S. (2018) The Deprivation – Protest Paradox: How the perception of unfair economic inequality leads to civic unrest, Current Anthropology, Volume 59, Number 6, December.
Walters, M. W. (2015) ‘Mortal Men and the City of Baltimore’, The Huffington Post, 28th April,
Weckroth, M., Kemppainen, T. and Dorling, D. (2017) Income-based social stratification of life satisfaction in Ireland between 2004 and 2014, Irish Journal of Sociology, 25, 2, 128-149.
click here for pdf and link to journal article to which this is a commentary.
December 12, 2018
Things Fall apart: Brexit, immigration, crime, health and wages
As Bobby Duffy explained in November 2018, when it comes to Brexit and our understanding of what is going on, we live in a remarkably divided society today where people now see the same facts in utterly different ways.
Article first published in Public Sector Focus – December 12th 2018
The differences are most stark when it comes to crime. A majority of people in Britain (and three quarters of all Leave supporters) believe that immigration from the European mainland into the UK has increased crime levels. This is despite the best evidence from the Migration Advisory Committee finding no link. And a great deal of other evidence suggesting that the economic boost migrants provide, and their contribution to keeping health and educational services running, actually makes it far easier to run cities in ways where more people do not feel they need to resort to crime.
But most adults in the UK when surveyed doggedly continue to say that immigration has increased crime, that it costs the country money, uses up precious scarce recourses in housing, education and health and is, overall, to the detriment of the people of the UK, or at the very least to the people of Wales and England. As Bobby Duffy goes on to explain:
“…these misperceptions are not just about us being misled by politicians or the media – they are more emotional than that. We exaggerate what we worry about, so what we get wrong is as much a reflection of our concerns as a cause of them. Attempting to change people’s views of Brexit solely with a more evidence-based description won’t land, because it misses a large part of the point: our allegiances affect our view of reality as much as the other way round. Our misperceptions are, in the end, an incredibly direct measure of how divided the country is: that groups of fellow citizens can see the same realities so differently shows the monumental task we face in finding any common ground.”
[Source: Duffy, B. (2018) ‘The public is shockingly wrong in its perception of Brexit – and there’s a simple reason why’, The Independent Newspaper and Yahoo News, 28th October]
International migration shrunk dramatically in the year from June 2016 to June 2017
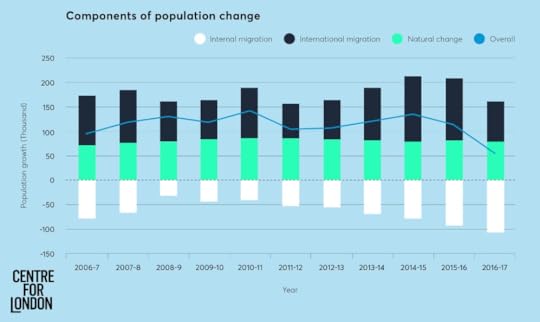
Population change in London due to migration, births and deaths 2006-2017
Source: The London Intelligence – Issue 5 8 August 2018 by Silviya Barrett, Tom Colthorpe, Erica Belcher
What will be most interesting as the Brexit process rumbles on is how people in the UK react to the rapid and large drop in in-coming migrants that has already started. In August 2018 we learnt that international migration to London had collapsed in magnitude, almost halving in just one year. On top of that there has been a continued increase every year since 2010 in London residents leaving the capital. More people are leaving the London to live somewhere else in the UK than are coming in from elsewhere in the UK. Back in 2008-9 three times fewer (net) were leaving, despite the banking crash of that year. It was only once salaries fell after the 2008 crash that London became just too expensive for more and more people. So fewer migrants are now coming to the capital and more residents are also leaving it. The net result is more empty homes in London. As a young London banker told me in 2009 “The party’s over”. Sometimes it takes up to a decade for people to realise that.
So, what about the most recent trends in health? On the 23rd of October 2018 ONS released their latest recent data on age-sex adjusted mortality ratios which showed that in 2017 they remained below, in other words worse, than the levels attained in 2014. There is a direct relationship between these measures and life expectancy. When life expectancy figures are released in the coming weeks they will show that falls in many areas of the UK are continuing. Nothing like this has been seen since the Second World War.
Age-sex-standardized mortality rates 2010 – 2017
(mortality rate per 100,000 people), England & Wales.
Persons Males Females
2017 965.3 1,124.0 836.8
2016 966.9 1,128.4 838.2
2015 993.2 1,156.4 . 863.8
2014 953.0 1,121.3 821.9
2013 985.9 1,158.3 852.6
2012 987.4 1,159.4 856.1
2011 978.6 1,159.6 842.1
2010 1,017.1 . 1,201.4 . 876.8
Source ONS (2018): Deaths registered in England and Wales (series DR), 23rd October
The UK was very unusual even before the vote to leave the EU was taken. In 2015 it was the only country in Europe that was suffering from falling wages, despite GDP then growing. It was almost as if those in charge of wage setting wanted to punish the population to annoy many in the middle enough to vote Leave. All the net rise in GDP that year, the year before the Brexit vote, went to those who owned companies and shares. Furthermore, they took a little bit more than that even, by reducing the wages of their workers despite not needing to.
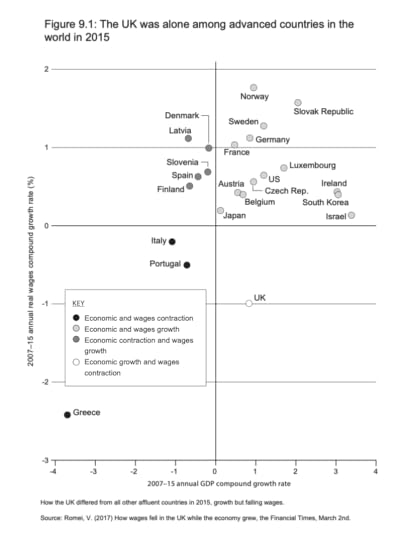
Growth in GDP and wages 2007-2015 European and other affluent countries
Thing fall apart when empires crumble. The value of housing in Amsterdam fell for more than two hundred years, in real terms, after the peak was reached there. The idea that what is currently happening in Britain is ‘just a blip’, is wrong. You have to travel back in time to the collapse of the Soviet Union to find the last sustained series of mortality rises in Europe, outside of war.
We fail to see what is worse and imagine other ogres that are not there: ever rising numbers of criminal immigrants, profligate minorities taking ‘our’ homes, ‘our’ jobs and ‘our’ schools. Soon we will be able to look around and ask why they have stopped coming, and helping, and then try to work out what it was that really went wrong in Britain at the start of the 21st Century.
Note – this short article is expanded on further in: Dorling, D. and Tomlinson, S. (2019) Rule Britannia: Brexit and the End of Empire, London: Biteback, published January 15th
Click here for link to PDF and on-line original article.
December 11, 2018
Globalisation: how Britain fits in
How important is Britain in the world today, digitally, socially and financially? A talk by Danny Dorling looking at globalisation in the context of the digital social world and consider key trends in development and global inequality.
How important is Britain in the world? What might happen in the next few months that could effect that?
Sociology in Action
Sociology Study Day for A-Level Students
Monday 10th December 2018
The Emmanuel Centre, 9 – 23 Marsham Street, London SW1P 3DW

Danny speaking in the Emmanuel Centre
Danny Dorling's Blog

- Danny Dorling's profile
- 96 followers

