
Danny Dorling's Blog, page 26
August 16, 2018
Tip-toeing to the right in the UK (1979-2014)
In hindsight we should have seen it coming. But none of us did, or at least no one who looks for the best in others.
There was widespread shock when the electorate of the UK voted to leave the EU. They did this with a ratio of those who voted of 51.9 to 48.1. However, had we considered the graph below – a graph that could have been drawn as early as 2014, but was not – we might have been less sanguine and less surprised.
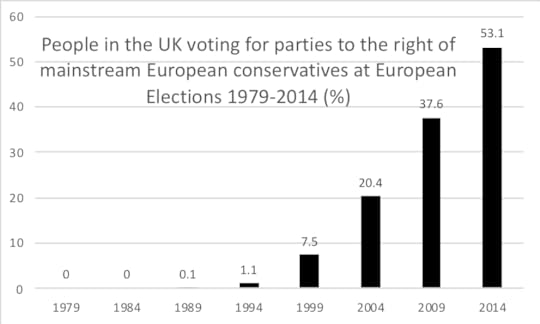
People in the UK voting for parties to the right of mainstream European conservatives at European elections, 1979-2014 (% of all those voting)
The graph above is a summary of the results of each European election that has been held in the UK since joining the then European Community in the mid-1970s. The first election was held in 1979 where the Conservatives won 48.4% of the vote and 60 of the then 81 seats available. No obviously far-right political party put up candidates. The group ‘United Against the Common Market’ did secure 27,506 votes, or 0.2% of all votes cast, but they appeared to be an across the board alliance. They did not put up candidates at the next European parliamentary election, held in 1984.
In 1989, the far-right National Front stood for the first time in an election and won 1471 votes, or less than 0.1% of the popular vote. By the 1994 election, the National Front increased their vote to 12,469 and UK Independence Party (UKIP) stood for the first time, gaining 150,251 votes or around 1.1% of the total vote. In the next European election in 1999, UKIP increased their vote to 696,057 supporters and the British National Party (BNP) stood in place of the National Front, securing 103,647 votes. The combined vote of the far-right climbed to 7.5%
After the millennium, in 2004, far-right voting in UK European elections jumped again, to 20.4% of all who voted. UKIP had become the third most popular party securing just by themselves 15.6% of the total vote, while the BNP also rose to become the fifth most popular party, securing 4.8%. The other parties began to take notice and, in particular, the Conservative party began to fear losing votes to these far-right alternatives, parties which advocated leaving the European Union.
At the next UK European Parliamentary election, held in 2009, I assigned half of Conservative votes to being to the right of European Conservatives in drawing the graph above. This is because the British Conservative and Unionist party position at that point was ambiguous, as they had withdrawn from the European Conservative bloc at the European Parliament, but had yet to align themselves with a new bloc. Thus, in 2009, 27.4% of the vote went to the Conservatives; UKIP got 16.0% of the vote, BNP 6.0%, English Democrat 1.8%, and a minor celebratory called Katie Hopkins won 0.1%. Half of 27.4 plus 16 plus 6 plus 1.8 plus 0.1 is 37.6.
By 2014, the UK Conservatives were allied with far-right parties in Europe and no longer at all associated with the main conservative European People’s Party block. By then the Conservatives were full members of a bloc of MEPs in the European parliament that was to the right of all traditional European conservatives. Summing up, in 2014 the Conservative’s had 23.1% of the vote, with UKIP’s 26.6%, the new ‘An Independent from Europe’ party’s 1.4%, the BNP’s 1.1%, the No2EU’s 0.8%, the new ‘Britain First’s 0.1%, resulted in a 53.1% vote for parties right of mainstream European Conservatives.
From then on, in hindsight, perhaps the writing was on the wall.
The map below shows the geographical outcome 2016
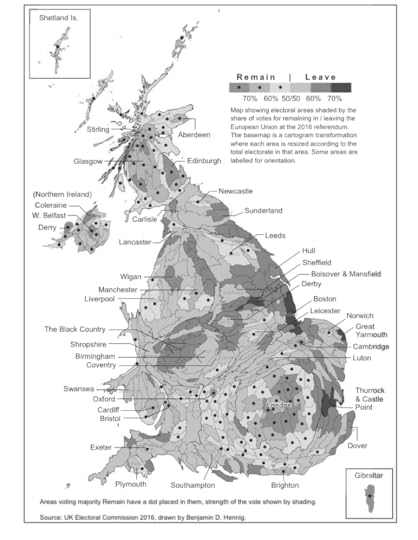
The Geography of the 2016 EU Referendum vote
For a PDF of this article and link to the original posting click here.


August 10, 2018
The contraction of the financial sector takes place very quietly
Hidden in the detail of these figures was the news that Britain’s finance and insurance industries had shrunk, albeit only by a tenth of one percent. While the rest of the UK economy was growing, very slightly and slowly – more slowly than in recent years – growth in finance and insurance activity was negative.
The size of the contraction in these industries in the last quarter was roughly half of that in public administration, which has continued to be squeezed by public spending cuts. Most recently, it was reported that Northamptonshire County council will be making future cuts of up to £70 million. When the cuts in public sector spending were announced, the BBC reported one protestor as saying: “When people die this winter, because they will die this winter, the blood will be on your hands.” Contraction often occurs through a thousand small cuts.
In April 2018, the European Banking Authority (EBA) announced that that the salaries of the highest earning bankers in Europe had begun to fall. Almost all of the highest earning bankers are based in London. The EBA is currently based in London, but will be moving to Paris soon.
Unlike public sector cuts, which have immediate and obvious effects and result in protests reported by the BBC, the contraction of the finance and insurance industries in the UK takes place very quietly. It is not in the interest of the banks to point out who among their staff is moving to Paris or Frankfurt or Amsterdam and whether it is the younger bankers and lawyers without families who are moving first. And it is not in their interest to point out that they are now paying themselves less, as most people still understand that the highest paid bankers have been paid far too much. But hidden in today’s ONS report is yet more evidence of the contraction of what had been the UK’s most successful industry.
read more posts on this topic here, and see the PDF and link to original blog this post is based on.

Taken by Kristian Buss
on 14 November 2011 in London. The photo shows partygoers from
the fictional Swillindon club, who tried and failed to gain entry
to the Lord Mayor’s Banquet that evening
August 7, 2018
Which children in Britain will have no holiday this summer?
The majority of the poorest fifth of children living in the UK have no summer holiday – or any holiday at all each year – and this has been the case for at least a decade now. However people are now learning to lower their expectations.
When children in the UK are grouped into five equal sized groups, 50% of the families of the poorest 1 in 5 of all children report that they cannot afford to take a week away on holiday where they go away from their home and don’t stay with family or friends. They say they would like to do this, but simply cannot afford to. These children have no holiday at all, not just during the summer months, they have none at any time of the year.
Some 45% of the next fifth of children, almost half of all those whose families live on modest incomes, cannot afford a holiday but would like to have one – just one week away a year.
Over a quarter (27%) of children living in households receiving average incomes cannot afford one holiday a year. More than one in seven of children in affluent households in the UK, in the next fifth cannot afford a holiday – their parents’ income may be over-average but it is also very possible that their housing costs, the rent or the mortgage, are just too much to also be able to afford to have a holiday now.
And finally, remarkably, one in 25 children in the richest fifth of families in the UK say that they too would like, but cannot afford one week’s holiday a year. It is very possible that their outgoing are also too much in one particular year. Or they may not consider the cheapest of holidays a suitable holiday.
Children growing up in the UK today are living parallel lives. Almost all of (96% of) the richest fifth of children will have at least one holiday a year, but half of the poorest fifth have none. The graphic below was drawn as part of a storyboard produced by Oxford University’s Oxplore team to illustrate this:
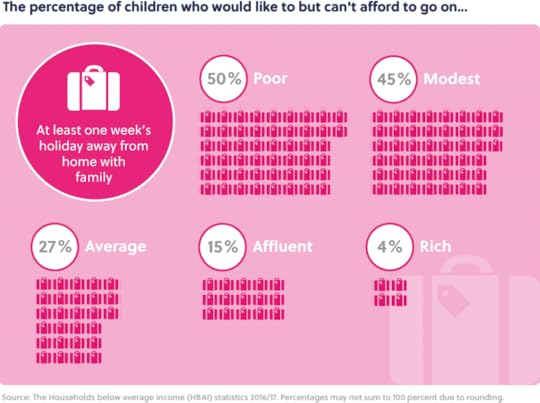
Percentage of children who would like to but can’t afford to go on holiday for a week, latest estimates.
If you were wondering which group your family is in then take a look at the graphic below. It shows the average median household incomes for each of the five groups of families in the UK from the poorest fifth to the richest fifth at of 2016/2017. These statistics are for household total income before tax is deducted and before housing payments are made. They are the total of pay and benefits received each year by everyone in the household (adjusted for household size).
If you live in a household that relies on an income of around 12,000 pounds a year to live on, 1000 pounds a month, you are in the poorest fifth of households. However, if you or your parents have a combined income of around 43,000 pounds a year, then you are an average member of the richest fifth of families with children currently living in the UK. Very few adults, let alone children, are aware of just how little or much money different families have to get by on today. The UK is most most economically unequal country in Europe.
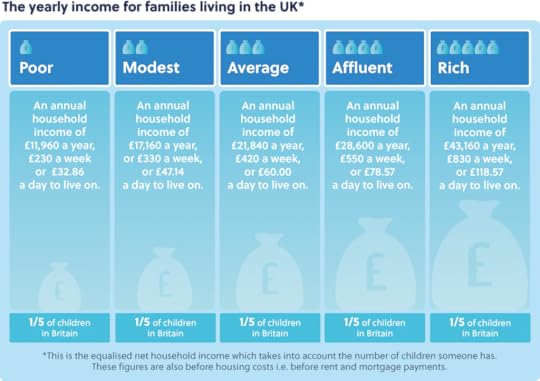
The yearly income of families living in the UK
Over time the proportion of families who have said that they want a holiday but cannot afford one has been falling. This is not because families have been becoming more affluent, we know from other sources that average wages have fallen and benefits have fallen in real terms. It is also not because holidays have been getting cheaper, as that has not happened.
Sadly the reason behind the trends, shown in the third and final graph below, is that fewer and fewer families now think of having a holiday at all. They have become used to not having one. When asked if they would like a holiday they reply ‘no’. Perhaps is better not to keep on wishing for what you cannot have? I am very grateful to Matt Barnes of City University for supplying the graph below.
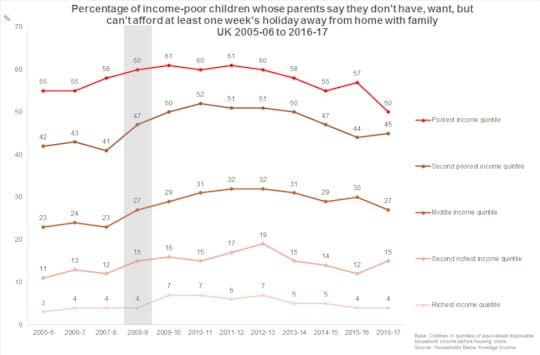
Proportion of children whose families say they want, but cannot afford, a week’s holiday a year, 2005-2017.
August 6, 2018
The long hot summer before the war – peak inequality
The last time inequality peaked in the UK was around 1913/1914. It appears to be peaking again this summer. The European Banking Authority announced in spring that the incomes of the highest paid financiers in the UK had recently fallen by about 10% in one year.
Earlier the High Pay Commission had announced the average renumeration of Chief Executive Officers to be falling across the UK.
Housing prices in London had begun to fall as early as August 2016.
All this and much more was a prelude to the possibility of UK income inequality finally reaching its second peak in just over a century.
In this talk, given at the wilderness festival, the way down form the peak of inequality is discussed, alongside just how strange it is to live in this place at the time of peak of inequality.
Danny Dorling spekaing with Leo Hollis (of Verso) a Book Tent Talk at the Wilderness Festival, Oxfordshire, 10am Sunday August 5th 2018 in Cornbury, Oxfordshire.

The Book Tent – Wilderness Festival August 2018
July 31, 2018
The health crisis 2010 to 2018: acclimatisation to a disaster
In the eight years since the May 2010 general election, the health of people living in the United Kingdom has faltered.
At first the only evidence came from surveys in which people started to say in greater numbers that their health was getting worse.

Trends in UK self-reported health
Then they started dying a little earlier than before, and then a lot earlier. By early 2018 we were seeing slowdowns in health improvements not experienced since at least the 1890s.
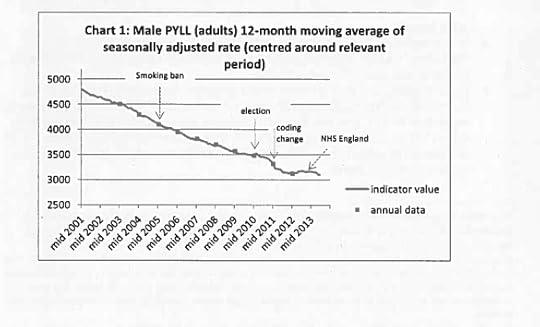
Quality and Clinical Risk Committee Paper – NHS England – October 2014
In some areas of the country life expectancy began to fall. It then fell for all the poorest of infants born in the country:
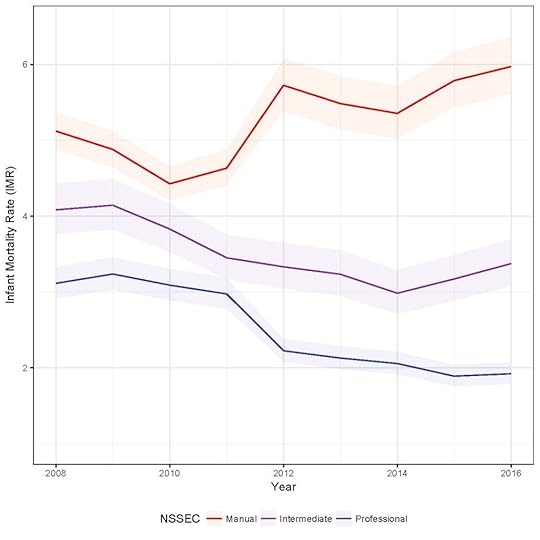
Infant mortality rate (95% confidence interval) by socio-economic classification 2008-2016. Link here:
However, whenever any suggestion was made that central government austerity and health policies might had an adverse impact on the health of the nations of the UK, these suggestions were always (and without exception) dismissed out-of-hand by the department of health media representatives as being preposterous.
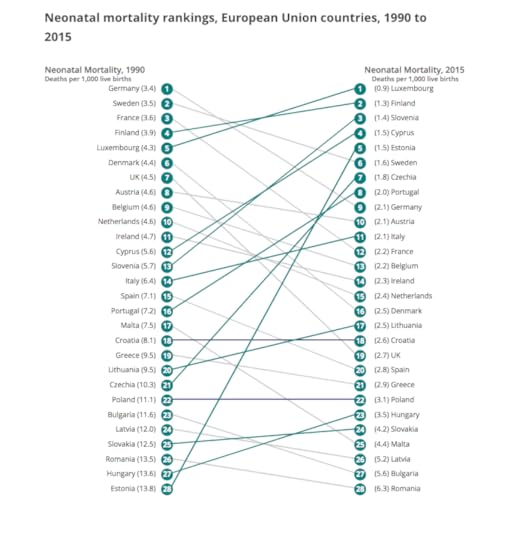
Neonatal mortality rankings, European Union countries, 1990 to 2015
In this talk the story is told, some of the evidence presented and the question raised as to who in government did not know. Who might have known and did not care. And who knew, cared, but thought all this was a price worth paying for what they really wanted to happen to health and other public services. To privatise a service first you have to run it down.
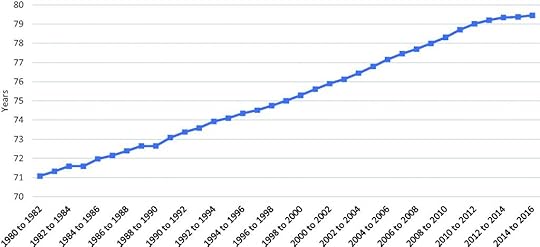
Figure 1. Trends in life expectancy at birth, England and Wales, 1980–present (Source: Office for National Statistics).
From a talk given by Danny Dorling on July 30th 2018 at the Launch of the Socialist Health Association Oxfordshire branch. Barton Community Centre, Oxford. The talk begins with a discussion of this news story:
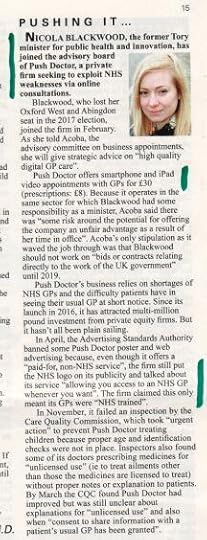
Details of Nicola Blackwood’s new role with private health care firm “Push Doctor”, Private Eye No. 1475, July 27 2018, p.15.
July 30, 2018
One Question: Do we need a universal basic income?
Yes we need a basic income. Yes we will get one. But we in the UK will very probably have to wait until other European countries have had one for some time. The UK in 2018 is the European country with the widest economic inequalities and in many ways is the least progressive large country in Europe.
One manifestation of this is scepticism over whether a basic income could work, be possible, or is even desirable. Unlike other countries in Europe, outside of Scotland where there is some enthusiasm, in the UK we are not even experimenting with different models of a basic income in different towns and cities to see what might work best when it comes to its introduction. Instead arguments are raised against basic income on principal in a similar way to how universal health care is derided as socialist health care in the United States, the country with the worst health record of the entire affluent world.
A basic income is needed for freedom. It is the only way in which people can be given a genuine choice over whether to undertake paid work or not. Where people have more choice over whether to work and what they do, the quality of their work is far higher. We need a basic income if we are to get good jobs. We also need it so that some can choose to live a very low consumption lifestyle. A basic income is what it says – basic.
Consumption by the affluent also reduces in those places and times where basic incomes are introduced. There is a three hundred year history of basic income that we can learn from, and many studies, of which the best in my view was written by Philippe van Parijs and Yannick Vanderborght and published in 2017.
A basic income is not, by its very definition, enough for people with special needs to live on. It is not enough if you are in a wheelchair or have a large number of children and no work. But it is not beyond the wit of imaginative people to realise that a basic income needs to be augmented for a few with greater needs. Like universal child benefit, or a minimum basic income for pensioners, no one would claim that all children or all pensioners could survive on those minima. A basic income is also not an alternative for basic universal services. We need both.
Basic income will likely come late to the UK. When you are old and dying the person turning you over in bed and inserting the catheter in your body may well be doing that because they have to. Not because they want to. In a country with basic income it would be because they wanted to. You will be able to tell the difference. Basic income sets us all free.
Further Reading:
The other contributions to this blog post which can be read here.
And, Three hundred years of arguments for a basic income
Review of ‘Basic Income: A Radical Proposal for a Free Society and a Sane Economy, by Philippe van Parijs and Yannick Vanderborght’
Reviewed by Danny Dorling, on March 16th 2017 can be read here.
PDF of blog post

A society of low inequality – drawn by Ella Furness
July 28, 2018
After the Fall
Almost six weeks after the inquiry was announced no deadline has been set for Public Health England’s inquiry report into mortality rate rises across all of England.
Lawrence Paulson mentions a recent study in the journal BMJ Open which estimates that because past improvements have stalled, by 2020 there will be an additional 152,000 deaths in the UK (LRB Letters, 19 July 2018). On 18 June the Office for National Statistics reported a further annual 5 per cent absolute rise in mortality across England. This was after they had taken into account the effects of ageing, and is in addition to the estimated 152,000.
Most of these deaths occurred before the weather turned very cold in February and, as the ONS reported, ‘influenza activity remained at medium levels throughout the whole of January and February 2018.’ On 20 March Jeremy Hunt [who was then Secretary of State for Health] had incorrectly stated in the House of Commons that mortality rates had ‘remained broadly stable over recent years’. When his error became apparent, Hunt sanctioned an inquiry by Public Health England into the rise in mortality rates. No deadline has been set for the inquiry’s report.
As Zosia Kmietowicz reported on June 26th in The British Medical Journal:
“The government is commissioning a review of the spike in deaths seen in England and Wales this year, after the issue was raised in the BMJ. … In response the Department of Health and Social Care said that it was asking Public Health England (PHE) to conduct a review into deaths and would announce a publication date in due course.”
That was well over a month ago. When will they announce a publication date for the review into the rise in deaths across England? Upon becoming the new Secretary of State for Health and Social Care Matt Hancock made no mention of the inquiry in the first (very) long speech he gave on 20th July 2018 on his priorities as Secretary of State.
Link to PDF and the London Review of Books issue where this letter was originally printed in the August 2nd volume.
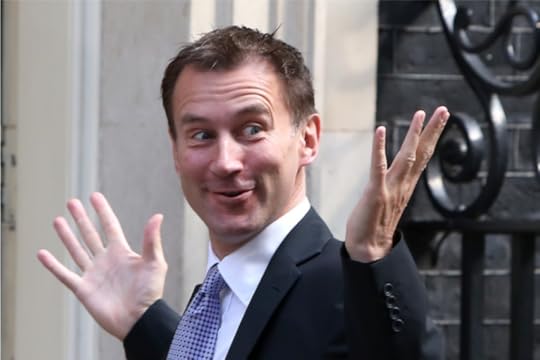
Jeremy Hunt
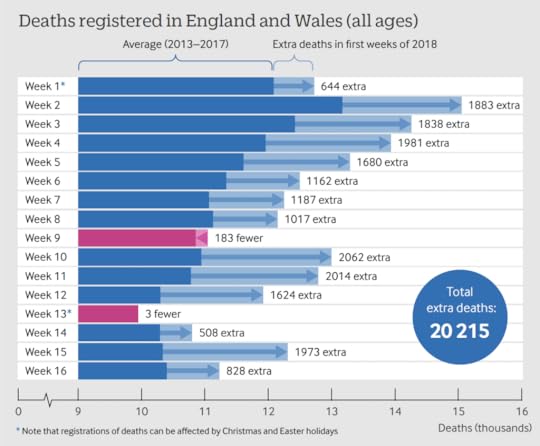
Excess Mortality in the first 16 weeks of 2018, England and Wales
July 20, 2018
Has the UK reached Peak Inequality?
Video and slides of Danny Dorling speaking at the Royal Society for Arts, London, July 19th 2018.
At first it will not be easy to ensure that 2018 is the peak of income inequality. The rich, like viruses, have developed resistance to redistributive taxes. They have used their wealth and power to lower tax rates and change the law. Partly to protect their offshore tax havens they funded the vote for Britain to leave the European Union. But they also sowed the seeds of rebellion through their greed and their success. In ‘Peak Inequality’ Danny Dorling makes the case that the time bomb is ticking and the end is in sight. Having ensured that the gaps between us grew so wide has had dire implications for our health, housing, education, demography, and politics. Today more than 99% are losing out. So how do we become more equal this time? Without a war.
Has the UK Reached Peak Inequality? from Danny Dorling
July 18, 2018
Peak Inequality – Britain’s Ticking Time Bomb
When we think of economic inequality we tend to think of a trend that is ever rising and destined to continue rising; that is far from inevitable. There are many statistics today that point at Britain being at a peak of inequality. However, having allowed the gaps between us to grow so wide has had dire implications for our health, housing, education, demography, politics and future. In this talk Danny Dorling highlights these and discusses what it will take to begin to descend from the peak of inequality.
Danny Dorling is a Professor of Human Geography at the University of Oxford. He has also worked in Sheffield, Newcastle, Bristol, Leeds and New Zealand, went to university in Newcastle upon Tyne, and grew up in Oxford. He has published over forty books including many atlases and All That is Solid in 2014; Injustice: Why social inequalities still persist in 2015; A Better Politics: How government can make us happier in 2016; The Equality Effect in 2017; and Do We Need Economic Inequality? – in 2018. His latest book is Peak Inequality – Britain’s Ticking Time Bomb.
The talk is introduced by Jonathan Hopkin, Associate Professor of Comparative Politics, Department of Government, LSE.
July 12, 2018
Peak Inequality – a discussion
In Peak Inequality: Britain’s Ticking Time Bomb, Danny Dorling presents the evidence that in 2018 the growth in UK income inequality may have finally peaked. Inequality began growing in the 1970s and the damaging repercussions may continue long after the peak is passed. In this discussion, recorded on July 11th 2018, there is also some speculation and a little futurology. Danny is in conversation with Faiza Shaheen, director of the think tank CLASS and former head Head of Inequality and Sustainable Development at Save the Children UK. Faiza recently explained that the rich, like viruses, also develop resistance, in their case to redistributive taxes. They use their wealth and power to carve out tax loopholes and lower tax rates. Their fortunes ballon. Inequality grows. In which case you might ask – why should inequality peak now Click play below to listen:
Danny Dorling's Blog

- Danny Dorling's profile
- 96 followers

