
Danny Dorling's Blog, page 28
June 11, 2018
Housing in Oxfordshire: where to build and who should profit?
A talk arranged by the Northern Villages Branch of Henley Constituency Labour Party, Wheatley, Oxfordshire, June 11 2018.
Danny Dorling is the author of many academic and popular works including All that is Solid: How the Great Housing Disaster Defines Our Times, and What We Can Do About It (Penguin 2015). In this book he argues that housing is the defining issue of our times and that the solution to our problems – rising homelessness, a generation priced out of home ownership – is not always, as is widely assumed, building more homes. Inequality, he argues, is what we really need to overcome. In this talk he gives his take on the housing situation in Oxford(shire) where affordability, homelessness and house building driven by economic growth are all pressing issues.
The talk begins with a discussion about the current plans for a new road expressway to be built from Oxford to Cambridge and the various options presented in June 2018 to the people of Oxfordshire over which of the fields of wheat should be built over first.


June 10, 2018
The cuts and poor health: when and how can we say that one thing causes another?
Life expectancy in England and Wales has stalled. At some older ages, it is declining.
The cuts and poor health:
when and how can we say that one thing causes another?
Lucinda Hiam, Danny Dorling, Martin McKee
First Published June 7, 2018 Article Commentary in the Journal of the Royal Society of Medicine, vol. 11, issue 6, pages 199-202, https://doi.org/10.1177/0141076818779237
Life expectancy in England and Wales has stalled. At some older ages, it is declining. One of the most widely used measures of the health of the population, life expectancy is calculated from age-specific death rates. Life expectancy at birth in high-income countries has been improving steadily, albeit with some small fluctuations, for decades. If the data are accurate, in the absence of other causative factors – endemic disease, environmental event such as war or natural disaster, or mass migration – stagnation of life expectancy, or worse still, decline, suggests substantial societal problems. This possibility is not, however, supported by the Government, which rejects any suggestion that its policies, in particular austerity and its effects, might have played any causal role in the observed trends.
First, it is necessary to describe what has been happening. Data from the Office for National Statistics (Figure 1) show trends in life expectancy at birth from 1980 to 2016 in England and Wales. After 2010, there is a clear slowdown in the rate of improvement. As this has coincided with the imposition of austerity measures by the coalition government elected in that year, this has inevitably raised questions of whether there might be a causal link. In particular, while spending on health and social care continued to grow year-on-year, annual percentage increases were much less than before, especially affecting general practice, the main setting for care of most people with chronic diseases. It has experienced a declining share of the NHS budget, widespread closures of general practices, unfilled staff vacancies and growing problems of access.
Figure 1. Trends in life expectancy at birth, England and Wales, 1980–present (Source: Office for National Statistics).
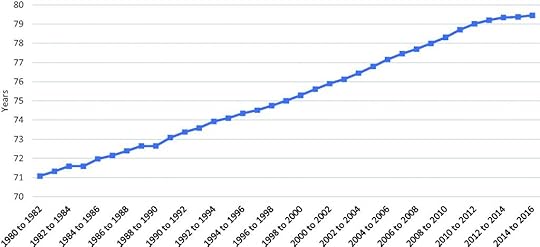
Figure 1. Trends in life expectancy at birth, England and Wales, 1980–present (Source: Office for National Statistics).
There is a growing literature suggesting a link between austerity and slowing of improvements in life expectancy at birth, and in some cases actual increases in death rates in older people. Some of these have invoked inadequate spending on health and social care. Yet, others reject this argument, citing alternative explanations such as unknown infectious agents, cold weather and influenza. Others have noted the challenges of interpreting short-term trends and urged caution in inferring causality from an observed association. In a recent debate on life expectancy and austerity that cited extensively our previous research, Conservative Members of Parliament focused on three main arguments. First, as Robert Court MP (Conservative, Witney) said in the debate, ‘life expectancy cannot be expected to increase forever’. Second, slowdowns in the rate of improvement have been seen in some other European countries. Third, the situation is complex and it is not possible to attribute any changes to a single cause. The first point is undoubtedly true but ignores how the United Kingdom has some way to go to reach the level seen in the best performing countries, such as Norway and Sweden, where life expectancy at birth is over a year longer. The second is also true, but other countries have also experienced reductions in social expenditure. Thus, according to OECD data, between 2010 and 2016 it fell, as a percentage of Gross Domestic Product in the United Kingdom from 22.8% to 21.5% and in Germany from 25.9% to 25.3%. In contrast, it increased from 26.3% to 27.1% in Sweden. The third point was that the situation is complex and it is difficult to ascertain causality, which we explore here. As Mr Court also said,
‘It is simplistic to look at a straightforward line between necessary control of public spending and an impact on life expectancy. As we have heard, a whole range of factors affect life expectancy and mortality—quality of life, mental health, obesity, housing, air quality—and simply to draw that straightforward causation line is to make things far too simple.’
Jackie Doyle-Price, Under-Secretary of State for Health, argued that ‘We need to be circumspect about drawing too much by way of conclusion’.
It is obvious that the situation is complex and multiple factors are bound to play a role, including both cohort and period effects, some of which have been explored in our previous research in which we examined trends in deaths at different ages and from different causes. Complexity does not prevent factors that have contributed to what is observed being elucidated. It is, however, the issue of causality that we now examine. Correlation does not always imply causation: an association between two events does not mean that one causes the other. So, when and how might we be able to say that one thing causes another? Without a randomised controlled trial, the ‘gold standard’ method in medicine for establishing causality, how can we refute or confirm the association?
Clearly, a randomised controlled trial is not possible. It would require two groups of people, equal in all other ways except that one would be assigned, at random, to living through austerity measures. The closest natural experiment involves comparison with other countries in Europe that have made different policy choices. Thus, as noted above, in the Nordic countries, life expectancy continues to rise at a steady rate. However, there are too many differences between these countries and England and Wales to make a fair comparison.
In 1965, Sir Austin Bradford Hill proposed nine ‘viewpoints’ to be considered before invoking causality. Drawing on both empirical and rational traditions, the Bradford Hill criteria are: strength of association, consistency, specificity, temporality, biological gradient, plausibility, coherence, experiment and analogy. Here, we apply these in turn to what is known about the recent changes in life expectancy.
Some are easily met. Coherence (‘… interpretation should not seriously conflict with generally known facts of the natural history and biology of the disease’), plausibility (is there a plausible mechanism between cause and effect?) and consistency (‘has it been repeatedly observed by different persons, in different places, circumstances and times?’) can be demonstrated by reference to a now extensive body of research on the impact of financial crises on health, albeit recognising that these associations are complex, including some causes of death (traffic injuries) that do fall. The consequences of weakened health systems were apparent in an admittedly extreme example, the collapse of the Soviet Union, although the adverse effects of economic hardship can also be seen today in the USA and in Greece, which has experienced a marked slowing in the rate of decline from some causes of death and an actual increase in others, such as those amenable to healthcare. The converse is seen, with evidence that well-functioning health systems are associated with declining mortality. Temporality, another of Bradford Hill’s criteria, is also clear: the imposition of cuts precedes the decline and stalling in life expectancy. The others are less straightforward.
Biological gradient refers to a situation whereby increasing exposure (cuts) leads to worse outcomes (death). This is more difficult to assess, although the scale of pension cuts at the level of local authorities has been linked to differences in early mortality. However, other research has found increases in elderly mortality in all areas – poor and affluent. This does not exclude the link, but neither does it establish it. Specificity of effect is difficult to establish, but the older population are more dependent on a well-functioning health and social care system, and are the group that have seen the increases in deaths, with corresponding declines in life expectancy at older ages. Assessing the strength of the association is more difficult when there is no obvious alternative exposure with which to compare austerity, a problem that is well recognised in the epidemiological literature.
Concluding his nine viewpoints, Bradford Hill highlights that none of them provide ‘indisputable evidence’, but they help answer the fundamental question: ‘is there any other way of explaining the set of facts before us, is there any other answer equally, or more, likely than cause and effect?’ To date, no alternative to austerity has been established as the reason for the stalling life expectancy.
Unlike in the physical sciences, establishing causality in epidemiology is complex. Newton’s insights to generate the laws of motion were brilliant, but technically easy to demonstrate. With complex human systems, such as populations, one needs to exclude chance, bias in all its forms and confounding. Thus, few conclusions can ever be definitive. However, as data from across Europe for the year 2016 are released soon, and then for 2017 (12 months after that), it will become increasingly clear whether the UK and other countries that have chosen extreme austerity have become significant outliers – or not.
Health is determined by far more than healthcare. The social determinants of health – the conditions in which we are born, live, work, grown and play – all impact the health of the population, and, in turn, are all impacted on by austerity. Yet, each time it has been raised, the Department for Health and Social Care has been dismissive at best. Carrying on as normal without understanding what has caused this decline prevents any measures being taken to halt it. As the evidence builds to suggest a link between cuts and stalling life expectancy, and lacking evidence of an alternative cause, it must be taken seriously and investigated thoroughly.
June 9, 2018
The public health record of the 2010-2018 UK Government
In the eight years since the May 2010 general election, the health of people living in the United Kingdom has faltered. At first the only evidence came from surveys in which people started to say in greater numbers that their health was getting worse. Then they started dying a little earlier than before, and then a lot earlier. By early 2018 we were seeing slowdowns in health improvements not experienced since at least the 1890s.
In some areas of the country life expectancy began to fall. It then fell for all the poorest of infants born in the country.
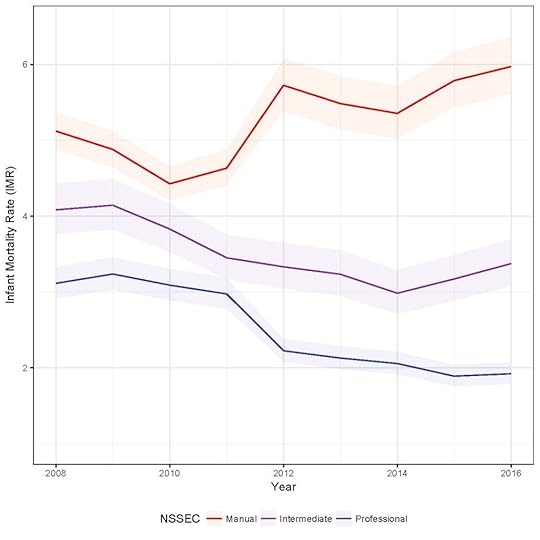
Infant mortality rate (95% confidence interval) by socio-economic classification 2008-2016.
However, whenever any suggestion was made that central government austerity and health policies might had an adverse impact on the health of the nations of the UK, these suggestions were always (and without exception) dismissed out-of-hand by the department of health media representatives as being preposterous suggestions.
In this talk the story is told, some of the evidence presented and the question raised as to who in government did not know. Who might have known and did not care. And who knew, cared, but thought all this was a price worth paying for what they really wanted to happen to health and other public services. To privatise a service first you have to run it down.
Danny Dorling speaking on the public health record of the 2010-2018 UK Government, Bristol Population Health Science Institute Annual Stephen Frankel Lecture, University of Bristol, June 7th 2018.
June 5, 2018
Peak Inequality: Danny Dorling and Faiza Shaheen
In Peak Inequality: Britain’s Ticking Time Bomb Danny Dorling presents the evidence that in 2018 the growth in UK income inequality may have finally peaked. Inequality began growing in the 1970s and the damaging repercussions may continue long after the peak is passed. There will be speculation and a little futurology.
Danny will be in conversation with Faiza Shaheen, director of the think tank CLASS and former Head of Inequality and Sustainable Development at Save the Children UK. Faiza recently explained that the rich, like viruses, also develop resistance, in their case to redistributive taxes. They use their wealth and power to carve out tax loopholes and lower tax rates. Their fortunes ballon. Inequality grows. In which case why should inequality peak now?
London Review Bookshop – Tickets available here: for 7pm Wednesday July 11th 2018

Peak Inequality: Britain’s Ticking Time Bomb
June 4, 2018
Is our NHS fit for purpose?
This summer is the 70th anniversary of the founding of the National Health Service. On June 30th a demonstration will be held in London in defence of the NHS.
Prior to the national demonstration many debates are being held. One was recently introduced by Amelia Womack, Deputy Leader of the Green Party. A recording of it is below. This recording is of a discussion and debate between Louise Irvine (a GP and Health Campaigner), Danny Dorling (an Academic and Writer) and Jonathan Ashworth (current Shadow Secretary of State for Health). In the discussion they cover many of the threats to the NHS. They were talking at the Peoples’ Assembly meeting in London, held on June 2nd 2018 at St Pancras New Church.
June 3, 2018
Mental distress has external causes
To better tackle mental illness, look to the societies in which it occurs.
The enjoyment of the highest attainable standard of physical and mental health is a human right. That’s according to the Office of the United Nations High Commissioner.
Few Prospect readers would argue against human rights. But we usually view health, particularly mental health, as an individual affair, seeing it only as an internal state. In truth we are all greatly influenced by wider society.
When large numbers of people become unwell, we need to look beyond biology and consider what is happening at the societal level.
In their new book The Inner Level, Richard Wilkinson and Kate Pickett reflect on the social factors influencing mental health. They reveal that the incidence of mental illness in the UK is twice that in Germany. Americans are three times more likely than the Dutch to develop gambling problems. The mental health of children is worse in New Zealand than it is in Japan.
Wilkinson and Pickett examine the effects of living in such different societies. And this new understanding of powerful societal influences chimes with much other recent work.
People working in separate disciplines are coming to the same conclusion: that our social worlds impact on us, they can give us health or cause us harm. As the UN puts it, “mental health policies and services are in crisis—not a crisis of chemical imbalances, but of power imbalances. We need bold political commitments, urgent policy responses and immediate remedial action.” This recent report calls for a shift from biomedical models of mental distress to a more radical, human rights-based approach, acknowledging the impacts of social inequality.
Another recent report published by the British Psychological Society, “The Power Threat Meaning Framework,” looks at the contextual factors which may make us sick. PTM acknowledges power inequalities and the impact of oppression. Being on the wrong side of power can lead to feelings of entrapment, shame and humiliation, as well as a sense of lacking control.
The framework highlights links between “poverty, discrimination and inequality, along with traumas such as abuse and violence, and the resulting emotional distress or troubled behaviour.” Adverse childhood experiences have a negative impact on health and wellbeing, for example.
Both The Inner Level and PTM reframe the narrative around why people get sick—refocusing the question from “What’s wrong with this individual?” to “What’s going wrong in this society?”
Whilst these new ways of thinking are works in progress, they open up new vistas. There is a renewed possibility of collaboration between geographers, sociologists, psychologists, public health and local communities to really understand the pathways from oppressive inequality to ill health.
But as Wilkinson and Pickett say, “Change on the scale needed… can only be achieved if large numbers of people commit themselves to achieving it.” And as they conclude in a recent newspaper interview: “It is clear that differences in cognitive development and intelligence are the consequence of inequality rather than its cause.”
That is a call to action, and we need to rise to the challenge for the sake of a healthy and sustainable future.
The original article by Danny Dorling and Khadija Rouf that this post is based on was published in Prospect Magazine on June 1st and is available here. The Book, ‘The Inner Level’, is available here
The Inner Level: How More Equal Societies Reduce Stress, Restore Sanity and Improve Everyone’s Wellbeing by Richard Wilkinson and Kate Pickett (2018)
June 2, 2018
Paul Scarrott speaking at the Anti-Racism Summit, Sheffield, 2 June 2018
We have to stand up to these things because otherwise we are faced with a very simple situation. Today’s unacceptable becomes tomorrow’s norm.“There is no end to it. But we do know there is an end to it, it ends in people dying; either in their dozens, their hundreds, their tens of thousands, or their millions. And that’s why we have a duty and a responsibility to not allow today’s unacceptable to become tomorrow’s norm. That is not going to happen.”
Paul Scarrott speaking at the Anti-Racism Summit, Sheffield, 2 June 2018
May 27, 2018
Can the UK afford to leave the EU?
The UK voted to leave at the peak of its economic inequality. In hindsight this appears to have influenced the decision. Many British citizens are likely to be impoverished as a result. Those without citizenship already live in great fear. So, can we actually afford to walk out on this relationship?
Danny Dorling’s annual lecture on Brexit given at the Hay Festival on May 25th 2018, speaking with Tom Clark of Prospect Magazine:
On Brexit, the UK will almost certainly leave, but mainly in name only, and mainly because its politicians simply can’t afford to do much other than that – its all a bit humiliating.
But perhaps we’ll learn a lot about ourselves in the process and grow up a bit as a set of nations? At the very least we will all be learning some basic geography such as that Britain is not a country, and that the Irish border matters – really matters – much more than many in England ever realised it did.
The new book referred to in the talk, the one on ‘Peak Inequality‘, is published on July 17th 2018:
Peak Inequality: Britain’s Ticking Time Bomb
May 24, 2018
Inequality the Big Picture
The first of three Free Summer Lectures on Inequality. Given by Danny Dorling in London on Tuesday May 22nd 2018 at 6:30pm in Bethnal Green. A video of the recording of the lecture, with slides embedded, can be played below.
The second free lecture will be given by Sadiah Qureshi on June 21st 2018 entitled: ‘There is Black in the Union Jack’: Britain’s forgotten history, tickets available here.
The third free lecture will be given by Rosemary Ashton on July 19th 2018: on: ‘Affordable Education for All: The Pioneering Contribution of Victorian Bloomsbury’, tickets to be found here.
‘Inequality the big picture’ was based on the forthcoming book ‘Peak Inequality: Britain’s Ticking Time Bomb” – to be published on July 17th 2018.

Peak Inequality: Britain’s Ticking Time Bomb
“Inequality – the big picture”, Danny Dorling kicking off the summer lectures at the IF Project (a free university), St Margaret’s House, Bethnal Green, London, May 22nd 2018
Thanks are due to Drew McFadyen for recording the lecture, and Jonny Mundey, Barbara Gunnell and Peter Wilby for arranging it.
As the video above conclude, it is always worth remembering that:
When change truly happens it at first strikes seasoned commentators as frankly impossible – a pipe-dream; then undesirable and full of negative consequences; then ‘just about possible’ once the clamour for change becomes overwhelming.
Finally change happens and their memories change with it. They will say that they believed in the change as desirable all along; they somehow saw it coming and so, too, were on the right side of history.
Then we can all forget that just a few years ago they had so vehemently opposed the change, had justified the status quo, were so very scornful, and ultimately wrong.
That matters little.
It is just history.
What matters is ensuring that we are now at the peak and starting on our way down.
…
It’s a long way down.
May 21, 2018
What might a progressive economy look like?
A progressive economy might seem like a pipe dream, but is it achievable?
The future is another place a long way away. Look forward one hundred years; what do you see? We will hopefully be better housed, schooled, and employed, but how?
How might we control the rich, live better alongside each other in Europe, elect our politicians, police ourselves, deal with terrorists, with unemployment, and with our current obsession with the market?
Look back a century and you see the year of the worst flu pandemic the world has ever known, back to a world at war. Now imagine looking forward from then to the present day, to 2018. In the turmoil of 1918, it would have been hard to envisage the magnitude of the social progress that would manifest over the coming hundred years.
In a similar way, our current levels of inequality actually harm the imagination. Otherwise we, in Britain, would more easily see what we need to do. We are currently the most economically unequal country in Europe. That will very likely end soon.
Once we imagine what could be, then it becomes easier to know what we should be dreaming of and aspiring to. The future will be very different, even though we find it far easier to keep on imagining more of the same.
In a progressive economy, house prices would reflect how much it costs to build a home, including the costs of the material that each home is built from, but not the hyper-inflated land value. The costs of renting will relate to the cost to the landlord of maintaining the fabric of a home and the landlord’s actual time and effort, and not to the power imbalance that comes with sharp inequalities of wealth. Rents would be regulated, hidden charges banned.
In a progressive economy, school funding would be at least raised to normal Western European levels, and state schools would not be privatized (‘academized’) and turned into businesses with scant oversight of their financial behaviour.
If you think none of this is possible please remember that the beating of children was only outlawed in UK state schools after someone like me left school, in 1986, and in private schools only a dozen or so years later! Teachers used to beat children!
So, given all that, we should be asking ourselves the following question: what is happening now that we might regard as abhorrent in future? This constant asking, demanding and then winning, is what it means to be progressive.
A progressive economic outlook alters how we view key issues such as immigration and ageing. Our current obsession with immigration is partly driven by a fear that there is not enough work to go around. However, work in the near future will be very different. Our obsession with ageing is due to a fear that the old will be a burden on the young; but our economy in the future will be so very different to today. The majority of the largest firms in the UK in 1918 were no longer in existence by 2018, and the few that did survive were no longer at all large.
Today the largest UK firms are involved in oil, banking, supermarkets, mobile phones, chemicals, pharmaceuticals and making weapons Almost all of these did not exist a hundred years earlier (or were tiny then), and many will be much diminished in size in much less than a hundred years’ time. Not only will work change, but what work needs to be done will fundamentally alter, as it has been doing for some time.
With respect to health, our current health crises are temporary aberrations. Across Europe there is a continuum from Finland and Norway, where life expectancy continues to increase at a rate of one additional year in every three or four, down to countries like the UK, where improvements in life expectancy have now stalled, largely thanks to inadequate public spending on vital care and other cuts – such that austerity has been linked to 120,000 excess deaths. In a progressive economy, we will shudder when we remember what we accepted today.
The extreme inequality, the continuous crisis, and the awful austerity that we experience today will soon be history.
When change truly happens it at first strikes seasoned commentators as frankly impossible – a pipe-dream; then undesirable and full of negative consequences; then ‘just about possible’ once the clamour for change becomes overwhelming.
Finally change happens and the memories of the commentators change with it. They will say that they believed in the change as desirable all along; they somehow saw it coming and so, too, were on the right side of history.
Next, we all forget that just a few years ago they had so vehemently opposed the change, had justified the status quo, were so very scornful, and ultimately wrong. That matters little. It is just history.
What matters is ensuring that we are now at the peak and starting on our way down. It’s a long way down.
read more and PDF here
Or listen to three short talks given in London on the same day as the Progressive Economy Forum was launched:
Danny Dorling's Blog

- Danny Dorling's profile
- 96 followers

