
Danny Dorling's Blog, page 27
July 6, 2018
Peak Inequality
Is great change coming? 4 July 2018 – First published in the New Statesman, by Danny Dorling
Peak inequality
The gap between the very rich and the rest is wider in Britain than in any other large country in Europe, and society is the most unequal it has been since shortly after the First World War. But is great change coming?
There are many ways in which inequality can be felt and innumerable ways in which it can be measured. However, it is annual income that trumps all other measures, because it is income that gives us respect and the freedom to do everything from buying a bus ticket to securing a mortgage. We can only live how we live by dint of the income we receive.
Income inequality in the UK is higher than in any other European country, except occasionally one of the Baltic states (during a bad year for them). All other European Union countries enjoy greater income equality. Because of this their citizens are freer to live where they wish, to mix equally, to go to school with each other rather than segregate their children, as the majority of parents in the top 10 per cent of income distribution in Britain feel compelled to do.
Peak inequality is when the town you live in is so segregated that the school-aged children do not mix – not between schools, not socially, not at all. Peak inequality is where the best-off people in your workplace demand “housing allowances” because they could not possibly live near those who clean their workplace, or those who ensure the photocopier works, or who keep the computer servers working night and day.
We live in times of peak inequality. It pervades almost every aspect of our lives in Britain in ways that we now accept as normal. Like goldfish in a bowl of dirty water we have adapted to think that our tank is normal. But it isn’t.

Taken by Kristian Buss
on 14 November 2011 in London. The photo shows partygoers from
the fictional Swillindon club, who tried and failed to gain entry
to the Lord Mayor’s Banquet that evening
Among all European nations we have become the most inequitably rewarded – we are swimming in the dirtiest of fish tanks. The transition to this state of affairs came slowly. In the 1970s we were living in the second-cleanest large tank of all in Europe; only Sweden’s was cleaner. I say “clean” because as yet there is no evidence of any harm coming from high levels of equality – once a basic level of affluent subsistence has been achieved, there is no downside to being more economically equal.
Nowhere are the repercussions of living with gross inequality more evident than in health. The physical health inequalities that come with tolerating the highest income inequalities in Europe are not as extreme as the damage to our mental health (as documented in Richard Wilkinson and Kate Pickett’s new book The Inner Level), but they are still shocking. For instance, a child born in Sweden is half as likely to die in childhood as a child born today in the UK. There are no causes of death among children that are significantly more frequent in Sweden than in the UK. By 2015 the UK ranked 19th out of 28 in the European league table of neonatal mortality: deaths within the first 28 days of life. In 1990 we had ranked seventh. Bulgaria ranks 27th and Romania 28th, but infant mortality in both is falling. Since 2015 we have seen a statistically significant rise in infant mortality across Britain: no other state in Europe has experienced that. And this is despite, not because of immigration.
Immigrants, who are on average younger and healthier, are essential for the running of our health services. Their presence has prevented overall life expectancy from falling across the UK – though it is already now falling for many groups in many parts of the country. In everywhere else in Europe life expectancy is rising faster than in the UK (it is rising fastest in Norway and Finland). Until 2015 the UK had not experienced growth in numbers of grieving parents since during the Second World War – when infant mortality last rose for two years in a row.
After a time the statistics begin to turn you numb. You become used to bad news. Year after year the number of children waking up in shabby temporary accommodation rises. It now does so with each passing Christmas Day. A record 130,000 children were living in bed and breakfasts over Christmas 2017.
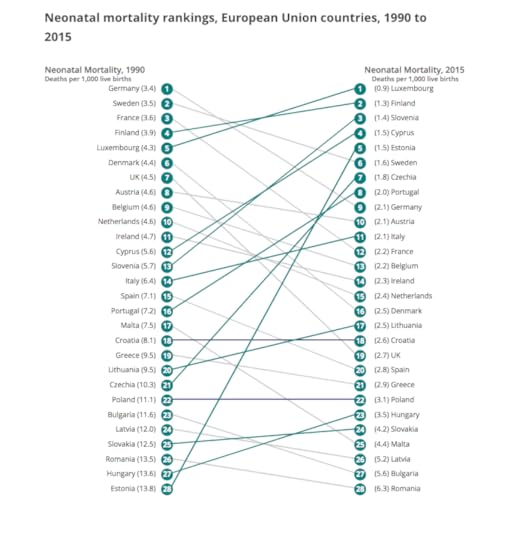
Neonatal mortality rankings, European Union countries, 1990 to 2015
You become used to hearing that ever greater numbers have recourse to food banks (1.3 million parcels were given out in the year to April 2018), to such an extent that you almost forget that as recently as the 1990s there were no food banks in Britain. There was no need for them, before inequality reached its new peak – just as there was a time when the soup kitchens of the 1930s all disappeared once equality rose high enough. When the income share of the bottom 90 per cent is used as the comparator, today our levels of inequality are the same as in 1930. That is why the soup kitchens and feelings of hopelessness have returned.
****
How did we get here? What went wrong? Equality for the bottom 90 per cent peaked in 1978 when they took home 72.2 per cent of all the income there was to take that year. This high point had followed us reaching a slightly smaller (and almost always ignored) peak of 71.5 per cent in 1968. Between those two dates we stumbled along a ridge of high equality and we could have chosen to go even higher. In hindsight, it is far easier to see. At the time, no one in Britain had a clear idea of just what a momentous period the late 1960s and early 1970s were.
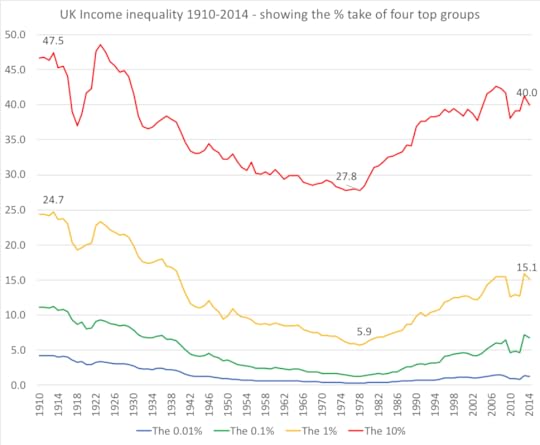
UK INCOME INEQUALITY 1910-2014: % SHARE OF FOUR WEALTHIEST GROUPS
We could have followed the paths later taken by the Netherlands, or France, or Germany. In fact, we were so equal by the early 1970s that we were most similar, as a society, to Sweden – we could have been Scandinavian! We could have had a sovereign wealth fund – one based on oil, like Norway’s. We could have been leaders in technological and scientific innovation like Finland. We could have been as stylish as the Swedes and as laid-back but also as environmentally conscious as the Danes.
The equality of the early 1970s was held up by quicksand. It was not something that was being slowly built upon a strong foundation – of having all been poor before, and all now being in it together. Those who had been exceedingly rich in the past resented the equality that was coming. They resented the good-quality comprehensive schools that began emerging in that decade; the decent housing; the full employment that allowed people to tell their boss where to stick it; the growing lack of deference for the old rich, from the publication of books that a man would never wish his wife or his servants to read (Lady Chatterley’s Lover in 1960) through to “God save the Queen/ The fascist regime” (the Sex Pistols, 1977) – by which time it was too late. The political shift towards greater inequality had been made in 1974.
The swing of votes towards the Tories in the second general election of that year was abrupt: Harold Wilson’s Labour Party won but with an overall majority of only three seats. In 1975 the Conservative party itself took an abrupt jump to the right with the selection of Margaret Thatcher as its new leader. In 1976 Jim Callaghan gave a speech at Ruskin College, Oxford, that showed the tone within Labour was changing, too.
This did not happen because of the oil crisis, Nixon abandoning the Bretton Woods monetary system, or any other international event outside the UK’s control. It happened because of a very British problem. Britain differed fundamentally from other countries in Europe in the 1960s and 1970s because its wealth had been built on a huge empire. And now the loss of our empire meant we were forced to get used to having less.
In October 1974 the south of England effectively voted to abandon the north of England and the rest of the British Isles and to punish the miners who had been on strike. The southerners did not triumph until Thatcher’s election in 1979 – but they had begun their fight in the autumn of 1974.

The British establishment had almost no idea of how economically reliant it was on the empire. Almost all leading Conservatives, most Liberals and a significant section of the Labour Party had come to believe that running the empire was the white man’s burden, a great sacrifice – something they did at a loss even.
The pound had been falling in value against the dollar since at least around 1910. By the 1960s Conservative politicians blamed immigrants from the Caribbean, and then the trade unionists at home. They blamed the miners in the early 1970s and then the few socialists in government during that decade. Britain joined the European Economic Community in 1973 in search of a solution to its economic woes. At no point, ever, did the British contemplate how the centres of all former empires, from Ottoman to Hapsburg, from Rome to Lisbon, had suffered in the immediate aftermath of the loss of empire.
Soon the British became used to inequality rising with each year of Mrs Thatcher’s government, before stuttering during John Major’s rule (1992-1997) and rising sharply again under Tony Blair’s New Labour.
We reached an inequality high point in 2007 when the bottom 90 per cent only took home 57.4 per cent of all income, the least they had taken since, tellingly, 1929, the year of the Wall Street crash that began the Great Depression.
Tony Blair was the king of income inequality. No British prime minister since Stanley Baldwin had seen the bottom 90 per cent take so little as they did under New Labour. Under Gordon Brown the share of the bottom 90 per cent rose slightly but so did the share of the wealthiest 0.1 per cent. During David Cameron’s coalition government inequalities rose again, but not to the heights of the Blair era.
Peak Inequality: Britain’s Ticking Time Bomb
Today, with Theresa May in charge, the statistics are no longer released. Under the Conservatives’ austerity regime, HMRC has not received funding rises, despite the obvious benefits of better-regulated taxation in helping reduce the deficit. The Conservatives also appear to have instructed HMRC not to make the publication of income inequality statistics a priority. Resolution Foundation researchers have complained about the lack of good inequality data from HMRC. However, the fact that FTSE 100 chief executive pay has fallen recently suggests that we have reached peak inequality. History may never repeat, but inequalities always eventually hit a high and then fall.
The American geographer Waldo Tobler once told me that income inequality in the US was stacked like a pile of sand. We were near his home close to Santa Barbara, California, where the sand cliffs are cut steeply by the Pacific and where income inequalities hit their West Coast summit (beneath the Neverland Ranch). He explained that with a pile of sand there was an angle that could be maintained. Cut away sand from the bottom of the pile after that steep angle has been attained and soon the whole collapses.
The income distribution pile in Britain began to be cut away in the early 1990s under John Major. Back then a pseudo-equality began to rise. If you ignored the top 10 per cent, then within the bottom 90 per cent you could begin to see equalities increasing, even as the top 10 per cent took more and more. More money was trickling down from within the upper levels of the bottom 90 per cent. The top of the sand pile was still solid but slowly becoming undermined. The income share of the next 9 per cent above the bottom 90 per cent peaked in 1993, at 28 per cent of all income; by 2014, it had fallen below 25 per cent, according to the World Income Database. This is the latest figure we have.
Equalities are still rising within the bottom 90 per cent. Those in the top 10 per cent but not in the top 1 per cent – crucially, a group that traditionally votes Conservative – have been losing out relatively for 25 years to those both better off and worse off than them. This is the group that struggles to find money for private school fees, that uses private health care if it can and that takes out huge mortgages (because these people are not quite rich enough simply to buy property with cash). They (assuming a household with two adults and two children) have a post-tax total annual household income of £75,000 to £200,000 a year. This is the group that Thatcher looked after but that Tories have since taken for granted on the grounds that they had no one else to vote for if they wanted to protect their accrued wealth, primarily their house prices.
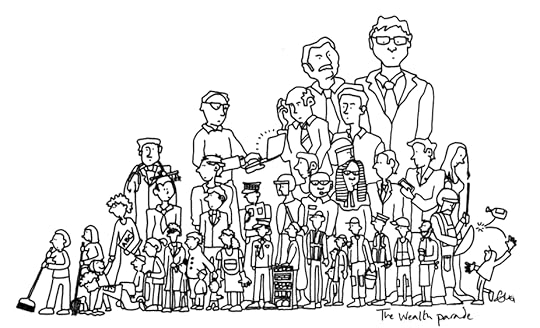
The wealth parade by Ella Furness
But then, following the financial crisis, even the majority of the top 1 per cent began to lose out. (These are households that earn about £200,000 to £400,000: they are very wealthy but not in the top 0.1 per cent.) The income share of this group peaked in 2008, at 9.6 per cent of all income; by 2014, it had fallen to 8.4 per cent, according to the World Income Database. We are now back to inequality levels for this group last reached immediately before the Second World War, just before the advent of the welfare state, after which their share of income continued to decline. The precedents are all stacking up for a period of great change.
There are certain changes that happen in all affluent states when inequality falls. If we have just passed the peak, we can expect to see the wealthy begin to have less and become less able to separate themselves from the majority of society. Fewer people have the income needed to pay for private school places for their children. State education becomes better funded as the will of the majority becomes more powerful when the majority are not so poorly off. Housing regulation increases and landlords are given less freedom in setting the rent and evicting tenants. Jobs become more secure through the introduction of better legislation. Taxation overall increases, but especially for the rich. Standards of living rise, especially for the poorest but also for the median household.
The wealthiest members of society discover that they have not greatly lost out. They still live at the “best” addresses, but more often in apartments created from the division of single grand houses (some of which had been subdivided during previous periods of greater equality). And the rich do not have to fear the poor so much. The wealthiest people in more equitable European countries – France and Germany and especially Scandinavia – live longer and happier lives than the best-off in Britain. The irony is that greater equality helps the rich as well as the rest.
The sand of Britain’s income distribution has kept on falling away from higher up the cliff, approaching the top. By 2013, the income of the top 0.1 per cent (excluding the top 0.01 per cent) had peaked at 5.8 per cent, or 58 times mean average incomes (and many multiples more of median income). The next year it was down to 5.5 per cent, a point last attained in 1927 (after which it fell almost every year for 50 years to reach 1 per cent in 1977 – or ten times mean average incomes). We do not yet have statistics from 2015 onwards. But based on the trend, we can speculate that income peaked for the top 0.01 per cent of highest earners in that year, for the top one in 100,000 in 2016, and the top one in one million in 2017. And then, in 2018, the income of the very highest-paid person of all in the UK fell when Martin Sorrell stepped down from WPP because of allegations of misconduct. In April 2018 we reached the first inequality peak since 1913. (Thankfully it was well below that previous peak – a high point only attained by owning the largest empire the world had known.)
Sorrell shows us what income inequality means and achieves. The advertising industry he worked in displays the economics of inequality at play: convincing those with less to buy more of what they did not need to enrich those already best off. Look at how badly he has taken his demotion, how determined he says he is to rise again, if you wish to see the energy of those widened inequalities laid bare. Sorrell is the poster boy for British inequality. He owns that brand.
****
So what’s next? There is no guarantee that this is the peak. What looks like a peak is often a false summit. But the signs are there in so many other indicators: health, housing, voting, education, Brexit. The signs are so strong that I am calling peak inequality this time. And I have never called it before.
Will we allow economic inequalities to climb yet higher again? Or will we vote for the alternative? For the first time in four decades in Britain we are being offered a viable mainstream European social democratic socialist alternative. The choice is no longer to be the most economically unequal country in Europe, with all that entails.
My grandad was born in 1916. Before he died in 2013, he told me of the remarkable changes he had lived through. He told me what he saw during the general strike of 1926, and of how everyone dressed the same in his village in the West Riding. He told me of the crash of 1929 and how the Americans sacked the men who counted unemployment and so never knew how high it had risen. He showed me his diary entry for the date that Hitler became chancellor: it was just another normal day in 1933, but economic inequalities were then reaching new heights in Germany (and Japan). He told me that his generation would never again trust those who had allowed two world wars to take place. He told me how, after 1945, he watched as decade after decade after decade almost everything got better, until at the end he would sit on a bench in early retirement and wonder at the variety of colour in the clothes that people walking past him now wore. And of how little most of them knew of suffering, or hunger, or unemployment, or fear over the doctor’s bill or the pit owner’s cruelty. And then he watched us throw it all away.
It is too late for me. But my children could see what he saw during his lifetime if we now ensure that the peak of inequality has been passed – and we start on the long road down.
Danny Dorling is Halford Mackinder professor of geography at the University of Oxford and author of “Peak Inequality: Britain’s Ticking Time Bomb”, which will be published by Policy Press on July 17. Special offer for New Statesman readers: Visit here and quote POPINS18 to pre-order Peak Inequality for £10 with free postage, valid until 31 July.
Click here for a PDF and link to the New Statesman


July 3, 2018
Social Inequality in the UK: challenges for policymakers
A talk given to the All-Party Parliamentary Group for Social Science and Policy, Attlee Suite, Portcullis House, July 3rd 2018.
Danny Dorling (with the occasional interjection from Peter Bottomley, the chair) speaking on the evidence that 2018 could be the year of peak injustice and social inequality, why inequality is so harmful to people in the UK today and how it can be reduced.
Click play on the Audio below to hear a 19 minute summary of Peak Inequality. And if you are bored with looking at this screen while you do that then play the visual interactive graphic of inequality at the same time as listening.
A further talk and discussion will be held on July 11th 2018 at the London Review of Books Bookshop at 7.00pm: tickets.
A public lecture will be given at the London School of Economics on July 17th at 6.30pm: details.
A lunchtime event will take at place at Royal Society of Arts and Commerce on July 19th at 1.00pm. Entry is free but places are limited: details.
Further talks in Edinburgh on August 22nd, Stoke on September 26th, Northampton on October 2nd, Hull on November 29th, and Weston Super Mare on December 5th. Details to be announced.
July 2, 2018
Britain is a Segregated Society – the isolation of the richest
Britain is a highly segregated society. It boasts the widest Gini coefficient of all the OECD countries in Europe when income inequality is considered.
It is home to the most socially segregated system of education in Europe. No other European country has such a high proportion of children being privately educated in a way in which the spending on their education is so much higher than that spent on the other 93% of children and all without palpable national benefit.
At the other end of life, in our old age, the UK boasts both some of the widest health inequalities in Europe and also some of the lowest expectations of length of life. We live in the most highly divided European society and this should be an issue of great concern, not least because it makes us more stupid and less healthy in aggregate. It also detrimentally affects even those at the very top.
Perhaps to help illustrate the detrimental effects of living with great segregation the Prime Minister, Theresa May, makes a series of simple geographical mistakes in her foreword to the Integrated Communities Strategy Green Paper – Building stronger, more united communities. In her first paragraph she refers to the four countries of the United Kingdom as one country – failing to acknowledge the devolved administrations and differing approaches of other people from other parts of the Kingdom.
Mortality rates in the London Borough of Kensington
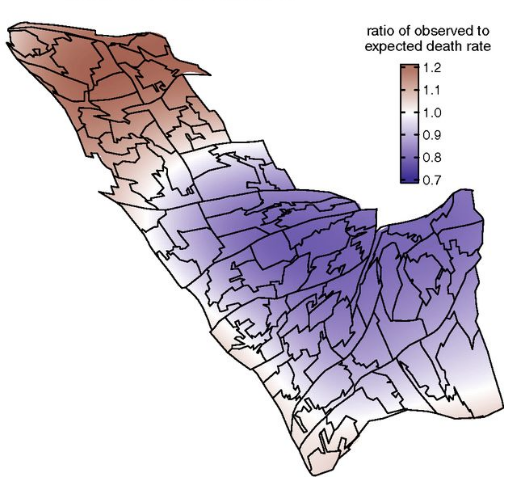
Mortality rates in the
London Borough of
Kensington (all deaths
2011-2014)
Public Library of Science, (all deaths 2011-2014)
Mrs May is part of a very small segment of society, especially isolated from others in British society, and her words reflect this. In the same short paragraph, she condescendingly, and with a flourish of megalomania, promises that she herself will ‘build a country that works for everyone … in which everyone, whatever their background, can go as far as their hard work will take them’
In future, phrases such as this will be looked back at as being very telling of her and her governments’ thinking and beliefs. She follows a politics that is itself a product of great social segregation. In the European Parliament the Conservatives were forced to align themselves with groups such as the Polish ‘Law and Justice’ party; because they had so little in common with other European Conservatives.
Contemporary British Conservative politicians often grow up on the fiction that when people ‘get ahead’ it is because their ‘hard work’ got them there.
But it is very difficult to learn to treat people well when you do not grow up with them. In 2013 even Nigel Farage criticised Theresa Mays ‘go home’ vans of operation ‘Vaken’. When, in her second paragraph, Theresa May suggested that ‘Britain is one of the world’s most successful multi-ethnic, multi-faith societies’, the actions of her own Home Office prove that not to have been the case.
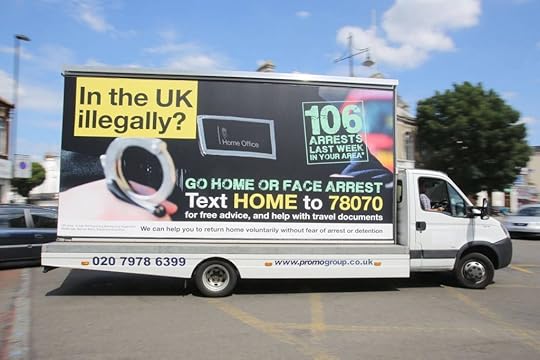
One of the vans deployed by the Home Office during operation Vaken in 2013
The legacy of Theresa May as Home secretary – operation Vaken
In her third paragraph (on page 7 of the Green Paper) the Prime Minster claimed that her government’s recent Race Disparity Audit had been ‘ground-breaking’. It was not. Geographers have explained that it ‘meant little’ because it showed so little understanding of geography. Mrs May said it would help address the inequalities that ‘prevent us from building a Britain where everyone has the chance to succeed.’ Note again, the implication being that individuals should be given ‘chances’. The language will be familiar to children who have read the ‘Hunger Games’ books, where all children are given ‘a chance’.
In her fourth paragraph of introduction the Prime Minister said that the reason to confront segregation is because it ‘undermines our unity as a nation’. She is obsessed with the idea of Britain as a nation, a single country, her country.
In her fifth paragraph the Prime Minster claimed that the green paper will ‘tackle the root causes of a lack of integration – including a lack of social mixing in some of our neighbourhoods and schools, unemployment and poor English language skills.’ These are part of the reason some people are less integrated into society than others, but not in the way Mrs May means. For instance, while she was growing up she did not go to the same type of school as most other children in Oxfordshire, and many (if not most) of the young adults she met at university went to segregated private schools.
It is not Mrs May’s fault that she does not understand Britain. She was almost certainly never been taught human geography well at her school or university and her advisors now are misinforming her still. She did not benefit from going to school where the most common language after English was Urdu. She did not go to a school with a wide cross section of society. She did not grow up in a diverse neighbourhood. She did not make friends later from a wide cross section. Why should we expect her to have integrated well?
However, even having benefitted from a more inclusive upbringing is no guarantee of better understanding. In his forward to the Green Paper the relevant Secretary of State, Mr Sajid Javid, reminisces over translating for his mother in the doctor’s surgery at the age of six. He talks of ‘shared rights, responsibilities and opportunities.’ But as Tony Blair before him also failed to understand, this phrase about ‘rights and responsibilities’ came from R. H. Tawney and originally meant so much more.
It was Tawney who best described the rights of the poor and the responsibilities of the rich. Tony Blair turned the phrase on its head. Mr Blair was also a product of private education. The Green Paper (page 64) proposes a new national survey to ascertain the extent to which people are aware of their ‘shared/common rights and responsibilities’. Perhaps the origins of the phrase needs to be better studied by those preparing this first. The entire ‘Measuring Success’ section of the green paper is risible.
The Green Paper (page 11) begins with an assertion that: ‘As of January 2017, 60% of minority ethnic pupils were in schools where minority ethnic pupils are in the majority.’ In other words, in diverse areas there are diverse schools. In great contrast, the proportion of the children of the richest 5% who are educated where children of the richest 5% are in a majority is, of course, far higher than 60%. And in contrast to mixing by ethnicity in schools, which is increasing over time, there is no evidence that the rich are mixing more.
We are a divided society because the wrong people are today in power; selfish, individualistic, nasty people from ‘the nasty party’ as Theresa May herself once called it. Until a government not sponsored by the rich and made up almost exclusively of the rich is in power we should not expect progress.
Note: This is an edited extract of: Dorling, D. (2018) Britain is a Segregated Society – the isolation of the richest from the rest, Chapter 7 in J. Holmwood, G. K. Bhambra and S. Scott (Eds) Integrated Communities, published May 1st, UK: Discover Society/Social Research Publications
The PDF of article and a link to the version printed in Public Sector Focus in May/June 2018 are here.
June 29, 2018
This is what peak inequality looks like
We can find it hard to believe that an era has come to an end, that a peak has been passed. But when, finally, such a change happens the memories of commentators change with it. They will say that they believed the change to be desirable all along, that they somehow saw it coming and so, too, were on the side of history. Then we can all forget that just a few years previously they had so vehemently opposed change, had justified the status quo, were so scornful of those who suggested change was possible and ultimately were so wrong.
[This is an edited extract from the book Peak Inequality which will be debated at 7pm on Wednesday July 11th 2018 at the London Review of Books bookshop, tickets here]
Britain has been governed by an unusually shambolic administration in recent years. Some thought of it as venal—motivated by “big money.” Others saw the Conservative administration as being self-interested, and uninterested in the plight of the majority of people, but interestingly even these politicians have recently had to move towards the left. Little of this was recognised early on by the news media, which initially proceeded in its usual deferential manner. However, the actions of the 2015 government also led to radical politics rising up again within the Labour movement. The democratic socialist Left within the Labour Party’s burgeoning membership won two leadership contests, then cut a Tory majority down to a minority government, and now that Labour Party looks set to have a good chance of winning power, possibly in coalition with the SNP. We are living in strange times; times which might well in future be understood and reinterpreted in the context of what becomes possible when a state approaches peak economic inequality.
In comparison with the recent past, the chance of Labour winning power is now so high that by January 2018 the Financial Times was advising its more affluent readers to think of unwinding all their secretive family trusts and other financial “structures”—the ones that they may have put in place to avoid paying taxes—before any new general election as “Labour has said it wants to see the public disclosure of trusts, which it describes as a key vehicle for tax avoidance and illicit financial flows.” That advice only makes sense if the Financial Times saw a Labour victory as plausible, and likely to be followed by very quick action by Labour politicians to identify tax avoidance.
It is far from fanciful to suggest that what brought all these events to such a crescendo was incredibly high and still rising income inequality. When income inequality is high, the richest try harder than ever to avoid paying taxes as they amass so much wealth that could be taxed. The repercussions of living with high inequality, the highest in Europe, are like living with a ticking time-bomb. When economic inequality is very high, so much then goes awry in education, housing, health and welfare, due to the efforts of those who think they benefit from such inequalities trying so hard to maintain them.
Extreme inequality is maintained by misleading the public. Initially voters were told that it was the fault of the 2005 Labour government, rather than the bankers, that there had to be cuts. Then benefit scroungers were blamed, then immigrants, then EU regulations holding back global free-trade and undermining the mystical power of sovereignty. These were lies that would fuel the Brexit vote. But still the inequality time-bomb is ticking. Brexit is partly an attempt by the very rich to keep the tax haven status of London and overseas territories unaffected by EU regulation.
If you want to know who is pulling the strings you follow the money. That money was used to feed the fear that globalisation was impoverishing people in the UK. That money was spent by the owners of tabloids telling readers that all would be well when the border was secured against immigrants. Simultaneously the rich would be free to squirrel their money away over that border with no future EU oversight.
It is geography that best reveals the effects of economic inequality. Geographical comparisons allow us to see how much better almost all the more equitable countries of Europe have been governed, with better outcomes. By contrast, in the United Kingdom and the United States, as inequality rises these societies begin to tear themselves apart. The rich spend more and more to try to live far away from the poor, while simultaneously making more and more people poorer. However, spreading poverty and precariousness wider also fuels the time-bomb.
I am often seen as an egalitarian, but I expose what I find because I am a geographer and see what geographical comparisons reveal. I know that people do not have equal ability. We all have very slightly different genetic make-ups. However, it has always been clear that there was no way that the bizarre geographical distributions which social cartography reveals to be so extreme within the UK could have anything to do with genetic differences.
I have met many people in high positions, particularly in academia and government. Hardly any warrant being labelled geniuses. All have had their own handicaps. The most impressive have tended to be humble, and quite rightly so. These are (or were) people seen to be at the top of their fields. However, they did not get there by some inbuilt super-potential, but because of opportunity, chance, hard work and their individual reactions to their own handicaps and life events.
There is not, and never was, any “natural” hierarchy of human beings. British geographers have more reason to know this than any other group of academics. The history of British geography is littered with colonial racists who achieved little of lasting worth, but who thought they were members of a superior race and wrote this into (now) old geography textbooks that, with embarrassment, we try today to ignore. What we need is to teach the errors in what they said, so that the next generation is better able to spot closet eugenicists and racists than we have been.
One indication that we have hit peak inequality is so much going so wrong at the same time, as it did in the years leading up to 1913, the time of the last peak. Extraordinarily in 2018 we have rapidly falling levels of home ownership, far fewer secure tenancies, rapidly rising and exorbitant uncontrolled private sector tenancy rents, and—most recently—the potential for a housing price crash. This has all contributed to unprecedented post-war wealth inequality. There is little that is fair about how we are now housed.
Between 2010 and 2016, homelessness rose, rents rose, personal debt rose, housing prices rose, and the unpopularity of those who caused all of this rose among a growing majority of the young. By August 2016 it became clear that house prices in London had begun to fall. The then very recently sacked George Osborne had tried hard to ensure that property prices would continue rising and, consequently, to ensure that largely home-owning Tory voters would feel wealthier. Schemes to help first-time buyers were poorly disguised manoeuvres to boost housing value for the already well-off. All this while Osborne had recently done everything he could to propel London towards his vision of what the most economically successful city in the world should look like.
For Osborne, a successful London would also be the most expensive large city in the world. A place where the rich would be served by an army of ever more “productive”—but always relatively poor—labourers. He failed because no matter how hard you try, you cannot keep increasing income and wealth inequalities indefinitely. Do that and you stoke up the ingredients for a great catastrophe in the very near future. Like an addict, Osborne had kept on trying to stimulate the housing market with yet another hit of money from his “Help to Buy” schemes, but he was already clearly failing long before he was forced out of office by the political gamble of the European Union referendum.
On being handed office with no contest and without having to outline any plan or aspiration beyond one very short speech given only very shortly before she became the only candidate for Prime Minister, Theresa May (and her new Chancellor Philip Hammond) had no new ideas on how to gradually deflate the housing bubble. In the face of clear trouble ahead and in an attempt to make her position more secure, she tried another political gamble, a general election, in which she lost the majority that had put her in power. The (net) swing to Labour in June 2017 was unprecedented. In size it was similar to the swing that brought Labour to power in 1945, but it occurred over the two years from 2015, not the ten from 1935. Corbyn is just another sign that times are a changing.
May has never won a majority in a general election or even a leadership contest in her own party. Without a clear reason she was awarded the ultra-safe seat of Maidenhead in 1997 when she was aged 40. By early 2018 a house no larger than a train carriage cost £300,000 in Wheatley, the previously very normal and affordable Oxfordshire village where May attended grammar school. House prices in 2018 across the home counties, along with so much else, appear to have a reached a peak in 2018.
But house prices should be the least of our worries. More than 103,000 children were homeless in the UK on Christmas day 2015, almost all of them in England. That figure rose to 124,000 in 2016. By Christmas 2017 the estimate was of approaching 130,000 children waking up in temporary B&B accommodation on Christmas day. Then fire broke out in Grenfell tower and the country woke up to the housing catastrophe. It is one of a series of simultaneous catastrophes that are not uncommon in countries which become so extremely inequitable at the peaks, when things fall apart.
We are already seven years into a health disaster, while almost all of the rest of the world is making progress the UK no longer is. Outside of the UK (and the US) life expectancy was continuing to rise in almost all other rich countries as well as in almost all poor countries. The future population of the planet will now be both a little smaller and a little older than had been thought likely in 2010. There is a good news story out there, just not here. By 2018 it became even clearer that humanity was settling towards a new demographic worldwide equilibrium. We had passed the global peak in births in 1990 and the peak of that generation’s own children much more recently. Infant mortality is plummeting worldwide, and in every country in Europe; apart from the UK.
In March 2018 it was reported that UK infant mortality had risen significantly for two years in a row. This had followed severe austerity and real-terms spending cuts. In June 2018 the Office for National Statistics reported that: “The age-standardised mortality rate for deaths registered in Quarter 1 2018 was 1,187 deaths per 100,000 population—a statistically significant increase of 5 per cent from Quarter 1 2017 and the highest rate since 2009.” We know the health crisis is at a peak as 5 per cent rises in mortality cannot carry on for very long at all. Not outside of wartime. Not without a remarkably callous government.
Education has seen similarly calamitous trends as in housing and health. The introduction of the highest student fees in the world for the vast majority of English students during 2012 has led to a new generation beginning to realise that they have been very badly short-changed. There is not space here to talk about what has happened to schools across England and the terrible waste of money that has accompanied academisation, followed by real terms spending cuts in budgets that were supposed to be ring fenced.
Nor is there space to write about the crisis in mental health, in prisons, in social services, the spread of precarious low paid employment and the fear of many of now having to work with no retirement in future. But there is also an opening up of hope out of this inequality disaster. Top incomes have stopped rising. The take-home share of the 1 per cent has fallen in the last three or four years. The reported average remuneration of the highest paid UK CEOs of the largest companies fell last year. And while we may suspect that they have found another way to pay themselves, such reported falls are the first in my lifetime (and I am not young).
The wealth of the richest is still rising, that is true. Wealth tends to lag income over time, but the wealth of the richest is far less when measured in dollars rather than pounds because the pound has fallen so rapidly in value as inequality has peaked. There are many silver-linings.
Peak inequality is no time of celebration. The way down from the peak of injustice and unfairness is often slow and meandering. Conservatives governments begin to increase taxes on private landlords, cap increases in student fees and promise real rises in public health spending, again to be paid for by increased taxation of the affluent—what had until recently been anathema to them. After over four decades of always shuffling to the right, the UK is just beginning to take its first tentative steps to the left again. Once you begin to step left it can take a long time to stop. Income inequalities fell all the way from 1913 to 1978; that period was the last time they began to fall like they have—only just—begun to fall now.
The most recent two Conservatives governments have not taken these steps to the left willingly. The tip-toeing only began with the 2015 administration and the shuffling has become more pronounced since June 2017. They are being dragged leftwards by an electorate unwilling to take any more extremism. And they are also being dragged to the left by the fear of the alternatives which are far more radical than any opposition party has presented for at least three decades. For instance, the SNP, which became the third largest party in UK politics in 2015, is politically normal by European standards but radical by British norms. And the Labour Party is currently slowly becoming again a typically European large social democratic left-wing mass membership party—not the place that it was until recently, a place where mild-mannered Tories could feel at home, if never much loved.
As we step over the peak of inequality we see a new landscape ahead of us. It is a landscape where, as we travel downhill, with every year that passes our political parties become more normal again. The political distance between each remains the same, but they all shuffle to the left as they step downhill.
As we come down from the peak we should expect our children to become less educationally segregated. They are currently the most segregated by school of any children in all of Europe. We should expect what were the lowest paid jobs to become both better respected and better paid. Simultaneously the most ludicrously over paid will see pay fall or at the very least eaten away by inflation and more progressive taxation. This hurts little as when all top pay falls, housing prices at the top also fall and they can all still afford the same home!
We should expect housing quality to rise while at the same time it is shared out better and better with each passing decade, as from 1921 to 1981. Much more importantly we should no longer see our ranking by neonatal mortality fall from 7th in Europe to 19thin the 25 years to 2015 (see chart below). And we should no longer be used to having the worst performance in adult life expectancy in all of Europe. We should have some decent time to spend with our grandchildren. It is not much to ask for.
Dorling, D. (2018) This is what peak inequality looks like, Prospect Magazine, June 28th PDF and on-line version Thsi is an edited extract from Peak Inequality.
Neonatal mortality rankings, European Union countries, 1990 to 2015
June 27, 2018
Micro-advocacy
We know that you’re busy and that while you’d love to donate more time to progressive advocacy, life gets in the way.
Perhaps micro-advocacy is a way that you can support the cause of progress, without it taking up too much of your time? These actions listed below require minimal time commitment but will still help promote the progressive cause, especially if large numbers of people do this.
One reason micro-advocacy is needed is that those who hate progress are working hard to try to influence people, journalists and members of parliament in the opposite direction.
There are not many people who hate progress, but they tend to be very well funded by a few of the richest people in the country (including some of the richest people on earth). These are the people who are worried about having to share out their wealth, about not being able to drive their souped up cars quickly past your homes and your children’s schools.
You need to practise micro-advocacy because your opponents are repeatedly sending out supposedly common sense messages such as claimg that government is just like an individual and thus “you can’t spend more than you earn“. They do this to try to stop schemes such as the building of new cycle paths, or other schemes that they are opposed to in principle.
Of course affluent countries can afford to have cycle tracks if their politicians wish to have them – and a great deal more than just cycle tracks, but let use that as an example.
Sat down with your phone and got a spare 5 minutes?
• On Twitter? – why not tweet about [housing/public health/schools] to [@an_MP @A_Pudit] and to your followers and others, to raise awareness of the issues and latest evidence?
• Send an email [most journalists have easy to find emails] to someone who writes and is in the public eye on these issues saying how much you really value not just cycling provision, but also public health and the NHS, good state schools and decent housing – and how investing more public funds will promote social inclusion, equality and prosperity.
• point out when someone on the un-progressive side of politics tries to use words such as “Social Justice”, “Fairness” and “Equality” to advance their harmful agenda. These deceptions need to be called out.
Having a tea break, got 10 minutes free?
• Email your MP to tell them how much you value health and equality and would like to see more affordable homes built. You can find their contact details on: [http://www.parliament.uk/get-involved...]
• Promote equality’s many benefits to friends and family through word of mouth and social media.
• Have a read of the latest news & blog pages and help promote them by sharing them through your social media pages (make your posts public) or by emailing to friends.
• Beware and point out people who oppose progress using what at first glance appears to be outward-looking language to advocate what they actually know to be the agenda that is parochial, and more suited to those uncomfortable with the wider world.
Twiddling your thumbs for 30 minutes?
• Email your local councillor to tell them how much you value cycling, walking, health and equality and housebuilding and a good education, social services and whatever else you see as vital. Explain how people’s lives can be improved with sustained investment!
• Write to the Letters Editor of your local newspaper and to the editor of your “very local” newspaper [like The Voice in Bristol, or the Oxford Mail], to give your views on local issues – for example to explain why you support progressive politics and how this can improve things for your family, friends and neighbourhood.
• Expose those who are trying to stop things improving. How they try to name policies such as the community charge (really a poll tax), and spare room allowance (in practise a bedroom tax) to make their nastiness appear reasonable.
Waiting around? Got a spare hour on your hands?
• Write to them all! Tell them what you think. Tell them why you want rough sleeping tackled, more affordable homes built, poverty reduced, health services improved. Explain why you hate inequality and how a fairer world for everyone, Scandinavian- style, is within reach – it can be done – in your lifetime, for the lives of your children and (possibly future) grandchildren and for everyone else too.
• Have a look at the latest news on a set of websites you value and share with friends.
• And also look at what those trying to stop things getting better for most people are doing. Look at their websites which show how cunning and determined they can be. They assume you do not do this, but you need to know what you are up against and why your well-directed time and effort is needed. Be kind, be clever – make the world more even and less unequal.
Thank you! – it all helps to raise awareness of the issues. Without it little ever gets better.
An example The Seven Habits of Effective Active Advocates – on transport
1. Effective advocates take the initiative wherever possible to put across the case
Effective advocates are pro-active. For example, after a city-wide cycling event they will write about how great it was and how this shows demand for cycling and the need for more investment and enforcement of safer 20mph speeds. They take every opportunity to make their case, calmly and clearly, and inform, enlighten and inspire the wider public and decision-makers – both in writing and in conversation face-to-face. When it is revealed that the local police are not enforcing 20mph limits, as happened recently in York, they demand that Julia Mulligan, the local Conservative Police and Crime Commissioner, who has publicly confirmed that 20mph can be enforced in the same way to other speed limits, ensures that North Yorkshire Police will honour their promise as they have “confirmed that it will indeed enforce them.”
2. They use social media
Facebook and Twitter offer a great range and a means to connect to hundreds, potentially thousands, of people. A post on Twitter can be seen by 500 people and takes very little time to do. Putting leaflets through letterboxes to reach the same number of people would take 3 hours or so.
In terms of effective reach for the time and effort and cost put in, social media wins hands down. For instance, in Bristol today you can contact @MarvinJRees (Mayor), @mthrel (Cabinet member for transport) and @Kevinslocombe (advisor to Mayor) who are all useful people to influence. There are plenty of others! Though let’s not neglect traditional channels such as leaflets and posters, and print media. And point out that when in (recorded) public meetings the local Police and Crime Commissioner (for instance) when asked ‘How will the residential 20mph limits for West of York be policed ?‘ answered that ‘There are no new resources going into the policing of 20mph limits‘. And when asked ‘Will there be Fixed Penalty notice fines like in Oxford? replied ‘No‘. Ask why are children and other vulnerable pedestrians and cyclists worth less in York than in Oxford?
3. Advocates write to the local papers
Do this because people do still read the letters pages of local newspapers! And not everyone is on Twitter or Facebook. Some people prefer a physical newspaper. The letters pages of local papers are popular and are one useful channel for putting a message out to mainstream readers – reaching 3,000 people a time. Here are the links to many of the papers – why not write a letter?
Even if you don’t live in York you could write one to the local newspaper in York saying that you have heard that the ‘Police Commissioner Julia Mulligan says those who are driving above 20-miles an hour will be punished‘ but asking if this has ever happened? Don’t just leave it to the people of York – they need help. Why not write now?
4. And then write to your hyper-local newspapers too!
Despite the boom in online big-name media, there is still a place and need for very local media. The “Voice” series in Bristol caters for such a need, as does Bishopston News. These are another channel for published letters to the editor, and for suggesting local stories. It all helps for putting the message out.
In York and all other towns and cities, the political parties are a key route to influence. Recently the Green Party in York revealed that on enforcing speed limits ‘frankly, the police are reluctant‘ to do their duty. And that they had the backing of the local Conservative Police and Crime Commissioner when they chose not to enforce the law that is the most effective way to prevent deaths on the roads. Road crashes are most common cause of death of anyone aged between 5 and 24 in the UK.
5. Write to your local politicians and decision-makers. And to your MP.
In Bristol success was won only with great effort. In 2018 the Sun newspaper reported that ‘Introduction of 20mph zones ‘save 16 lives’ in Bristol – with plans to roll out more areas across UK‘. But keeping up support for 20mph at this critical time means contacting and congratulating the Mayor (Marvin Rees), the cabinet member for transport (Mhaira Threlfall) and local councillors (see the Bristol City Council website to find out their details). Politicians need to have their fingers on the pulse of local opinion and in an open and democratic society, people are free to make representations and to give their views.
They won’t always agree or understand, but it at least helps to make them aware of the depth of feeling on an issue. And remember – the organised opposition is doing this! If we don’t make our case, our representatives won’t hear what we have to say and may miss out on knowing about important news reports.
Members of Parliament also want and need to know what’s going on with their constituents and the issues which affect us in our part of the city. They have links to the city council and may have some sway nationally. They need to hear from you!
6. Use evidence and facts, but also put these in a narrative so people can understand better
We all relate more easily to stories than to abstract facts. Our narrative is about how safer speeds make it safer and easier for people to get about by walking and cycling; about how they open up local neighbourhoods for vulnerable people and remove the fear of motor traffic; about how the city can be a better, more prosperous place if we make it people-centred, not car-centred. Think of the story you wish to tell and how it relates to people you live around and our shared humanity.
And remember, unless people care about an issue, they are highly unlikely to pay attention to it, let alone act on it. Caring about something is always a necessary, but not a sufficient, precondition for support and action.
7. Advocates persist and have patience, good humour and goodwill
Here are some tips from a very successful activist in Australia about how to be a happy and funny activist.
Advocacy is not easy! There are rarely any quick wins; it takes time and effort and the road can be rocky. But we must persevere in our quest. “Rome was not built in a day” and our case will not prevail overnight. We need to constantly and steadily make the case, to inform the uninformed and under-informed majority of the people, and to guide and help people.
Think of each letter, each tweet, each Facebook post, each conversation as being one brick which helps to create the eventual building.
If we keep calm and focus on the issue, we will prevail. Let angry opponents have the rage – we have time, and calm common sense and goodwill will ultimately prevail. And talking to people face-to-face, and carefully listening to a person’s point of view, is crucial too of course. After all, what we are calling for is all about improving everyone’s lives, and what better way to inspire people than in person?
Finally – It is never sufficient simply to criticise or otherwise react against the wrong-doers themselves; one must also react against those who, having had the opportunity to react, fail to do so. In his book The Complexity of Co-operation, Robert Axelrod dubbed this kind of secondary sanction a “metanorm“. He showed by simple computer models and examples from history and the press, that unless this kind of second-level sanctioning is deployed, bad goes merrily on its way to worse.
So: no more being polite to people who are polite to tyrants. Or being polite to people who are polite to people who are polite to tyrants – and so on!
As a friend of mine recently wrote to me: Maybe even at this apparently-late stage, the juggernaut of tyrant-friendly rightwing politics, in full career, might suddenly find itself wheel-less?
He was inspired to say this after The Red Hen Restaurant in an act of micro-advocacy refused to serve food to Trump’s publicist. That one tiny action may itself turn out to be far more important than it might have seemed at the time. Indeed, the amount of media coverage it’s provoked suggests as much. This is what the proprietor said, after politely excluding Sarah Huckabee Sanders:
“I have a business, and I want the business to thrive. [But] this feels like the moment in our democracy when people have to make uncomfortable actions and decisions to uphold their morals.”
Go on – send a tweet. Its the least you can do and you never know where it might lead!
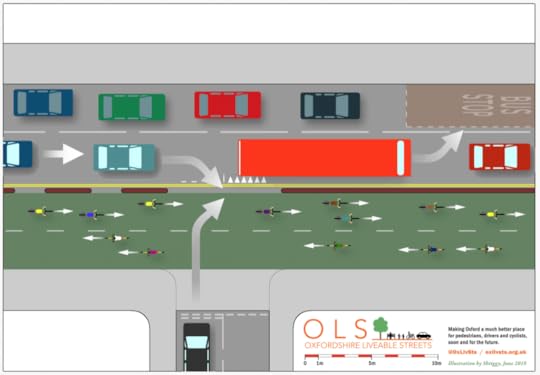
Making Oxford a much better place for pedestrians, drivers and cyclists, soon and for the future.
The image above is taken from here. Click to fid out why.
June 26, 2018
The rise in mortality—how the government has chosen to take note
In May 2018 the Department of Health and Social Care responded to the recent rise in deaths in England by saying… that it monitors the age-standardised-mortality-rate, which it said had remained “broadly stable” and “did not warrant any action”
In June 2018 an ONS report, using the age-standardised-mortality-rate, confirmed researchers’ concerns: deaths had in fact risen by a statistically significant 5% in the first quarter of 2018, reaching their highest rate since 2009.
In response the Department of Health and Social Care said that it was asking Public Health England (PHE) to conduct a review into deaths and would announce a publication date in due course.
Why was the department unable to say when it would be able to publish this review? Is it not urgent?
A department spokesperson said, “The number of deaths can fluctuate each year but generally people are living longer, and as the ONS said itself, the number of deaths last winter may be due to a combination of flu and uncharacteristically cold weather in February and March.”
In fact ONS have not yet analysed the causes of death but (unlike the Department for Health and Social Care) ONS do say “influenza activity remained at medium levels throughout the whole of January and February 2018″. The levels were not high. Furthermore, the deaths began to rise rapidly long before the weather turned cold during February. The suggestion that an unusual rate of influenza is again to blame, as the department blamed flu in 2017, 2016, 2015, 2014, 2013, and 2012, is risible.
The Department of Health and Social Care continued: “We are taking strong action to help people live longer and healthier lives—cancer survival is at a record high while smoking rates are at an all time low, but we do want to understand more about life expectancy and mortality trends, which is why we have asked PHE to undertake a review.”
Given the worst reversal of health outcomes since World War Two it is hard to see what the “strong action” is.
The British Medical Journal commented:
On hearing the news of a review, Hiam, Dorling, and Martin McKee, professor of European public health at the London School of Hygiene and Tropical Medicine, said, “We are delighted that PHE will be conducting a review, and we look forward to reading its terms of reference—in particular, whether it will examine the clear conclusion by the ONS that the longstanding improvements in life expectancy have slowed dramatically and, in many areas, have gone into reverse.”
Read the latest letter published by Hiam, Dorling and McKee in the British Medical Journal on June 25th 2018 here.
June 21, 2018
Be Realistic – Demand The Impossible
What becomes possible when you begin to demand (what they tell you) is impossible?
A short talk given by Danny Dorling at the York Festival of Ideas, University of York, June 15th 2018:
A prelude to: Peak Inequality – Britain’s Ticking Time Bomb in which Danny Dorling presents the evidence that in 2018 the growth in UK income inequality may have finally peaked. Inequality began growing in the 1970s and the damaging repercussions may continue long after the peak is passed. There will be speculation and a little futurology.
On July 11th 2018 in London Danny will be in conversation with Faiza Shaheen, director of the think tank CLASS and former Head of Inequality and Sustainable Development at Save the Children UK. Faiza recently explained that the rich, like viruses, also develop resistance, in their case to redistributive taxes. They use their wealth and power to carve out tax loopholes and lower tax rates. Their fortunes balloon. Inequality grows. In which case why should inequality peak now? Details here

A society of low inequality – drawn by Ella Furness
June 20, 2018
The age-sex standardised mortality rate for deaths in England has risen by 5% in 12 months
The ASMR has risen by 5%. So, once again, we repeat: how many deaths will it take for the Government to take note?
In an editorial in March, we raised concerns that more than 10,000 extra deaths had occurred in the first 7 weeks of 2018, compared to the average of the last 5 years.(1) As mentioned in a previous rapid response,(2) Jeremy Hunt was asked on 20th March 2018 in the House of Commons: ‘During the first seven weeks of 2018, 10,375 more people died in hospital than in the same weeks in the previous five years…Why did all these extra deaths occur?’
The Secretary of State for Health and Social Care replied:
‘As the hon. Gentleman will know, these figures cover England and Wales. He will also know that they do not take account of changes in population or changes in demography, so we use the age-standardised mortality rate, which, according to Public Health England, has remained broadly stable over recent years.’(3)
The response from a spokesperson for the Department of Health and Social Care to our concerns when the excess deaths had reached 20,000(4) on 8th May 2018 was similar:
“We keep all research in this area under review, but the ‘age standardized mortality rate’ – which has been broadly stable in recent years – is considered a much more reliable measure, as this type of research doesn’t take into account fluctuations in population numbers and the ageing population.”(5)
The Quarterly Mortality report from the Office for National Statistics (ONS) published on Monday confirms our fears.(6) It states:
‘The age-standardised mortality rate for deaths registered in Quarter 1 2018 was 1,187 deaths per 100,000 population – a statistically significant increase of 5% from Quarter 1 2017 and the highest rate since 2009’.
Figure 1 from ONS shows how remarkable this is:
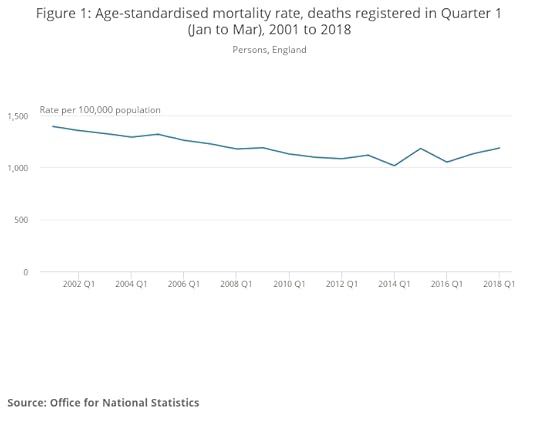
Figure 1: Age-standardised mortality rate, deaths registered in Quarter 1 (Jan to Mar), 2001 to 2018
The ASMR has risen by 5%. So, once again, we repeat: how many deaths will it take for the Government to take note?
References:
1. Hiam L, Dorling D. Rise in mortality in England and Wales in first seven weeks of 2018. BMJ 2018;360:k1090 https://www.bmj.com/content/360/bmj.k...
2. Hiam L, Dorling D. Re: Rise in mortality in England and Wales in first seven weeks of 2018. BMJ 2018;360:k1090 https://www.bmj.com/content/360/bmj.k...
3. House of Commons Hansard. Topical Questions, 20 March 2018. https://hansard.parliament.uk/commons... (accessed 19 June 2018)
4. Hiam L, Dorling D. Re: Rise in mortality in England and Wales in first seven weeks of 2018. BMJ 2018;360:k1090 https://www.bmj.com/content/360/bmj.k...
5. Iacobucci G. Government must investigate rising excess deaths in England and Wales, experts warn. BMJ 2018;361:k2127
6. Office for National Statistics. Quarterly Mortality Report, England: January to March 2018. 18 June 2018. Available at: https://www.ons.gov.uk/peoplepopulati... (accessed 19 June 2018)
Competing interests: No competing interests
20 June 2018
Lucinda Hiam, Honorary research fellow, London School of Hygiene and Tropical Medicine
Professor Danny Dorling, University of Oxford
Professor Martin McKee, London School of Hygiene and Tropical Medicine
@lu_hiam @dannydorling @martinmckee
To see the response in the BMJ, or for a PDF of this response, click here.
June 19, 2018
Peak Inequality & Jubilee 2022: the case for the write-off of UK historic student debt
The Labour Party must draw up plans to write off the majority of the debt run up by students who paid fees under England’s post-2012 funding regime.
This issue and much more that arrises when we hit Peak Inequality will be being discussed by Danny Dorling and Faiza Shaheen in London at 7pm on Wednesday July 11th 2018 at the London Review of Books Bookshop, details of that event are here.
Danny Dorling speaking on Jubilee 2022 – the case for the write-off of UK historic student debt, Invited Seminar, Centre for Global Higher Education, University College London, June 14th 2018.
A report of the talk was posted in the Times Higher Education:
Labour ‘needs plan’ to write off English student debt
Danny Dorling suggests limiting debts to pre-2012 levels
June 14, 2018
By Chris Havergal
The Labour Party must draw up plans to write off much of the debt run up by students who paid fees under England’s post-2012 funding regime if it is to implement its promise of free tuition, a leading academic has said.
Danny Dorling, Halford Mackinder professor of geography at the University of Oxford, has proposed a model under which graduates who were among the first cohort of students to pay £9,000 a year for their degree would have their tuition debts written off to the extent that they would owe no more than graduates who started their course in 2011-12, and hence were the last to pay £3,000 a year.
Students in the final cohort to pay higher fees – currently capped at £9,250 – would have their debts written off to the extent that they would owe little more than the first year group of any future free tuition system, with the debts of graduates in the cohorts in-between being cancelled on a tapering scale.
Professor Dorling, who was set to present his ideas at a seminar hosted by UCL’s Centre for Global Higher Education on 14 June, said that this solution would ensure that no graduate was significantly disadvantaged by changes in student finance policy simply because they had been born a year earlier or later than another graduate.
Labour leader Jeremy Corbyn faced controversy after the 2017 general election when he said that his pledge to “deal with” historic student debt did not amount to a promise to write off all outstanding loans. It has been estimated that an across-the-board debt moratorium could cost taxpayers about £100 billion.
But Professor Dorling said that Labour needed to draft a policy on the issue because it would be asked “more and more” about student debt. He acknowledged that his proposal would cost tens of billions of pounds but argued that it was important to address a “point of principle”, and explained that the amounts of money involved were “minuscule” compared with the overall demands on public finances.
Professor Dorling argued that his suggestion had the advantage of falling short of pledging to abolish all debt, hence avoiding the need to reimburse people who paid £3,000 a year, who were more likely to have paid their debts off. The approach was fair, he added, because those who studied under the post-2012 regime and had repaid their loan – or had never taken one out in the first place – were likely to be from the most privileged backgrounds.
Starting the conversation now would make companies considering buying part of the student loan book, which the government is trying to sell, aware of the risk that they were taking. The scenario envisaged by Professor Dorling could even occur under a future Conservative government, he argued, given the party’s increasing concern over student finance.
“It’s necessary to put forward a potential policy to deal with outstanding debt, and my main idea is to take the last to come in under the current regime and the first to come in and to try to ensure that their economic futures are as similar as possible to the students one year away from them in time,” Professor Dorling told Times Higher Education.
“We need several of these suggestions, and we need them now – there could be a snap election, but there will certainly be one by 2022, and this needs to be talked about years before implementation to avoid a cock-up.”
June 13, 2018
One year on from the Grenfell fire
It is scandalous that politicians are whittling down public housing budgets and failing to take action to keep residents safe.
Letter, June 13th 2018:
A year ago we witnessed Britain’s deadliest fire in living memory. The morning after, we learned that warnings about fire safety from residents had been ignored. Later we heard about the safety failures at national and local level, and companies hawking unsafe building materials unchecked.
After Grenfell, many argued that the atrocity should signal a turning point in housing policy. We have yet to see this turning point. We hear that cladding like that used at Grenfell will not be banned. Indeed, it took 11 months for Theresa May to commit £400m to remove existing cladding from tower blocks. Even this modest and long overdue announcement was revealed as a sham: the £400m was to be pinched from affordable housing budgets. It is scandalous that a year on from this tragedy, politicians are whittling down public housing budgets and failing to take action to keep residents safe.
This political disregard for social tenants is rooted in state disinvestment from public housing, and unaccountable private interests taking over the building and management of social housing. Our estates are being run down and demolished while public assets are sold off. Meanwhile 80% of new homes built in London are affordable only to the richest 8% of the city.
The mayor of London is to enforce ballots on some estates facing “regeneration”. This is a start – but we need political will at all levels to ensure that development benefits tenants first, and that what gets built locally meets local needs.
A tragedy like Grenfell must never happen again. We need public investment in safe, decent public housing that is affordable for everyone. We want a housing system where tenants are listened to. And we need housing policy driven by public interest, not by the market.
Katya Nasim, Radical Housing Network
Dr Faiza Shaheen, Director of CLASS
Doug Thorpe, Stop HDV Campaign
Emma Dent Coad, Labour MP for Kensington
Sian Berry, Green party London assembly member
Piers and Tanya Thompson, Save Our Silchester
Richard Chute, Chair, Earls Court Tenants’ Association
Joe Beswick, Head of Housing and Land, New Economics Foundation
Eileen Short, Chair, Defend Council Housing
Pilgrim Tucker, Community Organiser
Dawn Foster, Journalist
Cllr Jonathan Bartley, Co-leader, Green party
Jean Lambert, Green party MEP for London
Susan Pashkoff, Chair, East London Unite Community
Martin Goodsell, Secretary, East London Unite Community
Rachael Hookaway, GMB Young London
Danny Dorling, Author of All that is Solid: The Great Housing Disaster, University of Oxford
Anna Minton, Author of Big Capital: Who is London for?, Reader in Architecture, University of East London
Dr David Madden, Author of In Defense of Housing: The Politics of Crisis, London School of Economics
Samir Jeraj, Author of The Rent Trap
Dr Sally Zlotowitz, Clinical and community psychologist, Housing and Mental Health Network
Sabtir Singh, Chief executive, Joint Council for the Welfare of Immigrants
Sahaya Guthrie, Stop the Elephant Development
Danielle Gregory and Hannan Majid, Ledbury Action Group
Pauline Wamunyu, Save Reginald House and Tidemill
Jacqueline Utley Achilles, Stop and Listen Campaign
Lucy Butler, Deptford People Project
Heather Gilmore, No Social Cleansing in Lewisham
Luciana Duailibe, Chair, Co-oPepys Community Arts Project
Bill Perry, Lambeth Housing Activists
Potent Whisper, Our Brixton
Amina Gichinga, London Renters Union
Anne Cooper, Save Cressingham Campaign
Andy Thornes, Crossfields Residents Association Secretary
Anuj Vats Citiscape, Residents Association
Aysen Dennis, Fight 4 Aylesbury
Simon Hannah and Ruth Cashman, Joint branch secretaries, Lambeth Unison
Sonia Mckenzie, Chair of the Fred Wigg and John Walsh Towers Tenants and Residents Association
Terry Harper, Millbank Residents Association
Uzoamaka Okafor, Chair, Myatts Field North Residents Association and PFI Monitoring Board
Dr Vickie Cooper, Open University
Dr Debbie Humphry, Kingston University
Dr Stuart Hodkinson, University of Leeds
Dr Nicholas Falk, Urbed Trust
Michael Edwards, Hon professor, UCL (Bartlett School of Planning)
Ben Beach, Concrete Action
John Hamilton, Lewisham People Before Profit
Heather Kennedy, Digs (Hackney Renters)
Sophie Morley, Architecture Sans Frontières UK
Tom Wilkinson, Architectural Review
Hannah Sheerin, President, Cambridge University Architecture Society
Liza Fior, MUF architecture/art
Douglas Murphy, Writer, RCA/CSM
Elizabeth Wilbraham, Workers Inquiry: Architecture (Architectural Workers Union)
Charlotte Grace, Novara Media
Andrea Luka Zimmerman and David Roberts, Film directors of The Estate We’re In
Paul Sng, Film director of Dispossession
PDF and Guardian Newspaper Link

Grenfell Tower, North Kensington 2017/2018
Danny Dorling's Blog

- Danny Dorling's profile
- 96 followers

