
Danny Dorling's Blog, page 23
December 10, 2018
Equality and what Brexit tells us about the British
Whatever kind of Brexit occurs – hard, soft, or none – people are going to be asking questions for many years about why this has happened and what it means. Just over a year before this talk is to be given, extra money had to be found to pay for Brexit in the November 2017 budget than could be found for the NHS. In early 2018 there was an unprecedented rise in deaths among elderly people in The UK. On the same day as that budget, we also learnt that Britain would lose a place in the International Court of Justice for the first time since the court’s inception in 1946. But what can Geographers tell us about Brexit, what does Brexit tell us about the British, and what might inequality have to do with all of this?
The arguing and making of claims and counter-claims about Britain’s geographical status that is currently underway will not improve the image of Britain in the eyes of much of the rest of the world’s people. But there is an upside. The British may well learn a great deal about themselves as a result. Not least that Britain, and even Brexit, has its roots in the British Empire. Traditionally British Geography, a subject that was partly born in this country due to Empire has not been very good at explaining what the Empire was and why it mattered. Brexit may well be the point at which the England finally learn about the importance of geography: from the Irish border through to the modern day priorities of India. And also when we learnt how much goes so very wrong when you have the widest economic inequalities in all of Europe.
A public lecture given by Danny Dorling
Equality North Somerset at the The Royal Hotel
Weston-super-Mare, December 5th 2018
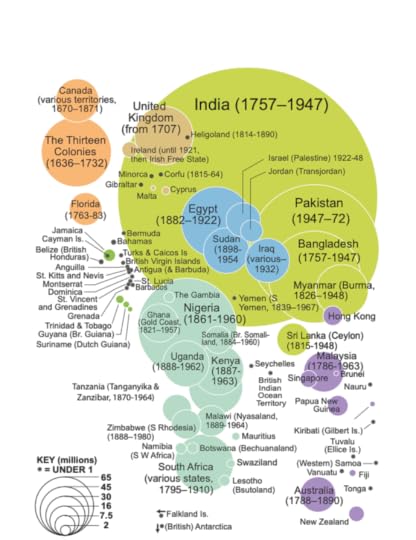
The British Empire – by population today


December 9, 2018
The Distribution of Wealth – Growing Inequality?
A review of ‘The Distribution of Wealth – Growing Inequality?’ By Michael Schneider, Mike Pottenger and J. E. King, The History of Economics review, Volume 68, No. 1, pp.75-78, by Danny Dorling.
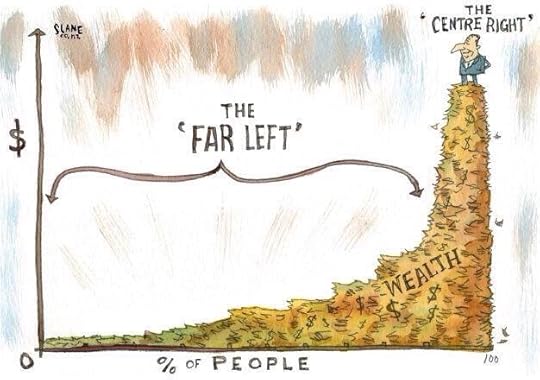
The far left and the centre right
Most books that have a question mark in their title are unreasonably hedging their bets, but not this one. There is now substantial evidence that inequality in wealth grew until the year 1913 in many countries (see page 177) and then fell continuously after that date until the mid-1970s, only then to begin to grow again, dipping temporarily during the years of the recent global crisis. Right now, we are not at all sure of what is happening. Are we at a peak or just a temporary hiatus in a longer climb to come? Hence the well-deserved ques- tion mark at the end of the title of this book. The question of the future distribution of wealth is extremely interesting because it is a genuine question.
A very unequal distribution of wealth can be sustained for some time if a sufficiently authoritarian regime is in charge. Wealth inequalities are greatest in times of slavery and, as the political scientist and anthologist James Scott has repeatedly claimed in books well worth reading alongside this volume, slavery has co-existed with civilisation for almost all the time we have had anything resembling civilisation. The question of the distribution of wealth is largely a question of freedom. When are we most and least free, and how free can we really be in a human civilisation? Will the greedy always take too much?
Michael Schneider wrote the first edition of this book, titled merely ‘The Distribution of Wealth’ in 2004 without the additional question. Academia owes him a huge debt in having opened up an area of investigation which had mysteriously lain large hidden until then. Kevin Cahill has considered land ownership and John Hills looked at recent wealth surveys, but no one has surveyed so many countries and in such depth. Wealth tends to be a private secret. Its distribution is not publicly disclosed. Income is more often taxed; income is declared, not wealth.
Mike Pottenger and John King have joined Michael to bring about a tour de force. No reader could ever feel they were denied statistics on almost everything we know with any accuracy about the distribution of wealth. The book is full of tables of data, but it is also packed with insight.
The authors quote Fisher, not R. A Fisher the statistician, eugenicist and geneticist but Irving Fisher, the progressive economist who in 1912 said: “Equality of wealth is an unstable condition and, even if once established, would not endure, because of the unequal forces of thrift, ability, industry, luck and fraud … inequality once established tends, by inheritance, to perpetuate itself in future generations.” (p. 89). Note that Fisher was saying this just before that 1913 peak. He could not and did not know what was to come.
Had it been R. A. Fisher saying those words, he might well have added that all this was inevitable because of the differing genes of different individuals. R. A. Fisher believed that some people were just more able than others and so both accumulated and deserved greater wealth. What no one knew back in 1912 is that some people might, genetically, be more acquisitive than others and have an innate tendency to want to acquire more; more money, more qualifications, more power, more wealth. Others – the vast majority of us – are more pro-social and less greedy.
The wonderful thing about innate characteristics is that they are not here forever, they quickly dissipate through the generations. Even with assortative mating the outcome varies. Someone may well be born very greedy, but their children are very unlikely, simply by the chance way in which we receive our genetic inheritance, to be quite as greedy as the greedier (or even the less greedy) of their two parents. And then although the children of the rich often inherit much of their material wealth, they are usually less cursed by their most avaricious parent’s biological traits and the wealth is not held onto in greater and greater concentration.
Pity humans on the day when the greedy and rich begin to screen their sperm and eggs for ‘greed genes’ to produce even more acquisitive versions of themselves to hold onto their wealth after their deaths. But we are a long way from there as yet.
There are remarkable geographical variations in what the acquisitive have been allowed to get away with. This book reveals that the richest of Japan hold the least wealth when the 20 most affluent countries are compared. The richest 10% there hold just 39% of all the Japanese wealth. In great contrast, in Switzerland, they hold 71% and in Denmark the highest proportion is 76%. Denmark enjoys ‘income’ inequality that is remarkably low, almost as low as in Japan, so quite what is going on there is very hard to gauge. Switzerland is also dramatically more equal when it comes to income inequality than the USA and UK, but when it comes to wealth inequality the best-off 10% in the UK take ‘just’ 56% of everything and the best-off tenth in the USA reserve 70% of it all for them- selves (p. 85).
Imagine 30 children in a playground or a classroom who behaved like this, where the best-off three kept 70% of all there was, leaving 30% to be shared out among the other 27. Would the other 27 play well with those three? And within those three there would not be much solidarity, as one would own more than the other two combined. Inequalities in wealth are greatest within the wealthiest group.
It is possible that a high level of wealth inequality without high income inequality is not especially harmful, if the wealthy just hold and never spend their wealth. If they dress as if they don’t have it, if they live as if they don’t have it, rather than flaunt it, is the effect as bad? We don’t know. Whether or not the other children know that you are so wealthy, could you be their friend, a good friend, given that you know what you have?
In Australia where all three authors of this book are based, the best-off tenth take 45% of all wealth. Is that good or bad? Is it largely a reflection of Australia’s colonial youth or the effect of continued immigration and emigration or of a greater propensity for hiding wealth off-shore if you amass a great deal in Australia? Or are these figures just out of date since the Sydney property market boomed? And was Australia the place that enjoyed the greatest wealth equality for the greatest length of time before the colonisers arrived? These are all questions we are still left with after reading this book.
We are told that ‘inequality in the distribution of income accounts for less than half of inequality in wealth, that age differences account for only part of the gap … that non- uniform inheritance also makes a significant contribution [as do] non-uniform saving behaviour, and … rates of return on wealth’ (p. 102).
Refreshingly this book takes issue with Thomas Piketty and supports Gregory Mankiw’s suggestion that ‘the forces of consumption, procreation and taxation are and will probably continue to be, sufficient to dilute family wealth over time’ (p. 108). The authors also favorably quote James Galbraith’s 2014 conclusion:
“There is new evidence of declining inequality in China and also in Europe after 2008, at least if one takes the continent as a whole. In the US there has been a sawtooth pattern, closely related to the stock market, with inequality peaks in 2000, 2007 and 2013, but little trend since 2000 … Perhaps Piketty’s Law will vanish – as quickly as it has appeared.” (p. 116)
However, Galbraith says little about India or Africa or about the very many tiny tax- haven treasure islands dotted around the planet where a few of the extremely rich live and where most of the very richest squirrel away parts of their fortunes.
This book seriously considers the arguments that greedy behaviour is virtuous behav- iour. Quoting Edmund Burke in 1790:
“The characteristic essence of property, firmed out of the combined principles of its acquisition and conservation, is to be unequal. The great masses [of property] therefore which excite envy, and tempt rapacity, must be put out of the possibility of danger. Then they form a natural rampart about the lesser properties on all their gradations.” (p. 120)
The wealth of the extremely rich protects the wealth of others
Edmund Burke was a Whig MP, a man of property and substantial wealth, heir to an aristocratic lineage. If one of his cells could be harvested and his whole-genome sequence derived, we would see, if inclined, whether he was born with the various genes hypothesised to be associated with extreme greed (a psychopathy).
The individual proclivities of those advocating different ideological positions when it comes to the morals of hoarding wealth are not dwelt on much in this book. This might be in good taste, but I was left wondering as to what underpinned Michael Oakeshott’s 1956 defence of the sanctity of private property or William Stanley Jevon’s 1871 claim that ‘every mind … is inscrutable to every other mind and no common denominator of feelings seems to be possible’ (p. 121). The un-empathetic Jevons, concludes that we cannot know what distribution of wealth might be preferable and should not be concerning our- selves with such questions. Hardly any women appear in these descriptions of the debates, almost certainly because they were almost always not included, but perhaps their sense of entitlement is not as self-centered?
Isaiah Berlin argued for wealth inequalities in 1956 on the grounds that ‘it is only the most fanatical egalitarian that will demand that such conflicts invariably be decided in favour of equality alone, with relative disregard of the other “values” concerned’ (128). He partly (but not only) meant that more ‘colour and variety in society’ were desirable. In contrast, Amartya Sen argued that greater equality resulted in more colour, variety and flourishing, while my colleague Jonathon Wolff is quoted in this book questioning Berlin’s conclusions suggesting that they fail to help resolve the conflict of who really should have what – of what a fair distribution might be (p. 128).
The solutions to creating fairness suggested in this volume are drawn from a very wide variety of sources. They include an annual tax on wealth, which almost half of all OECD countries already have in one form or another (p. 139). Another Wolff (Edward Wolff) is favourably quoted explaining that if this were introduced, it ‘would redistribute wealth from the elderly to the young, from families to the unmarried and from whites to blacks’ (p. 140). Capital gains tax is also an effective tool, and more widely used in affluent countries. In conjunction with all this, handing out wealth to groups that do not have it has an obvious initially equalising effect, as occurs when governments instigate child trust funds for all children or transfer assets at a discount. The authors do not mention it, but at first the sale of council houses at a discount in the UK was a massive redistribution of wealth to the poor (Dorling, 2011).
Taxes on wealth transfers between individuals, including inheritance tax are another break on the growing accumulation of wealth by a few – long advocated but rarely as carefully examined as here. Additionally or alternatively, the communal ownership of wealth can make us all more equal. Examples range from owning common land, to your nation’s health service or the cooperative business you work in or the Cambridge college of which you are a member and sit on the governing body. The last example is not mentioned in this book, but I thought I would add it, as the preface of the first edition of this book, is also included here, Michael Schneider makes mention of the influence on him of studying and researching in Christ’s College Cambridge which, as with all such colleges, is communally owned.
The book ends with a warning about the undesirable and often unintended consequences of allowing ‘the monied interests’ to acquire more monies ranging from their ‘undue influence over university appointments in economics’ (p. 180) as they sponsor posts, through to their undue electoral influence as they finance political parties and the health damaging, crime creating, opportunity denying, soul destroying, gross inequality that appears to follow in the wake of any period in a place that allows the rich to get richer at the expense of the rest.
There is so much I would not now know had I not read this book. And I thought I knew a great deal about wealth and its distribution. In short, we don’t know if wealth inequality is still growing over all, but we do know that it would be very bad if it were still growing today. Most importantly, we now know very many ways in which we can and do collectively choose to control the greedy.
It was a pleasure to read and review this book.
Reference
Dorling, D. 2011. “Underclass, Overclass, Ruling Class, Supernova Class.” Chapter 8. In Fighting Poverty, Inequality and Injustice, edited by A. Walker, A. Sinfield, and C. Walker, 155–176. Bristol: Poverty Press.
Read more here including on-line in the journal this review was originally published in.
Or click here to listen to the The distribution of wealth: How the system makes us poor and them rich, an audio recording of: The People’s Parliament, House of Commons, London, March 24th 2015. On the panel: Andrew Fisher (author of the failed experiment), Jenny Jones (Green Party Leader in the Lords), Danny Dorling, and Prof. Mariana Mazzucato (University of Surrey). Chaired by John McDonnell MP.
December 8, 2018
The UK Government’s misplaced prevention agenda
Fixing the health crisis is a choice for politicians, not people
BMJ Editorial Published on-line 5th December 2018 by Lucinda Hiam, honorary research fellow, London School of Hygiene and Tropical Medicine and Danny Dorling, Halford Mackinder professor of geography, University of Oxford. Discussed in this talk, given on the 7th December 2018 to the annual Oxford School of Emergency Medicine Conference:
“Prevention is better than cure.” It’s an old adage, and one the new secretary of state for health and social care, Matt Hancock, chose for his plan to improve healthy life expectancy in the UK, saying: “It’s about people choosing to look after themselves better, staying active and stopping smoking … Making better choices by limiting alcohol, sugar, salt and fat.” Public Health England hailed the announcement as “a seminal moment.” Others were underwhelmed.
“Most of us are now living longer,” states the plan. This is misleading. Decades of increasing life expectancy in the UK have ceased; infant mortality is now rising and life expectancy is declining for many age groups, and for the most deprived groups of women. Furthermore, a recent study in the Lancet found the life expectancy gap between the most affluent and most deprived deciles increased between 2001 and 2016 for both men (from 9.0 years to 9.7 years) and women (6.1 years to 7.9 years).
Infant mortality is mentioned only once in the new plan: “Stopping smoking before or during pregnancy is the biggest single factor that will reduce infant mortality.” Smoking is unquestionably harmful in pregnancy. However, this unreferenced statement is a grossly inadequate solution to rising infant mortality. Firstly, data from NHS digital show 10.8% of mothers in England were smokers at the time of delivery in 2017-18, down from 15.8% in 2006-7. Smoking is decreasing as infant mortality increases.
Secondly, many other nations are faring better. In the European infant mortality rankings, the UK fell from seventh in 1990 to 19th in 2015. Finally, the repeated concerns from experts that the rise in infant mortality reflected worsening socioeconomic conditions11 were echoed in a recent United Nations report, which says 40% of all UK children are predicted to be living in poverty by 2022.
Role of poverty
Government, and especially the secretary of state for health and social care, need to understand that austerity, poverty, and inequality have greater importance than individual behaviour and choices, and can also greatly affect what choices are available to people. Too much of the responsibility for improving the underlying social determinants of health is placed on directors of public health. Too much reliance now falls on local authority social care, for which funding has failed to keep pace with demand.
Matt Hancock’s plan suggests that individuals making “better choices” would improve life expectancy. The data do not support this view. Smoking rates in the UK are now the lowest on record—15.1% of adults in 2017 were smokers compared with 20.2% in 2011. Undoubtedly further improvements would be welcome, and continued efforts are needed, but smoking statistics are improving, unlike those for life expectancy. Alcohol consumption in the UK also continues to fall: in 2017, 57% of people over 16 years old had drunk alcohol in the past week, compared with 64% in 2007.
The full effect of obesity on life expectancy is unlikely to be seen for some years, and obesity is very unlikely to be the reason life expectancy has stalled since 2011—the proportion of adults who are obese has been stable since 2010, according to the Health Survey for England. Furthermore, attributing obesity to individual choice ignores the complexity of interlinked political and social factors.
Political decisions
The removal of expert led recommendations from David Cameron’s obesity plan is just one example of the power the food industry holds over health policy, as tobacco did (and still does) before it. Attempts to include evidence based interventions, such as limits on advertising to children and junk food promotions, and other industry tariffs, were notably missing from the final obesity policy the government released in 2016, which focused on two things: increasing physical activity and reducing sugar intake. Individual solutions for society-wide problems.
As individual choices are not to blame for worsening UK health outcomes, what is? The recent UN report detailed the groups most affected by austerity—older people, children, women, those living with disabilities, asylum seekers, and migrants.11 Many of these groups have seen their health outcomes worsen. The evidence is becoming indisputable: austerity is linked to worsening mental health and suicide rates, worse child health outcomes, and higher mortality among older people.So why announce another plan focusing on individual behaviour?
The UN report concludes, “The experience of the United Kingdom, especially since 2010, underscores the conclusion that poverty is a political choice.” The current unprecedented worsening in health outcomes—specifically, life expectancy and infant mortality—is also a political choice. Telling individuals to “make better choices” is unlikely to halt the decline. Far greater changes are needed to improve the nation’s health, changes requiring political leadership and policies to support social care and healthcare and to narrow widening inequalities.
Experience in other countries shows that major political change can have almost immediate benefits on life expectancy, as seen in East Germany after reunification. The individually focused “prevention plan” is neither new nor seminal and will do nothing to tackle the deepening health crisis in the UK.
click the link here to access the PDF of this editorial and the BMJ online page with rapid responses
—
Incidentally, should anyone think that the current crisis has been caused by flu, this is what a flu epidemic looks like:
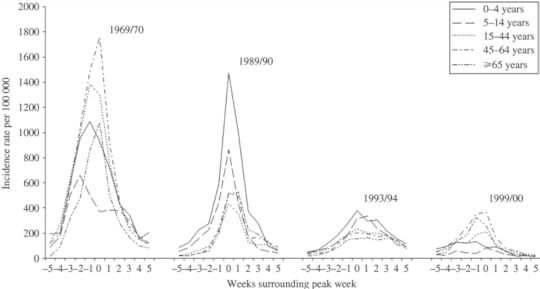
Typical length of time and severity of influenza epidemics in England, 1960-2000
As Sergei Prokofiev once said, “And so, if you are sitting comfortable, and we are relaxed, we can be begin. Once upon a time, early on morning, Peter opened the gate and went out..”
There is nothing to suggest that flu played the key part the current health crisis, other than the guess in one report: “Of these excess respiratory deaths, pneumonia (specifically ICD-10 code J18) and chronic obstructive pulmonary diseases (specifically ICD-10 code J44) accounted for the largest proportions. The prominence of pneumonia is likely related to the relationship between EWM and a range of bacterial and viral respiratory pathogens including influenza.”
Government have been referencing flu as the cause for rising mortality every year since 2012. ONS sometimes say it might be flu and at other times have a line towards the end of their reports say “there were no unusual signs of flu’.
Flu epidemics occur infrequently and effect all of Europe (and the northern hemisphere), not just the UK. At some point we will get a real flu epidemic – but what is happening now is like the story of Peter and the Wolf – we need to know when it is the wolf or if what has just happened is Peter shouting wolf for the seventh time. Incidentally at some point someone will need to assign each player in this story to a different instrument. Flu is the french horns. Sergei explains it here.
For anyone interested in the history of government using flu as an excuse when something else was the cause, the story at the beginning of this article might be of interest.
It was published in February 2014 shortly after the first suggestion of “nothing to see, its just flu.” At some point it will be flu. And again, winter is coming. The BMA has warned the “NHS needs 10,000 extra hospital beds this winter to keep patients safe.” But those beds are not being made available. What happens when finally flu does come? Peter and the Wo
December 4, 2018
The Blank Slate – Toby Young and Social Mobility
It was the night before Christmas, and just a few days before his well-documented fall from grace – in response to the publication of an academic paper Sally Tomlinson and I had published a year earlier, the Conservative government’s advisor, Toby Young, posted this Tweet:
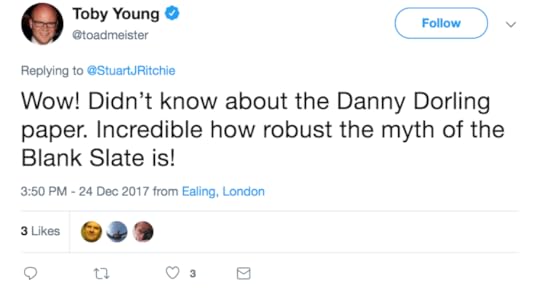
Toby Young’s tweet of December 24th 2017
Toby at the time knew he had been appointed as a Member of the Board of the Office for Students, a post he held from 2 January 2018 to 9 January 2018.
Three people liked his tweet. A few days later Toby was spending his Christmas holidays desperately deleting thousands of his Tweets, but he left this one up, maybe for posterity.
In response to Toby’s tweet the following chapter was submitted and accepted (after some modifications) for publication in: “Move on up? Social mobility, opportunity and equality in the 21st century, London: IPPR, December”
—-
The blank slate is the idea that children are all born alike. They are slates just waiting to be written upon and what they go on to do is almost entirely a product of how they are brought up rather than their inherent nature.
Toby’s argument is that children are born with greatly varying potentials due to their differing genetic endowments. He suggests that only a few can go on to be great and the Toby Young view of social mobility is that education should be used to identify those few who have the potential within them to be hugely able, who have within them the genes for great cleverness. This short article is about why Toby and those who agree with Toby are wrong.
All slates are, of course, different. Blank slates, like newborn babies, may look very similar, but within them the grain always varies slightly. Of course, some babies are male and others female, some are more brown and others pink, but they are all human babies and few people today would try to argue that these different varieties have greatly differing potentials. No two slates are ever exactly identical. The shale they are made from varies. Cut two slates from the very same piece of rock and they will look identical, like identical twins; but, even then, the way they have been cut and how they are later transported will alter them.
Toby didn’t mention my co-author, Sally, but it would have helped him to know that she knows a thing or two about potential and meritocracy. Sally Tomlinson was a very good friend of Toby’s father, Lord Michael Young. She was a Council member of ACE, the Advisory Centre for Education, one of the many organisations started by Michael. She was Chair of ACE in 1993 and a member of Michael’s Education Extra – a Learning from Experience Trust from 1992 to 1999.
Sally often talked with Michael about how one’s children turn out. Michael wrote the 1945 Labour party manifesto ‘Let us Face the Future’ and, in the Guardian on 29 June 2001 Michael Young, under the headline ‘Down with meritocracy’ explained: ‘I have been sadly disappointed by my 1958 book, ‘The rise of the meritocracy’. I coined a word which has gone into general circulation, especially in the USA and most recently found a prominent place in the speeches of Mr Blair. The book was a satire, meant to be a warning … it is good sense to appoint people to jobs on their merit. It is the opposite when those judged to have merit of a particular kind harden into a new social class without room for others. … ‘.
Michael Young continued: ‘a social revolution has been accomplished by harnessing schools and universities to the task of sieving people according the education’s narrow band of values… in the new social environment the rich and powerful have been doing mighty well for themselves. …. General inequality has become more grievous with every year that passes and without a bleat from the party who once spoke up so trenchantly for greater equality’. Michael died in 2002. Were he alive today he would see that the Labour party does not just bleat, but now loudly proclaims the case for greater equality, and not just of opportunity, but of respect, rights and understanding.
In that 2016 article, Sally Tomlinson and I explained how the idea of great inherent differences between children dates back to Plato and his belief in golden children. Plato thought that others, those unlike him, were silver, iron or brass children, destined to be farmers and craftsmen, not philosophers – and that you should ‘breed according to your kind’. We know now that Plato’s guesses were wrong.
The article has since then been greatly expanded into a book: Danny Dorling and Sally Tomlinson (2019) Rule Britannia: From Brexit to the end of Empire, London: Biteback, to be published January 15th 2019.
Sally and I explained in the paper that Toby disliked so much, how the differences between the average level of ability at mathematics between nation-states could not be explained by genes but had to be due to the different nature of their differing societies and educational systems. We went on to show that young adults in the US, UK and Ireland, were worst amongst the citizens of affluent countries at problem solving; whereas those in Sweden, Finland, South Korea and Japan did best. We plotted the home post codes of students who secured a place at Oxford University and suggested these were not the home locations of the special ‘golden children’, but far better reflected wealth. We explained that geneticists know that ‘Genes only matter greatly when everything else matters hardly at all’ and that in 2015 they calculated that ‘raw parent-child correlations in education may reflect one-sixth genetic transmission and five-sixths social inheritance’ . We showed how people like Dominic Cummings believed the very opposite but had been misled. We went on to say a lot more than that, but we suspect Toby read little of it before he Tweeted – perhaps he does not have the genes for diligence?
[To paraphrase from Dr Seuss’s epic tale, The Cat in the Hat, ‘Sally and I did not know what to say. Should we tell Toby, the things that we now know today?’ – As the good Dr said: it is fun to have fun. But you have to know how. Toby sometimes teases, he may think he pleases, but it is the antithesis]
Only within the last decade have we had access to genome-wide studies. These suggest that our inherent variation in nerdiness only explains up to 3.4% of the differences between people in terms of mathematical ability. In 2010 this research revealed that for measured English ability for children aged 11–14 the genome-wide association is similarly very small, or as the researchers themselves stated: ‘Put another way, these differences approximate to a tenth of that seen across the sexes for performance in English at this age’. We know that nowadays girls tend to be much better than boys, on average, at these particular ages. Children with what appeared to be a special genetic advantage in English had, on average, only a very small greater natural affinity.
We now know that the idea of using an exam at age 11 to try to identify children with such tiny additional traits for nerdiness, is futile. The inherent differences between our children are just too narrow, never mind all the other disadvantages that come from separating children from each other at such an early age into separate schools by ‘ability’ and labelling a few as clever and most as stupid.
If you are older than me, or were unlucky enough to have grown up in an English county that preserved the 11-plus and were forced to take that test, at least you now know that if you failed the test, this tells us almost nothing about your inability. If you passed it, in the vast majority of cases, that was because you were coached, or it was due to your upbringing and social advantages. The testers did not actually discover something special in you. Ignore the IQ score you were given as a child. It is no great measurement of achievement and neither should you treat it as a curse.
Attempting to unlock the hidden potential in children is a futile exercise as almost all children have great potential. And almost all of us are very capable of being stupid. Toby has gone out of his way to help demonstrate this over the course of his long series of careers. There are no golden children. Social mobility cannot be about allowing those with the potential to do best to rise to the top, because that group, the golden children, do not exist.
Social mobility, if it is to serve any useful purpose, has to be about allowing people not to be constrained by circumstance and not to have to follow in the footsteps of their parents. Who would want to constrain the child of a banker to being a banker? How cruel would that be?
I joke! But in a society with low social mobility, those in the wealthiest brackets of that society are almost as limited as those from the poorest backgrounds. This is in their choice of what they might in future do, who they might meet, marry or otherwise pair up with, what jobs they might do and which neighbourhoods they might live in. Both groups are also much more likely to fear and misunderstand each other, especially when compared to people who have had the good fortune to grow up in more economically equitable and hence more socially mobile societies.
Education matters. The education system in Germany actually reduces social mobility a little in that otherwise much more equitable country. In contrast, at least as of the year 2008 when the data used in the graphic below was collected, the comprehensive education school system that covered most of the UK slightly reduced the otherwise very high levels of social immobility that come with living in such an economically unequal country as is the UK (see Figure 1). The UK has the widest income inequalities of any large country in Europe – on a par with Russia (which has a land mass that is mainly not in Europe).
Economic inequality matters far more than education when it comes to determining levels of social mobility. In countries with very wide income inequalities, most parents at the top try desperately and constantly to ensure that their children will not drop out of their wealth bracket. This is entirely understandable. Most will do almost everything they can to ensure that their own children will not be trying to get by on two or three times less than they had. However, in doing this, they cut off the rungs of the ladders that other might have climbed.
Figure 1: Social/Education Mobility and Inequality

Social Mobility verses Educational Mobility and Inequality
Source: https://www.socialeurope.eu/angles-sa...
The unfair advantage
Genetic information is very useful. It can be used to discover that, regardless of any inherent cognitive ability, higher ability children from disadvantaged backgrounds are disproportionately less likely to attain good grades at examinations in the UK, compared to children from more socially advantaged backgrounds. In addition, systems operate to add to this inequality as children in fee-paying secondary schools outperform their state secondary school counterparts regardless of ability (both the small amount that is inherent and all that later attained).
Furthermore, we can use genetic information to discover that it does not make sense to try to judge which teachers are doing better than others through the use of so-called ‘value-added measures’. We find that genetic endowment does appear to contribute a small amount to value-added measures that additionally control for background characteristics. In other words, we find that some children may be more receptive, more easy to teach, than others. Furthermore, we find that ‘value-added measures built from teacher rated ability have higher heritability than those built from exam scores’. In others words, the genes of children can be used to predict what teachers think of their ability much more than any actual ability each child has. As yet, we do not know why this is. It could be that teachers are biased towards thinking that children who look a certain way, or who are more subservient and less cheeky, or a myriad of other possibilities – are more clever. At present we just know it is this way.
Everything is effected by our genes. If all else is made equal then genes become all that matters. For instance, in a world without tobacco, genes would be key to determining who dies of lung cancer. When it comes to who benefits from potentially good or bad teaching, it is hardly surprising that some children might better soak up conventional classroom teaching and some might be more resilient to such an environment than others, but taught in another less conventional way other groups of children might prosper better. Some children are more compliant, so trying to measure value-added has problems that can only be revealed by genome-wide analysis. We, in the UK, would do much better to teach more like they do in Finland, and try to measure both pupils and teachers less. The measurements can be greatly biased.
In a summary of this very recent work, two of its authors explained that ‘our results demonstrate that some value-added measures may not be robust to genetic differences between students, particularly when calculated from teacher-reported ability’. You can think of this (if it helps) as the ‘pretty nose’ effect – one of the huge number of possible ways in which genes may interact with valued-added measures. Teachers say that – nose shape being genetically influenced – a child with a prettier nose is more able. We know form a huge amount of research that white teachers often underestimate the ability of black pupils when asked to assess them, the pupils almost always doing better in actual examinations (on average) than predicted. Given such an obvious finding, there must be a huge number of other far less obvious implicit biases at play effecting everything from the outcomes of all job interviews, to who receives attention first when two students put up their hands at the same time.
Children are not blank slates, but they are so close to being so when it comes to their capacity to learn and be influenced that we would do well to treat them as such. Ironically the most recent study to help reveal this is one in which Toby Young himself was an author. In a paper published on 23 March 2018, Toby Young and his colleagues suggested that ‘We found substantial mean genetic differences between students of different school types: students in non-selective schools had lower EduYears GPS compared to those in grammar (d = 0.41) and private schools (d = 0.37).’
In other words, they were saying that they thought they had found that children who attended private schools in England were simply genetically more able, advantaged from birth in a way that could not be modified. What Toby and his colleagues appeared not to have realised, was that the key qualification for attending a private school is that your parents are wealthy enough to be able to pay the fees. Some private schools have entrance tests, but an equal (and in many ways opposite) number do not. Those private schools largely exist to take the children of the affluent who fail such tests. Whatever the ‘EduYear genome-wide polygenic score (GPS)’ Toby and his colleagues were measuring was, it was not about being especially smart or quick or clever. It is possible it might be associated with being acquisitive. The one thing the parents of these children tended to have in common was that they had acquired greater wealth and income than most other people.
The most interesting part of Toby Young and his colleagues’ 2018 paper was in the supplementary material which is available online. In the supplementary material the authors report that they found no genetic disadvantage associated with attending a secondary modern school in those counties of England that still have such schools. In other words, whatever they have found, it is not about any genes to do with being worse at passing the 11-plus.
None of this would matter much if one of the authors of the supplementary material was not listed as Tim Leunig, the former Chief Scientific Adviser at the Department for Education during Michael Gove’s tenure, and current Scientific Advisor in the Department of the Environment, which Gove now leads. Interestingly Tim’s name did not appear as an author of the main paper alongside Toby’s – but they had been working together on the data. It would be interesting to know why Tim was an author of the supplementary material on this paper, but not the paper itself. I have never seen that happen before with an academic paper, it is not good practise but hopefully is indicates that Tim Leunig, who is a very astute civil servant, may have been having doubts as to the usefulness of going down this particular road of agreeing with Toby Young’s ideas about genes.
Looks (and Prejudice) Matter
Genome-wide analysis has largely rendered twin research obsolete. It suggests that the findings of twin-studies tend to magnify the small actual differences in personality between us that can be attributed to our genes by as much as a factor of ten. However, in 2013 a paper was published that studied twins in a different way. It included twins who were brought up assuming they were identical, but later (genetically) found not to be (they were dizygotic or DZ), and the opposite, twins thought to be not identical, but who technically were (they were monozygotic or MZ).
Those incorrectly thought to be identical, started with very similar birth weights and ended with very similar heights and weights. What was interesting was that the assessment of their academic ability, using the US cumulative high school grade point average, was equally highly correlated as that for twins correctly thought to be identical.
What twin studies often actually reveal is that similarly looking children have similar outcomes in life, especially if they are born at the same time and place (as all twins are). They do not reveal that some people are genetically superior to others in overall ability. But rather that we live in societies that have strong prejudices over how people are treated based simply on looks and first impressions, and on characteristics such as being more extrovert or more impatient. This paper was the first because, as its authors said, ‘we are the first to apply the misclassified twins approach to a recent sample with accurate genetic zygosity information for all twins’.
Until genome-wide analysis became possible, which has only been in very recent years, it was possible to argue that there were gold, silver, iron and brass children and that they needed to be identified and separately educated,. Social mobility was seen as the process of identifying golden children born to brass parents and propelling them upwards. Now we know all that to be deeply flawed rubbish. We are all slates of one kind or another. We are born very blank and incredibly plastic, able to be moulded into a very wide variety of forms. Growing up in a society where this truth is not widely understood is a terrible misfortune. It is time we rectified this particular error. We should thank Toby for his help in all this.
Finally, we should remember that because of Britain’s unique history and remarkable class divides, a strong eugenic streak runs through every political party, including the Labour party. The original Clause IV of the Labour party, drafted in 1917 and accepted in 1918, began with the words: ‘To secure for the workers by hand or by brain the full fruits of their industry…’. It thus included a eugenic distinction between two types of worker, which was hardly surprising as Sidney Webb, its author, was known to be a eugenicist, as were so many leading thinkers of that time. However, that tradition was not altered by Tony Blair when his new clause IV was adopted in 1995 with its promise ‘to create for each of us the means to realise our true potential’. We now know just how little those true potentials vary and thus that a concern about variance in potential is unfounded. When that clause comes to be rewritten again, whenever that is, it will be rewritten in the light of what we now know, and all that we are about to learn, about the incredible potential to be found in almost all of us to be so much better than we currently are, when set free from today’s constraints and prejudices. The implications for social mobility, for patrician politics, for elite universities, and for society as a whole are profound. We now know that there are not just a few among us who have within them the true potential to be truly great, to be great leaders, steering society with their great minds. We should aim for a society that allows the greatest number to contribute and participate, that would be real social mobility – for the many – not social mobility merely for a few.
For a PDF of this article as submitted and a link to the version as published don-line click here.
Endnote: I don’t wish to be mean to Toby. I do believe he has the potential within him to come round to another way of thinking. I’ll end with the immortal words of Dr Seuss (from Oh! The Places You’ll Go!):
You have brains in your head.
You have feet in your shoes.
You can steer yourself
any direction you choose.
You’re on your own.
And you know what you know.
And YOU are the one who’ll decide where to go
Sometimes, just sometimes, its worth going back to school:
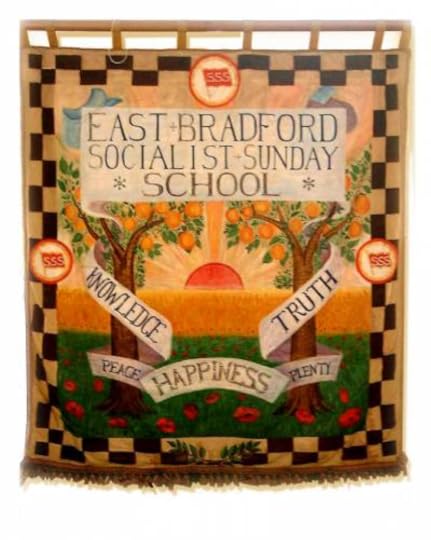
East Bradford Socialist Sunday School
December 3, 2018
Geography and Climate Breakdown
Geography and Climate Breakdown, by Danny Dorling, The Oxford Magazine, No. 402 pp.11-12, November 30th, (eight week, Michaelmas term)
Geographers are able to combine complex statistical data analysis with a human sense of real problems in the here and now. Geographers have a sense of the practical and the immediate. And they are adaptable. Their academic subject has transformed completely in the space of just one hundred years.
Geography was founded as a discipline in Oxford to teach young men what they needed to know to both run and expand the British Empire. That is why the chaps had to know all about maps, rivers, where different crops came from, how cities could be managed and whole peoples subjugated. With the demise of the Empire the discipline needed a new focus.
When I was a schoolboy physical geographers taught me that the next ice age was coming. It was coming imminently they said. When I was at university they used to climb mountains to measure glacier advancement, and were shocked to find that the glaciers were retreating – we forget how recently the large majority of us learnt that the ice age was not then just beginning – what only a tiny number suspected in the more distant past.
When the almost certain inevitability of disaster is finally realised by elites then, and only then, is action taken. It takes the work of millions of others to convince those elites. The folly of holding nuclear weapons was understood before 1945, but it took 40 years to begin to disarm the world of nuclear weapons. Now, almost ninety percent of what were held in 1985 are gone. Enough remain to annihilate us many times over. But this reduction shows what is possible.
Human geography can find many lessons from many places of how often change is generational. The next generation can behave remarkably differently from the last.
Stan Openshaw, my PhD supervisor in Newcastle University, was among the first to calculate that as many as thirty million people would be dead or dying within weeks of a nuclear attack. Until those calculations were published the British government was still quietly planning for a survivable nuclear war. Soon after publication they secretly decommissioned the vast majority of Britain’s bunkers in the early 1990s.
Old problems never go away, they are just superseded by new fears and even greater potential threats.
Thanks to yet more careful current calculations we now know the top 10% of people by income pollute the atmosphere dramatically more than the rest. We also now know that in countries with more equitable income distributions everyone, including the rich, behave far better and consume and pollute far less. Reducing economic inequality is key to facing up to climate breakdown.
If everyone in the world behaved as they behave in the USA, we would need four planets. If we all behaved like Japan we would need two. Still one planet too many, but dramatically different. By far the fastest way to reduce carbon pollution is to reduce income inequality. Income inequality is now falling in more countries than it is rising, including in the majority of OECD countries. The international peak of income inequality worldwide was reached in 2013.
There is so much to be done. The vast majority of people in the world who need to be convinced to eat no, or less, meat live in just a few affluent countries: mostly in the USA, Europe and China. There are almost no vegetarians in China now. But within a generation revolution is possible. The Chinese know this far better than the British (who have never been very good at revolution). We are very fortunate that meat is not very good for any of us to eat. But we only recently learnt that too.
Where countries fi nd themselves now is often a product of circumstance and past activism. To know what is possible Geographers can highlight the best and worst examples to be observed and studied. The United Provinces, part of what is today the Netherlands, were one of the richest places on earth before the rise of the British Empire. Take a look at what the Netherlands achieves now when it comes to green transport, and how inadvisable it is to try to emulate the economics and politics of the USA (figure below):
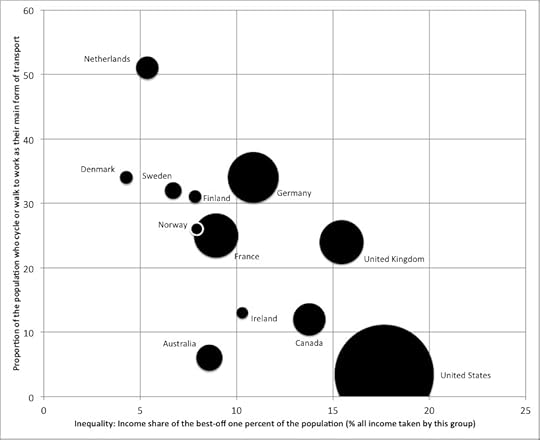
Proportion of people waking or cycling as their main means of travel. Note: Each circle is a country drawn in proportion to its population. Belgium and Austria and not included because they are not in the Paris top income dataset.
Sources: Paris top incomes dataset and Buehler and Pucher (2012).
Within the UK, Oxford is fortunate to have been constrained by a very tight greenbelt. This means that it is now possible, if there is a will, to transform Oxford into the UK’s greenest city, using examples from the Netherlands. Oxford could expand its population and reduce its reliance on cars at the very same time if it built around the edge of the city and reconfigured its transport system towards walking, or cycling and in favour of buses and, eventually, trams. It could be the Freiberg of the British Isles. Freiberg is home to roughly 75,000 more people than Oxford is. It shows how Oxford could expand sustainably.
Alternatively we could support the building of the first quarter segment of the outer M25. Otherwise known as the Oxford-Cambridge ‘expressway’. This is not a terribly hard one to call, but currently the university’s stated position is in favour of the expressway. Clearly human geographers are not working hard enough to help explain why this is such a bad idea. A new train line to Cambridge is fine. A new motorway is folly, it will encourage car dependent building in the countryside and even greater pollution than we have now, out of the urban heat islands.
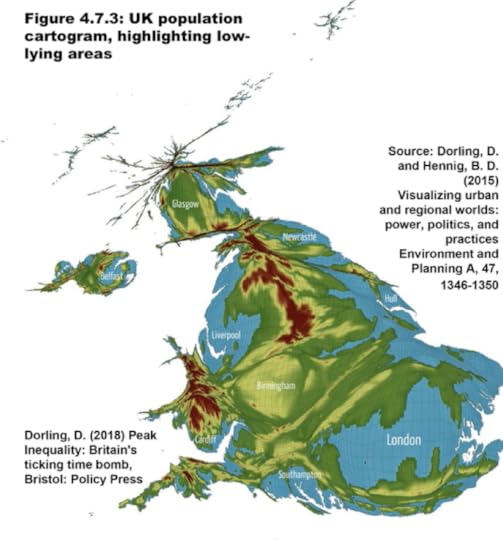
Areas of the most low lying land in the UK – on an equal population map
If you draw a map where area is proportional to people you can see how many people are effected when you then raise the sea level (figure above). You get a very different picture on a human geography map, in place of the traditional physical one you saw at school, where only a few small areas are affected. Sea level rise may only affect a few areas, but a huge number of people live in those areas. The rise might be inevitable, but we can reduce its effects.
For example, it is a good idea to build a flood relief channel to the west of the Oxford city centre, as we are currently doing, to move water further down the Thames when there is too much flowing into Oxford. But it is also essential that we ensure that the fields further up the Thames and Cherwell catchments are not drained so quickly into those rivers, so that these flood events become rarer. Farmers’ fields need to hold more water when there are downpours, like they used to. If we don’t do this, then once the channel is in operation Abingdon and then Reading will simply flood more.
Later, settlements downriver of Oxford will then get their own flood relief channels and all the water will head at even greater speed and volume towards London, perhaps just at the right time to meet the spring tide coming up the river Thames. Could we have avoided all this if only a few more people had studied geography at university, and so many geographers had not become bankers upon graduation? All this is a long way from rocket-science. And all of it is possible. Oxford could be the greenest city in the UK, even in Europe. It is just a case of knowing your geography.
The illustrations in this article appear in colour in Dorling, D. (2018) Peak Inequality: Britain’s ticking time bomb, Bristol: Policy Press and can also be seen for free here.
Click here for a PDF and link to the Oxford Magazine (where this article originally appeared).
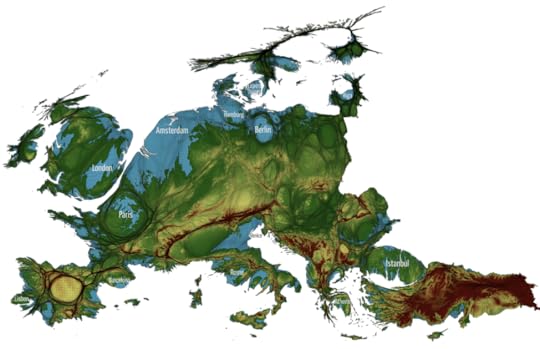
Areas of lowest lying land in Europe – drawn on an equal population map
December 1, 2018
What Brexit tells us about the British
Danny Dorling giving the Institute of Applied Ethics Public Lecture, University of Hull, November 29th 2018, introduced by Colin Tyler.
What Brexit tells us about the British
Whatever kind of Brexit occurs – hard, soft, or even a cancellation and staying in the European Union – the public and especially today’s university students (who mostly had no vote) are going to be asking questions about why this has happened and what it means. A year before this talk was given, extra money had to be found to pay for Brexit in the November 2017 budget than extra that could could be found for the NHS.
In early 2018 there was an unprecedented rise in deaths among elderly people in The UK. On the same day as that budget we also learnt that Britain would lose a place in the International Court of Justice for the first time since the court’s inception in 1946. And then in June 2018 we heard that the NHS would get more funding after all, but far from enough to have a health service as well funded as this in France and Germany.
So what can Geographers tell us about Brexit and what does Brexit tell us about the British?
The arguing and making of claims and counter-claims about Britain’s geographical status that is currently underway will not improve the image of Britain in the eyes of much of the rest of the world’s people. But there is an upside. The British may well learn a great deal about themselves as a result. Not least that Britain, and even Brexit, has its roots in the British Empire.
Traditionally British Geography, a subject that was partly born in this country due to Empire has not been very good at explaining what the Empire was and why it mattered. Brexit may well be the point at which the England finally learn about the importance of geography: from the Irish border through to the modern day priorities of India. And we might also learn that how much we fund our health service is choice that we had all along, one that had nothing to do with whether we were in the European Union or not. It was not being in the EU that was our problem – we, it turns out – were the problem, or at least the few of us that took so much and were so unwilling for the rest to be able to live decent lives.
What Brexit tell us about the British
November 28, 2018
Housing crisis, design feature or design flaw?
Why is the UK so bad at housing people? One reason is that some things, big bulky one-off ‘goods’ like heart surgery, a university degree and a home are very badly allocated when you mostly use the market to allocate them.
The more you use the market, the worse the distribution becomes and the more people eventually end up homeless or very badly housed. Another reasons is that some people lack empathy and do not mind seeing people having to live in the streets very much. A few might even think that it is a useful warning to the majority to work hard and knuckle down. Oxford stop building housing shortly after the 1970s, as the maps below show, but the population kept on rising:
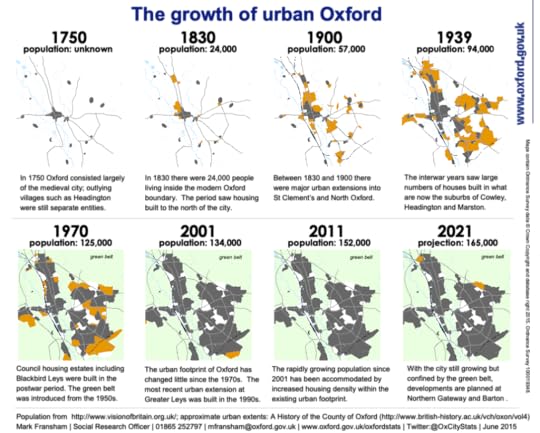
The growth of urban Oxford 1750-2021, new build shown in orange
There are lessons to be learnt from all over Europe, as well as from own past in England, as to how we can house ourselves better. As a student in the 1980s Danny paid £9 a week in rent. He was given a mortgage by a building society to buy a family home in the 1990s when in his twenties, despite having a temporary low paid job. He could write a few books, including on housing, because he had the security to do so, as well as being able to start a family without worrying. There are reasons why such things are not possible now. And there are ways in which we can make them possible again.
In the past we used to plan our cities. The map below is the 1927 ‘circular’ plan for the city of Oxford. Had the green belt been designated later using this circle are far greener city could have been designed, a city based on the bicycle as the main means of transport However, it may well not have happened. But it could happen now. The bike and walking were the main means of transport in 1927 and could be again, although perhaps not by as soon as 2027!

Oxford Regional and Oxford Special Area Town Planing Schemes, 1927
An audio recording is linked to below of a discussion chaired by Lucy Warin (of Transition by Design) in the Open House at Oxford on November 27th 2018.
Danny Dorling (School of Geography and the Environment, University of Oxford) speaks first, followed by Ella Hancock, Sarah Ernst and then a more open debate follows.
Ella Hancock is Senior Best Practice Officer at Crisis UK, and is conducting research exploring affordable cohousing for young people.
Sarah Ernst is an architect working with the Rural Urban Synthesis Society (RUSS), a forward-thinking Community Land Trust to deliver up to 33 self-build homes in Ladywell, Lewisham.
Finally, why do we not have cycle route out to the countryside, away from roads? A city with so many bikes needs routes out, especially for places to go to at the weekends. A few long distance cycle commuters might also like to use routes such as this. They are so much cheaper to build than an ‘expressway’ from Oxford to Cambridge which will use increase car dependence. Expand Oxford by bike, walking, bus, tram and train. Not cars, including driverless cars. Good transport, good sewers, a good water supply and good planning is what lies behind good housing.
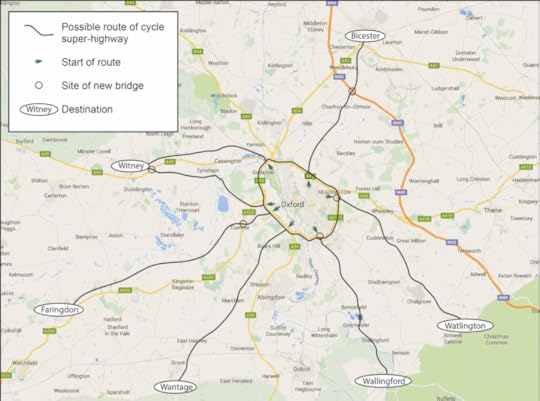
Seven proposed routes for cycle super highways out of the city of Oxford for recreation and some long distance commuting
November 23, 2018
Social Inequality – The Need to Develop Inclusive Housing and Sustainable Communities
A keynote lecture given at the Canadian National Housing Conference, Ottawa, 22 November 2018.
Beginning with Oxford and then moving on to discuss how, as a global city, London is facing social inequality and housing challenges. How to deal with flows of capital disrupting the economy and leading to escalated home prices, highest rents and housing costs for the lowest quality housing in all of Western Europe? All of which now appear to be teetering on the brink of Brexit uncertainty and possibly rapid rather than steady falls. These are challenges that are spilling over into health, education and other societal issues in the UK. The talk ends with a discussion of international differences in approach.

An image from the book ‘Ecotopia 2121’
November 20, 2018
Brexit and Britain’s Radical Right
Two decades ago, leaving the European Union was a minority pursuit. Now British politics is defined by Brexit. Danny Dorling explores how the radical right has grown and why its dreams of reviving Britain’s imperial ambitions are likely to fail.
As the summer headline in the Guardian tried to make clear: ‘Moderate Tories need to understand: the extremists are unappeasable’. You would have thought that moderate Tories would understand their less moderate colleagues better than a liberal Guardian newspaper columnist; however sometimes, when you are too close to someone you have known for many years, it is harder to see the reality of their position. You look for the good in your political party colleagues.
Moderate Tories in Britain have confused the bombastic style of hard Brexiteers as simply reflecting countless evenings practising such peacock behaviour at Oxford, Cambridge or Durham Union debates. Dressed in a dinner jacket and bow tie at Oxford, Jacob Rees Mogg and his chum Boris Johnson may have appeared to be sharp-witted buffoons; but they were practising, practising for the high point of their ever so important lives to be, for the final act, for their moment of triumph. They have been on a mission.
As the first autumn leaf of 2018 fell, Boris Johnson proclaimed that ‘the UK had gone into battle with the white flag fluttering over our leading tank … [and would] throw away most of the advantages of Brexit’. The former Foreign Secretary was arguing for a hard Brexit, for what Jacob Rees Mogg’s father had also long sought.
In 2008, Lord William Rees Mogg, former editor of The Times had claimed that a liberation was coming and those: ‘who will gain most from this liberation [will be] the brightest, most successful and ambitious’ among us, those who can educate and motivate themselves …. Genius will be unleashed, freed from … the oppression of government…’. William died in 2012, but his ideas – these ideas that the English radical right have held dear for so long – live on stronger than ever today.
A rightward shift
The UK’s move to the right was orchestrated. In the 1980s ether were few far-right candidates in European Union elections in the UK and those few who did stand barely scraped together a tenth of a per cent of the total vote. Only one in 1000 voters were voting for parties wanting to leave the EU. However, in the 1990s the far-right vote began to rise with the birth and funding of the Referendum party which in turn was quickly overtaken by Ukip’s growing strength. Economic inequality rose greatly, but most of the woes it caused were wrongly blamed on immigration.
In the 2000s the radical right’s presence in the UK continued to grow. The Conservatives were often part of this shift, especially after 2009 when the Tories left the mainstream group of European Conservative parties in the European Parliament to join the European Conservatives and Reformists, a grouping that includes the far-right Sweden Democrats and the Danish People’s Party. By 2014, the Conservatives were fully engaged with the far-right of mainland Europe in a grouping that was clearly divorced from normal European Conservative behaviour (see Figure 1).
Figure 1 Share of the UK vote for parties to the right of EU mainstream Conservatives, in all European elections 1979-2014
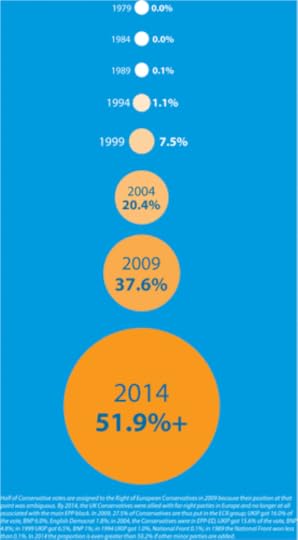
Share of the UK vote for parties to the right of EU mainstream Conservatives, in all European elections 1979-2014
By the 2014 European elections, the writing was on the wall: Ukip topped the polls for the first time in a national election. But the results were generally ignored because turnout was low and we did not think the EU was a very important issue in British politics. That all changed two years later.
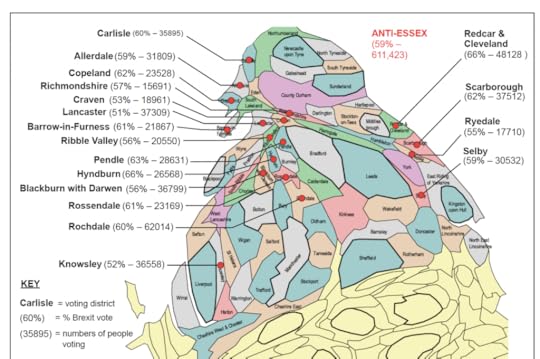
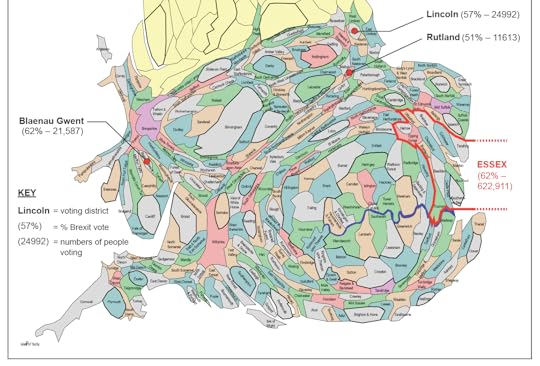
Essex – the capital of Brexit
In June 2016, 51.9 per cent of those who voted chose to leave. Given that this was over two years ago it is still remarkable how little the geography of the EU referendum is understood. One simple single fact may help explain it: More people voted Leave in the county of Essex than in the combined
English and Welsh districts of: Allerdale, Barrow-in-Furness, Blackburn with Darwen, Blaenau Gwent, Carlisle, Cleveland, Craven, Copeland, Hyndburn, Knowsley, Lancaster, Lincoln, Pendle, Redcar, Ribble Valley, Richmondshire, Rochdale, Rossendale, Rutland, Ryedale, Selby and Scarborough.
All of those 22 northern districts and counties also voted out, just as Essex did. Combined they had a larger electorate than the county of Essex. But because turnout in the North was lower, and enthusiasm for Leave was lower, those 21 areas had fewer total leave voters than Essex. The capital of Brexit was Essex. The Leave vote was won in the larger white, middle class commuter county surrounding London. It was won by persuading very large numbers of people in southern-middle England that membership of the EU was terrible for them, their children and their grandchildren.
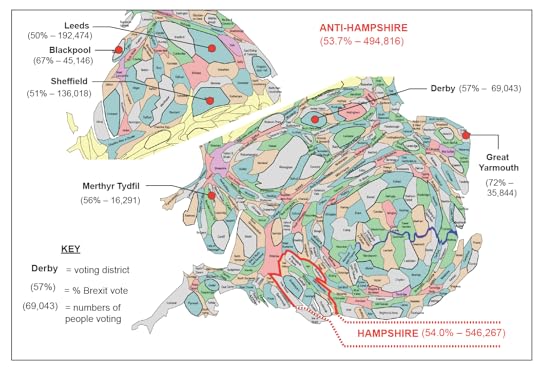
Brexit was made in the Home Counties in the South of England. Here is a second example using a different set of areas. There were more Leave voters in Hampshire alone than in all of the following places combined: Derby, Blackpool, Leeds, Sheffield, Great Yarmouth and Merthyr Tydfil. Again, these seven districts had a higher electorate than Hampshire. They include Britain’s fifth largest city – Sheffield – now known as a key area of Leave. It was presented as a surprise on the night that a city with a Russell Group university should vote out. Hampshire is hardly associated with Leave and yet both a higher proportion and a higher number of people voted to Leave in Hampshire than in these combined northern, Welsh and English East Coastal areas often seen as being synonymous with Leave. How could we have missed that?
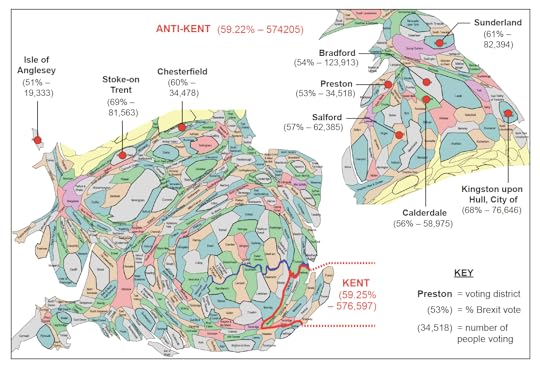
Here is a third example for you, again using a different set of areas – again areas often associated with Leave in the popular imagination. More people voted Leave in Kent, alone, than in all of Anglesey (Ynys Mon), Bradford, Calderdale, Chesterfield, Hull, Preston, Salford, Stoke-on-Trent, and Sunderland combined. You almost never hear of Kent as being a hot bed of Leavers. Why would somewhere that benefits so much from being the closest county to the continental mainland vote to Leave, and yet it did – with far more enthusiasm and effect than those places such as Stoke and Sunderland now so well associated with Brexit.
These lists could be continued to include the remaining eight Home Counties of Bedfordshire, Berkshire, Buckinghamshire, Cambridgeshire, Hertfordshire, Oxfordshire, Surrey, and Sussex. And each of them could be counter-balanced by very long lists of places further away from them that were less enthusiastic centres for Leave.
The cheerleaders for Brexit were a group of young men, including the better known (but still largely in the shadows) Matthew Elliot and Dominic Cummings, and a coterie of less well known cheerleaders from think tanks such as the Adam Smith institute. Others on the political radical right were less enthusiastic but still supported the cause, including Kristian Niemietz and Christopher Snowdon of the Institute for Economic Affairs, a libertarian think tank that views European regulation as meddlesome and the UK as having one of the worst nanny-states among Europe’s many so-called nanny-states. Without Brexit, they could not achieve all that they desire.
What this group had in common was a desire for a survival of the fitness, nastiest, greediest, most-selfish, least-other-wise-concerned-for-others, future. For many in this group, sovereignty meant the freedom not to be interfered with as they, and their masters with the money, went about their personal missions to better-off themselves. A sovereign UK could be their safe space, their treasure island with very low (even almost no) taxation in future. But, in trying so hard to secure this goal and coming so close, they made the very opposite of their dreams much more plausible. Brexit could well break up Britain, but before it does that it could require a great deal more money to be collected in tax to deal with the fall out of trying to leave.
The invention of Britain
Britain is an odd political entity. There are only a very few times I hear the word British used. I often hear it when Unionist politicians from Northern Ireland speak, which is interesting as the North is not part of Great Britain. I hear it from Theresa May who, along with many other Conservative and Unionist politicians, appears quite wedded to the phrase and idea. The only other time I hear it is when people describe themselves as ‘Black British’ (because the phrase ‘Black English’ never caught on). And, of course, it is within the title of the now largely defunct ‘British National Party’.
The idea of Britain was a relatively recent invention. It was created from a marriage of convenience between Scotland and England at the point when it was in the interests of the elites of both countries to work closer together. There was an empire to build and Spanish gold to raid. Britain is really the name of an empire, not a state. As empire has faded, membership of the EU has been helping to keep Britain together.
The British Empire has a certain ring to it, but when that empire finally goes, so will the word British. Some Victorians tried to call Scotland ‘Northern Britain’ – that never caught on either. Britain is a temporary name, borrowed from part of a Roman colony that famously did not extend further north than a wall, the ruins of which run through what is now northern England.
The idea of Britishness is already dying out. It mattered a lot to people like Halford Mackinder. He was a Conservative and Unionist MP, establishing the School of Geography at Oxford to help produce colonial officers, among much else. Brexit accelerates the demise of Britain, which is ironic, as many of those who paid for Brexit, who channelled funds through the Democratic Unionist Party to campaign for it, and who have been working for most of their lives to achieve Brexit, take the idea of a British Union very seriously. Many may hold similar beliefs and have similar motives to Halford. The empire was very important to Halford.
The word ‘Britishness’ is especially odd. Asking someone today what kind of Britishness would you like to see is a little like asking someone in Russia in 1990: ‘What kind of USSRishness would you like to see in future?’ or asking someone earlier from the time of the Ottoman Empire how they would like to see that geographic alliance in future. The word will hold a historical interest in the future, and will have a practical meaning for as long as the Westminster parliament has majority control over all of Great Britain and Northern Ireland. But, increasingly, it looks as if those days are numbered – partly thanks to the Brexiteers’ takeover.
There is no longer an empire to exploit and it’s not coming back. The question is how to achieve an amicable divorce on the British Isles. Brexit, for instance, has taught the English that there is no border in Ireland now. Most never realised that. Brexit has reinforced the understanding of the Scots concerning how duplicitous the English can be. But it is a complete mess, as even London did not want Brexit. It was those living around London who did. Furthermore, without the English retirees living in Wales, Wales would not have voted majority out. These are a very divided set of Isles.
Right-wing take over
Jacob Rees Mogg has one of the most unusual backgrounds. He grew up in the Rees Mogg family castle and from there, via prep school, and a second home in Smith Square, he went up to Eton and up again to Trinity – still today ranked one of the least progressive of all Oxford colleges. Rees Mogg’s upbringing was almost completely atypical but it was very similar to his dad’s early experiences in life, and those of Boris Johnson.
One reason the Home Counties are thought to be called ‘home’ is that they were where that cottage in the countryside was located, with roses around the door, that you would eventually retire to after a lifetime spent avoiding the worst of Malaria and subduing the natives. It was where you came home to from the Empire. But the Empire is not returning. Brexit will not bring it back, and the British are quickly learning so much more about themselves than they ever knew.
Danny Dorling is Professor of Geography at the University of Oxford.
For a PDF of this article and the journal web page click here.
First published as: Brexit and Britain’s Radical Right on November 6, 2018 in Political Insight,
https://doi.org/10.1177/2041905818815197
In Focus: The Revival of Two-Party Politics in Britain
Benjamin D. Hennig and Danny Dorling plot the re-emergence of Conservative and Labour dominance in British politics:
Until recently, there was much talk that the two-party system of British politics was broken, possibly forever. In 2015, just two-thirds of the electorate voted Conservative or Labour. But in the 2017 General Election, the two major parties won over 82 per cent of the vote between them.
The return of the two party model has come at a time of great political turbulence in Britain. Although a Conservative party leader has occupied 10 Downing Street since 2010, their political power and approval within the British electorate has neither at any point been strong nor stable over the last eight years.
This analysis looks at the monthly polling data of all major political parties since May 2010 until the end of September 2018. (UKIP’s polling data covers dates from March 2012, the Green Party from June 2012 as it was only from then that voting intentions for these parties were both routinely asked.) Below, each circular dot is the simple arithmetic average of all publicly reported opinion polls taken in that month in the UK. The average level of support as a proportion of all those who say they have a political preference is shown on the y-axis of the graphs, and is plotted against the rate of change in that support shown on the x-axis.
The most recent data appears darkest in each graph, while the colours slowly fade the further back the dots go in time. This allows us to show the dynamic nature of the intended voting behaviour revealed by the electorate in polls in a way that concentrates attention on what matters most of all in politics: change.
On the bigger picture, the graphs show the temporary points of stability around which public opinion appears to oscillate until something big happens and that collective opinion is jolted in another direction, at which point it appears to try and settle down again. When looking at polling drawn in this kind of way it appears as if the voting public are enacting the collective machinations of a hive mind, coming to a settled view for a time before a chunk of voters or potential voters break away, change their minds, and then opinion settles again for a few months or even years around what appears to be a fixed level of support with only little change.
Within the time period shown here the most momentous change related to Britain’s current political situation is mirrored in the changing support for UKIP. UKIP hit their maximum near 17 per cent support in June 2016 – exactly at the point of the EU referendum. As of September 2018, their support was at five per cent and falling. Their big fall in support from March to May 2017 was when the Conservative vote share rose. UKIP votes went mostly to the Tories in the run up to the general election. Some 90 per cent of UKIP voters have been revealed by surveys to be Conservative supporters that were lured by UKIP’s single policy issue. The belief that it was Labour that had lost support to UKIP and which could gain from recruiting their supporters turns out to have been unfounded. The same was true of the National Front (NF) in the late 1970s who saw their vote collapse into the Conservative win of 1979, which was bolstered by NF voters. The British National Party (BNP) played a similar role of weaning votes most away from the Conservative party which then mostly returned to that party at various points between 2001 and 2010.
The Conservative graph shows that there were three key periods when their show in the polls hovered around 36 per cent; then 32 per cent; then 40 per cent. After a brief but insufficient rise in spring 2017, the Tory vote has dropped back nearer or just below the 40 per cent level.
The Labour surge in the run up to the last General Election, from April to June 2017 reveals a shift in public opinion at a speed and of an extent that has never happened before so quickly for any party – ever. Today, Labour hover at around 38 per cent. For Labour to win a possible upcoming election would require that election being held at a time coincident with a sympathetic trajectory of these phase-space curves. While the party has demonstrated before that such a substantial swing is possible from much lower levels of support in the opinion polls, we have no idea whether Labour could do this again, so quickly, from the higher base of 38 per cent that they now oscillate around.
If Labour cannot achieve a similar swing in future then they could well rely on the SNP to form a coalition (we have no space here to show the trajectories of SNP voting or other smaller parties). The Liberal Democrats as well as the Green Party show much smaller and diminishing dynamics in the smaller graphs shown here. The Liberal Democrats’ most important change is happening right at the beginning of this data series when support for them fell substantially with the shock of that party forming a coalition with the Conservatives. They have never recovered from that. The Green Party graph shows a brief relative rise in the polls, starting in late 2014 and continuing into 2015, before dropping down to their current three-four per cent levels.
Both changes of these smaller parties, and the decline of UKIP, show how brief the period was during which the electorate seemed to have abandoned the two-party political system; at least brief for now. Despite being sometimes more strongly opinionated against (or for) Brexit, the smaller parties no longer benefit from these divisions. The electorate has turned back to supporting either of the two largest parties. The Brexit decision, coupled with the reality of first-past-the-post’s limited options, have contributed to a revival of the two-party politics in Westminster politics – for now at least. Finally, it is worth noting that the opinion polls tend to lag the actual election outcomes of 2010 and 2015. When asked how they might vote if an election was held tomorrow, people on average replied as if asked how they might have voted had an election be held six weeks ago!
Benjamin D. Hennig is an Associate Professor in Geography at the University of Iceland and an Honorary Research Associate at the University of Oxford.
Danny Dorling is the Halford Mackinder Professor in Geography in the School of Geography and the Environment at the University of Oxford.
As supplied for In Focus: The Revival of Two-Party Politics in Britain, Political Insight, First Published November 6, 2018 https://doi.org/10.1177/2041905818815193
For a PDF of this article and link to journal webpage click here.
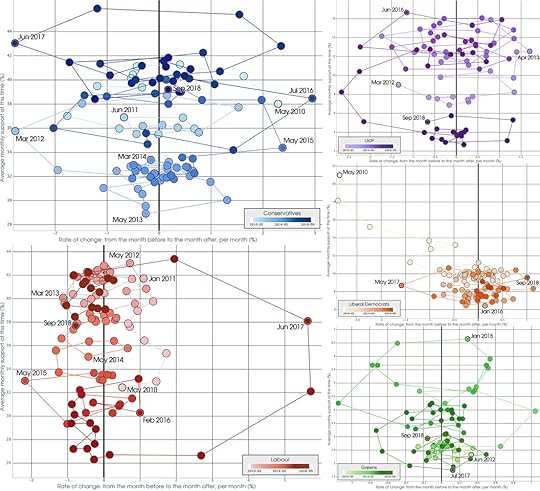
The swings in eth voite for major and minor UK political parties, May 2010 to September 2018
Danny Dorling's Blog

- Danny Dorling's profile
- 96 followers

