
Danny Dorling's Blog, page 31
February 19, 2018
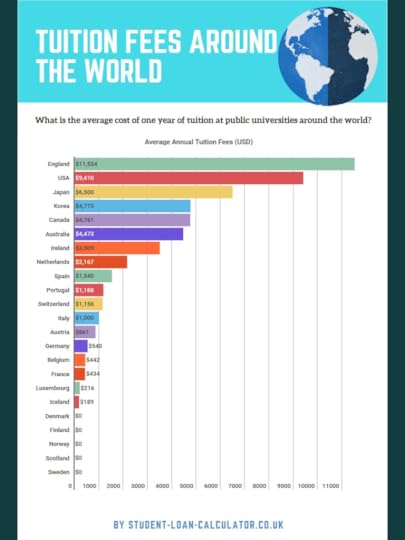
UK Higher Education: Botched loan privatisations and the highest fees in the world
As Brexit looms closer, various schemes for Britain to “find new markets” will be touted. One approach will be to suggest that because our higher education is the most expensive in the world, that means that (in the immortal words of Tina Turner) it must also be “simply the best, better than all the rest“. We once said the same about our banks.
Putting too many eggs in one basket is unwise. Claiming that something must be good because it is expensive is dangerous. Suddenly making it very expensive overnight, as occurred when fees tripled from £3,000 to £9,000 a year and then suggesting that the price reflects sudden new found quality assumes that you are aiming your marketing at some very stupid people who do not understand when they are being conned.
The raising of fees might be ever so slightly defendable, as a short-term fix for when the global financial crisis hit. It prevented mass redundancies in universities. But as a long-term strategy, it moved English higher education closer to becoming a finishing school for the less discerning and less able of the world’s very richest children. For these children, as Tina Turner also said (in Simply the Best), we can provide: “a lifetime of promises and a world of dreams“.


February 15, 2018
Utopia for Realists and How We Can Get There
Utopia for Realists ends with its author professing admiration for Friedrich Hayek and Milton Friedman. Not necessarily admiration for many of their ideas, but for their dogged determination and for the weeks of travel undertaken by some of Hayek’s inaugural Mont Pèlerin Society to reach that small Swiss village in April 1947. There they began to plan for small government and, as it turns out, gross economic inequality.
Bregman repeats Friedman’s story that, when the 1973 oil crisis hit, it was only that quarter of a century of planning in Pèlerin that allowed his and Hayek’s ideas to become the new foundation of US and UK politics. Bregman complains that with Great Financial Crisis in 2008 ‘…there were no real alternatives to hand. No one had laid the groundwork.’ But nine years after that crash, how can he know?
In 1982, nine years after 1973, it was far from obvious that the shift to the right would last so long. Margaret Thatcher had labelled poverty a ‘personality defect’. Her government looked weak as unemployment soared over three million. Ronald Reagan (who also pathologised the poor) presided over unemployment exceeding nine million in the States that year, the worse since the 1930s depression.
The Hayek-Friedman-Thatcher-Reagan version of individualist selfish Utopia looked to be failing, but for a time they achieved it, with the eventual fallout of Brexit and Trump long after all their deaths. In 2017, nine years after the 2008 crash, or even early 2018, it is still too early to tell how, in the future, we will write the history of now and who is actually winning the long-term arguments rather than the short-term elections.
Bregman explains that bankers make money without creating anything of value. He explains that this is not easy, otherwise many more people would do it, but that just because it is difficult does not make it valuable. In saying this he is joining what is now a great choir of similar voices – a choir far too large to fit in Mont Pèlerin.
For the full book review see here. And to hear and audio recording of a conversation with the author click below:
February 6, 2018
Brexit: The result of rising inequality, not rising immigration
Immigration has been suggested as the reason for why a narrow majority of people in the UK voted for Brexit. The concept was used to stoke up fear in areas of low immigration. However, immigration is not what sets the UK apart from other EU nations as unusual. The real reason for the Brexit vote was widespread and rising dissatisfaction with living standards as a result of rising inequalities.
The video below is a discussion that followed a talk which concentrated on that dissatisfaction and also discussed the first signs of a possible fall in economic inequality. Ironically economic inequality may now be beginning to fall possibly partly as a consequence of the Brexit vote. As the pound fell immediately after the referendum result it became harder for those with money in 2016 to go on holiday abroad. They became poorer on the international stage. As the housing market in London then began to stutter in 2017 landlords who owned houses and those with mortgages or the few very well-off people that owned out-right in the South East of England also became a little less well-off. There was no ‘greater fool’ to sell to any more. No one was happier, but it is possible that peak economic inequality had been reached. By February 2018 share prices were falling. On February 6th 2018 the head of research and trading at London Capital Group was quoted as saying: “The stock market open in the UK and Europe looks about as bad as it can get”
The map below shows that the North of England and Wales was home to remarkably few international migrants before the referendum vote, as few as were then found in most of Eastern Europe:
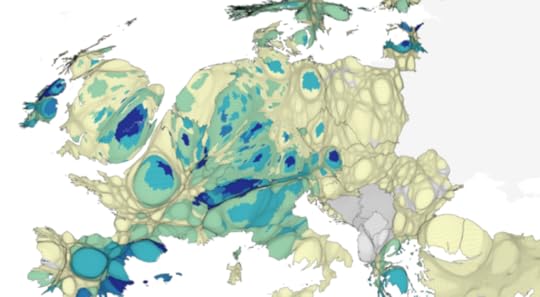
Each region of Europe is shaded by the proportion of the local population born in another country. Deepest blue is more than 20%
Danny Dorling and Daren Smith discuss: “Brexit: The result of rising inequality, not rising immigration”. A lecture given at the university of Loughborough in December 2017, discussion uploaded February 6th 2018.
January 28, 2018
130,000 children homeless after Christmas 2017. Why?
Our housing system is in a mess. A child looking down from the window of a tower block on to Britain’s streets today will see the widest and clearest picture of what is getting rapidly worse. That child will also, most likely, not be white.
We have known since 2005 that most children growing up in the tower blocks of Britain – the majority of children ‘living in the sky’ in Britain – are a member of an ethnic minority.
The number of people officially recorded as sleeping on the streets of England rose from 1,768 in 2010 to 4,134 in 2016 and then 4,751 in 2017, but charities estimate the true figure to be more than double this. The most recent national rise of 15% was the seventh rise in seven years running. Street homelessness has risen every year since the Coalition Government was elected in 2010.
The statistics also show the continued spread of rough sleeping into areas of the south of England. Oxford, Southend-on-Sea, Thanet, Swindon, Medway, Eastbourne, Hastings, Worthing, Peterborough, Reading and Wiltshire all recorded rises in the most recent year of at least double the national average 15% rise.
Homeless families housed by local authorities in temporary accommodation each year have been rising from 50,000 in 2010 to 78,000 in 2017. More than 103,000 children were homeless in the UK at Christmas in 2015, almost all in England. That then rose to 124,000 in 2016. By Christmas 2017 the figure was approaching 130,000 children, all waking up in temporary B&B accommodation on Christmas day.
Furthermore, in London alone there are an estimated 225,000 “hidden homeless” very young people aged 16-25 – arranging their own temporary accommodation with friends or family. Millions more adults and children are in rent arrears and live in fear of becoming homeless. The effect of just the fear on peoples’ health is the equivalent of the effect on your health of losing your job. The health effects of actually becoming homeless are far worse.
Building more homes will not solve the homeless problem or the housing crisis. The problem of inflated prices lies in property speculation.
The direct cause of homelessness rising since 2010 is the rapid and continuous rise in evictions from private sector tenancies where rents have been rapidly increased as landlords increase their profits. Such evictions more than tripled in number between 2010 and 2016.
The much more important indirect cause is that those with the power to stop this do not care enough. Preventing rapidly rising street homelessness, rising numbers of children being without a secure home at Christmas, and a huge increase in people living in fear of losing their home is not hard – unless you believe it is necessary. A large amount of academic work suggests that some politicians think homelessness is an unavoidable necessity.
Hear more:
January 25, 2018
The current state of Inequality
When inequality is high people lose face, they lose confidence, they suffer from comparisons in which it is implied that the vast majority warrant little or no respect. Improvements in life expectancy stall or even reverse, you fear for your children and their future. Life feels like a game of chance with most of the odds heavily stacked against you. Fear divides one from another; loneliness increases, even as we become more crowded in cities. Our greatest fear is other people, and inequality becomes the enemy between us.
Where inequalities have risen the most, the rich are terrified both of becoming poorer and of the poor. The poor and everyone in between cannot believe how much the rich waste. Great economic inequalities rose at the end of both the nineteenth and twentieth centuries as the greedy few took advantage of the confusion created by great social change. This was not because their huge greed was needed, but because it was not well enough understood and so not well enough controlled.
Today the pace of social change is slowing, global populations are stabilizing, and we better understand the pathology of greed. We should not be surprised to see economic inequalities slowly fall. Children aged between 8 and 14 today could live all of their working lives in countries becoming more and more equal, as most of their great-grandparents did. The alternative is catastrophe. But even if that is our fate, most catastrophes end with economic inequalities reducing. None of us can any longer afford the extent of inequality we currently tolerate – and be safe.
This text is an edited abstract taken from the book “Do We Need Economic Inequality?”
The question of where we are heading now, worldwide, was the key global talking point early in 2018:
January 23, 2018
The Future of Britain
Brexit Vote 2016, Hung Parliament 2017, what in 2018? This talk offers some explanations for what has recently happened and suggests that in 2018 we will see falling economic inequality, but not celebrate it. The next step is understanding that we are not going to become the richest large country in the world, despite George Osborne’s 2015 promise. We never were – but we could slowly learn to be more normal, kinder, and more understanding. And then we would then be much better off in terms of what really matters most.
January 15, 2018
On Martin Luther King Day 2018: Child poverty rates still rising in the USA and UK
Fifty years ago Martin Luther King argued that on poverty: “the programs of the past all have another common failing—they are indirect. Each seeks to solve poverty by first solving something else.” He argued for a guaranteed citizen’s income to eradicate poverty.
On January 15th 2018 Jessica Johnson explained that in the USA today: “Our country’s child-poverty rate is 25 percent, the highest among developed nations.” She was writing in the year of the 50th anniversary of the assassination of Martin Luther King. On the same day Steven Thrasher explained that: ‘…modern day Republicans and Democrats often speak as if they love King, even as they excoriate the real heirs to his legacy: the Black Lives Matter activists and other social justice warriors who fight for racial and economic liberation. But the truth is, many of these American politicians would have hated King when he was alive as much as they hypocritically dishonour his radical legacy today.”
Martin Luther King day is the most popular optional national holiday in the USA today.
Child poverty in the USA has been rising, but child poverty in the UK is rising more quickly and is set to overtake the USA in just over two years time when more than a quarter of all British children will be living in poverty.
After housing costs are taken into account that proportion rises to nearer 30%. The graph below shows the trends and was made interactive by Benjamin Hennig:
The graph above shows how quickly the situation can change, for the better (a few years ago) as well as the worse (today). It is taken from the book “Do We Need Economic Inequality?”.
So much is possible in the next fifty years. Including the eradication of child poverty long before 2068. The rising number of children living in poverty today in the most unequal of affluent nations is the result of political choices. The proportion does not rise by accident.
January 10, 2018
Trends in the behaviour of the super-rich: Swiss watch sales
Towards the end of January 2018, 60 heads of state or government, roughly 300 other political leaders, and at least 1000 of the world’s highest paid chief executive officers, media celebrities and the like will meet again at Davos in Switzerland. How are they likely to view changing world events and what might matter most to them?
One measure that is occasionally reported on is the global trend in the sale of Swiss watches. From July 2015 onwards the number of such watches being sold worldwide began to fall relentlessly. The slowdown in the earlier growth of such watch sales had begun very soon after sales growth peaked in March 2010 following the global economic crash. The graph below shows this trend and is taken from the 2018 book “Do We Need Economic Inequality“?
This graph was kindly made interactive by Benjamin Hennig and is one of a set of graphs designed to explore current global issues of inequality. The possibility that we have reached ‘peak inequality‘ is discussed at length in ‘Do We Need Economic Inequality?‘
There are many possible reasons for the decline in Swiss watch sales. The kind of affluent men (and some women) who typically buy Swiss watches might be becoming more aware of what people think of them when they flaunt such a watch. Or they might be becoming a little less affluent and simply not be able to buy as often and as many as they used to. Alternatively, they may be saving their money more because they fear for the future. Or forgeries are now far more convincing. No one can be sure, but something has changed fundamentally in the last few years.
The chart above does not show what has happened since February 2017. The total number of sales worldwide have continued to fall and were three percent lower in the year to November 2017 as compared to the year before. However, the earnings from Swiss watch sales began to rise after March 2017, when the value of the Swiss Franc rose against most other currencies. Geographically, the largest fall in sales of Swiss watches has been in the USA in the last twelve months.
Donald Trump will be visiting Davos this year. He wears his own specially branded ‘Trump watch’. When he looks at it, it tells him his name.
Thirty years ago the BBC joked that Mikey Mouse wore a Dan Quayle watch. That was funnier, but it is less amusing to know that inequalities were rising rapidly then to create what we are living with now. Today, economic inequalities of income are possibly at a peak. They cannot continue to rise forever.
January 9, 2018
What is Radical about Geography?
From the history of the Cold War, to the peril of the 2008 financial crash, what can a radical perspective on geography teach us about the world?
Danny Dorling, one of the editors of the Radical Geography series, recognises the need for a reclamation of geography, from its imperialist past, showing how geographical knowledge and thinking could play a key role in radical social and political activism.
Last year marked the hundredth anniversary of the Russian revolution. Half a century before 1917, radical thinkers had believed that a communist revolution was not possible in a place as ‘backwards’ as Russia. Radicals ignore geography or make presumptions about it at their peril; there is much more to society, categorization and experience than class or intersectionality.
Geography, in its modern-day form, grew out of German, French and British imperialism. It was about justifying exploitation as the supposed natural order and explaining away the hierarchy of races and places. All that bigotry and racism was presented simply as knowledge, knowledge that you had to learn to recite at school. Yet even back then, at the heart and height of the British Empire, there was an awareness of the power that geographical knowledge could unleash.
In 1879 in testimony to a Select Committee of the British Parliament one petitioner was in no doubt about the threat: ‘Geography, sir, is ruinous in its effects on the lower classes. Reading, writing, and arithmetic are comparatively safe, but geography invariably leads to revolution.’ That petitioner may have been over estimating the potential rebellions that would ensue when school children began to be taught what was where and where was what. However, we must not underestimate the power that comes from understanding the present and the future and how everything is connected to everything else, by its very nature geographical knowledge and understanding can be used to oppose the forces that want to maintain the status quo and pacify resistance.
read more on Radical Geography by Danny
or read about: Pit Ponies and Dominoes: Myths of Mining Communities by Stephen Crossley
or We are all Space Invaders now by Paul Routledge
The first three books are:
Making Workers: Radical Geographies of Education by Katharyne Mitchell
In Their Place: The Imagined Geographies of Poverty by Stephen Crossley
Space Invaders: Radical Geographies of Protest by Paul Routledge
The series editors are, Kate Derickson, Associate Professor in Geography at the University of Minnesota
Danny Dorling, Professor of Geography at the University of Oxford
Jenny Pickerill, Professor in Environmental Geography at the University of Sheffield.
New (2018) interactive graphics of the impact of inequality
Researchers have known for some time that high economic inequality has a detrimental effect on peoples’ lives. However, with the release of new data we can now compare all of the richest countries of the world alongside the states of the USA. The results are shocking.
The countries shown here are all the countries of the world for which data on the “income share of the best-off 1%” has been available since the early 1980s. This allows time-lag effects to be investigated. For example, life expectancy is influenced by events that occur over many decades prior to death. The source of the economic inequality data used here is the World Income and Wealth Database.
Each circle below is drawn with its area in proportion to its population. If you click on any circle you can see the name of the country or state of the USA that it represents. Circles are positioned so that the level of inequality back in 1983 is shown by their horizontal position (% taken by the best-off 1%), and the life expectancy of all people in that area 32 years later, in 2015, is shown by their vertical positions (years of life). The relationship is far stronger when all 70 of these countries and US states are compared than can be seen when just the countries on their own, or states on their own, are compared. Those subsets are truncated distributions of the full effect of inequality. The circles below are coloured by the Worldmapper regional colours and the graphics were kindly prepared by Benjamin Hennig.
To explore the relationship between inequality as measured at different points in time and upon other measures of social harm go to the interactive charts page of the book ‘Do we need economic inequality‘
The many mechanisms by which high economic inequality is associated with worse national and state health outcomes are likely to be a large, complex and interacting set. There are many possible and plausible pathways that can be investigated. What is far simpler is to clearly see that there is a strong overall relationship.
Just as with smoking tobacco and lung cancer, we should not wait until we know the precise reasons why something is harmful, and why it has a dose-response relationship with harm, before we begin to curtail our acceptance of it.
For more information on how comparable data for these countries was collected and what is known about the effects of inequality see the Book itself, published in 2018
Danny Dorling's Blog

- Danny Dorling's profile
- 96 followers

