
Danny Dorling's Blog, page 34
September 16, 2017
New ways of seeing the world: a social geographer’s perspective
Oxford Alumni Weekend Lecture, Oxford, September 16th 2017
Geography is the subject that shows you how everything is connected to everything else. This talk begins with new maps of the world stretched to include all of humanity with equal prominence. It then zooms into Europe and considers inequality asking why the UK is so different, before ending with some new views of how the UK may be changing now and what may come of trying to leave the EU.


September 3, 2017
The 2017 UK General Election Result in Three Graphs
There was one noteworthy feature of the 2017 General Election that has not been commented on at all. For the first time since 1979 the segregation index of British Conservative voters fell.
Extract from article published in Public Sector Focus
For the first time since 1979 the segregation index of British Conservative voters fell. The segregation index is the minimum proportion of Conservatives voters who would have to be moved between constituencies if there was to ever be an absolutely uniform distribution of support for that party. That index had reached a historic peak in 2015, beating its last ever-highest record that was held in 1918. At every General Election from 1979 to 2015 support for the Conservative party rose the most in the areas it had already done best in. That almost forty-year trend ended in June 2017. It is not impossible that the 2017 fall in Tory voter segregation is the beginning of a long fall, such as that which occurred from 1918 right through to the 1960s. Or it could just be a blip as occurred after the October 1974 General Election. It is too early to tell, but it is nevertheless remarkable.
There was so much more to see in the June 2017 UK General Election than has yet been described. It is partly because the result itself was so unexpected that we have not yet fully asked what it might mean and what it highlights. One graph that was widely shared around the Internet shortly after the General Election. It showed that under Jeremy Corbyn’s leadership Labour achieved its largest swing as conventionally measured since that of 1945. Arguably the swing was even greater than that of 1945, which occurred over a ten-year period (the previous general election having been held in 1935). This latest swing occurred in just two years.
What happened in 2017 was not really a swing. The Conservative vote did not fall, in fact it rose by 5% to 42% of all those who voted. But the Labour vote rose by almost twice as much, by roughly 10%, to reach 40% of all who voted. Some voters will have swung from Tory to Labour (and a tiny number in the opposite direction), but most of the new Labour votes will have come from people who had voted for other parties in the past or who had not voted, especially from younger voters including those who had never been allowed to vote before because they were too young. The other reason Corbyn did so well is because Blair (in comparison to 1997) had done so badly in 2001 and 2005, Brown did even worse in 2010 and Miliband achieved only a risible positive swing in 2015.
August 23, 2017
Economic inequality: Are we at the turning point?
New statistics offer hope—but the accuracy of such figures is notoriously difficult to assess.
The news hardly made the headlines when it came out earlier this month. On Thursday 3rd August 2017 the High Pay Centre reported that the 100 CEOs of the UK’s highest valued public companies had, on average, seen their pay reduced by 17 per cent in the year to 2016. Now, instead of (again on average) receiving £5.4 million a year they each only took home £4.5 million, almost a million less in just one year, or roughly half a million after paying tax. The average pay of the 25 highest paid UK CEOs dropped by even more, some 24 per cent, so not only were UK CEOs overall being paid less, but inequalities within that group were falling.
The response of the press was lukewarm with the typical headline being “Executive wages may have fallen, but the case for pay ratios is even stronger.” The ratio of average CEO to average employee pay had fallen from 145:1 to 129:1 in a year. It will have to fall by more again and again and again if the UK is to even begin to dream of becoming an averagely unequal affluent country. But that is not impossible, especially if the press remains unimpressed by future falls in top “remuneration.” It happened before from the 1920s through to the early 1970s. And at the start of that period the falls in inequality were not recognised. No one said “well done for being less greedy.”
It is possible that CEO pay falls are temporary or that bosses have found another way of rewarding themselves that is more opaque, but it is equally possible the falls are real and could continue. … read more
This article first appeared on-line in Prospect Magazine on August 23rd. It is an edited and updated extract from the book “The Equality Effect”.
July 4, 2017
Is inequality bad for the environment?
From buying stuff to eating meat to wasting water, there is growing evidence that countries with a bigger gap between rich and poor do more harm to the planet and its climate.
That equality matters in terms of health and happiness has been clear for some years. But it is also better for the environment. The evidence (which is still emerging) suggests the most unequal affluent countries contribute more to climate change via pollution than their more equal counterparts.
The large majority of people living in the most unequal of affluent countries will also suffer more, too – unless national policies change. A new report predicts the United States will actually see its levels of economic inequality increase due to the uneven geographical effects of climate change – resulting in “the largest transfer of wealth from the poor to the rich in the country’s history”, according the study’s lead author.
Read the full Guardian newspaper article here.
It is an edited extract from the book “The Equality Effect”.
June 7, 2017
The Labour party is now more popular than it was when both of the last two general elections were held
This has never happened before. No UK political party has seen such a large and such a rapid rise in support as Labour saw in May 2017. It is unprecedented and it was not predictable.
It was unpredictable, because prediction depends on precedent. The rise was, of course, from a very low base, but that does not make the rise any less surprising. Labour have been very low in the polls before, but they have never risen so fast nor so far up so quickly before in popular support.
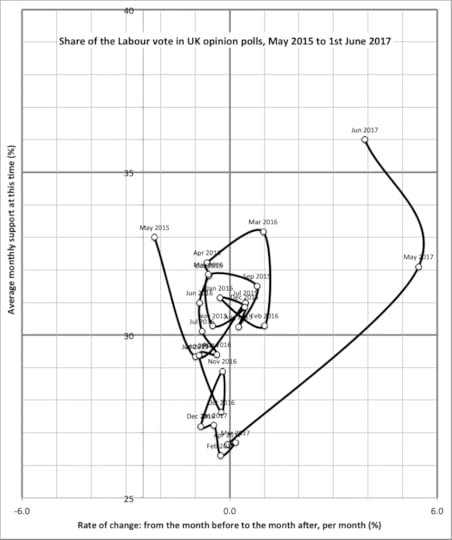
The graph above (and that below) are based on data from the 2,240 polls conducted between May 13th 2010 and June 1st 2017. The monthly average support for the Labour party is shown on the Y axis and the rate of change in that support is shown on the X axis. Polls from before 2010 were taken less frequently (and are not graphed here), but none (when averaged over a month of polls) ever showed a rise as fast as the rise shown above when all the poll results for May 2017 are averaged into a single result, as if they were one very large poll.
Each point in the graph shows average support for Labour in all the polls taken that month. What the graph shows is that from April 2016 to April 2017 support for Labour slowly fell and fell. All that was more than reversed in the rise in May 2017, which continues into June. The final data point on the graph above is based on just the first poll of June, one in which Labour secured 36% support. The party has done better in other polls held after June 1st, but we will have to wait until the end of June to know what its true support was overall that month. And we will have to wait until the end of tomorrow to know how the recent dramatic swings in the polls relate to actual votes. Even after such a rise the polls can underestimate as well as overestimate Labour support. What matters for the general election outcome is the momentum behind the changes we see and if that momentum is continuing this month. If the polls are reflecting a great change in sentiment and a great rise in Labour support that is still continuing, then they will be underestimating the actual outcome in the election held tomorrow.
Two years ago in May 2015 some 33% of voters said they would support the Labour Party if there were an election then. In fact only 29% did support Labour when there was an election in that month. In May 2015 the polls overestimated support for the Labour party by 4%. A month later, in June 2015, the Labour Party’s support had fallen to 29%, bringing the average of the opinion polls down to the same proportion that had actually voted Labour in the general election a few weeks earlier. It was as if people were actually telling pollsters how they would have voted had a general election been held four weeks earlier. The same thing happened five years before in May 2010. The graph below shows how Labour became popular between elections in the recent past, not just before an election, as is happening this time.
The 2010 and 2015 general elections suggested that polls tend to lag behind the actual result. People might be asked what they would do in the future, what they would to tomorrow, but they tend to reply with what they know about – about how they are feeling right now and how they were feeling a short time ago. Nobody can know with complete certainty what they might do tomorrow, how they might feel tomorrow, let alone what everyone else will choose to do. In May 2010 and May 2015 support for the Labour party was falling in the month of that general election, but that could only be seen in hindsight.
Only one thing is certain. What has already happened is unprecedented in British polling history. Before May 2017 monthly averaged support for Labour never rose by as much as 2% in one month. However, most recently the rise did not just break that seemingly impenetrable barrier, it exceeded it three-fold. What was thought impossible becomes possible. What happens next cannot be foretold.

These graphs were published by Danny Dorling at 10am on June 7th 2017. The day before the (first) general election of 2017 was held. They do not include any information from polls published after June 1st 2017, which were, in general even more favourable to the Labour Party. As of today the Labour party is more popular than it was in the two months in which both of the last two general elections were held.
May 19, 2017
The Equality Effect: improving life for everyone
The Equality Effect is almost magical. In more equal countries, human beings are generally happier and healthier, there is less crime, more creativity and higher educational attainment. The evidence is now so overwhelming that it should be changing politics and society all over the world; but progress is held back both by those who would advocate inequality and because people in more economically unequal countries have often become conditioned to accept extreme inequalities as normal.
For the past four decades, many countries, including the US and the UK, have chosen the path to greater inequality on the assumption that there is no alternative. Yet even under globalization, most other nations continue to take a different road. The time will come when The Equality Effect will be as readily accepted as women voting or former colonies gaining independence – and it will come very soon – because as more and more evidence emerges the case for greater economic equality quickly becomes overwhelming. From happiness, to health, to productivity, to awareness of environmental damage, people in more equitable countries live better lives.
There is now a compelling argument for public policy to prioritize equality. Packed with statistics and illustrated throughout by new diagrams, maps and cartoons, The Equality Effect was published on May 18th 2017 by the New Internationalist – a multi-award winning, independent, non-profit media co-operative. Most importantly, the book demonstrates where greater equality is currently to be found and suggests many ways in which we can set “The Equality Effect” in motion. The book provides the first evidence that in a majority of the very richest and very poorest countries in the world today inequalities are now beginning to fall. The effect is underway.
The Equality Effect was launched at a public lecture at the London School of Economics on May 18th 2017. Click the triangular ‘play’ button below for an audio recording of that public lecture:
May 11, 2017
Mortality improvements appear to have stalled in England
Improvements in mortality in England were seen for a generation before the year 2011. They now appear to have ended. On May 4th 2017 the Financial Times reported that the actuaries who determine what future pension payments might need to be, have estimated that £310 billion less will be paid out in UK pensions in the future. This is just from a minority of pensions.
People are expected to live many years less in future than had previously been estimated. Across all of Europe the UK is the only country to have seen no improvement in life expectancy between 2011 and 2015 (the latest year for which comparable European data is available).
Austerity and cuts to health and social services are some of the most obvious reasons for the increased mortality that has already occurred among the elderly in the UK, as well as the projected higher mortality to come for many middle-aged people. High pensioner poverty levels, which have not improved since 2011, is also a very likely culprit. Why should a country that has seen no fall in the proportion of its pensioners living in poverty since 2011 expect to see life expectancy continue to improve?
As the Financial Times reporters explain. It is poorer pensioners who have been harmed the most so far. Private pension scheme members have been somewhat insulated from mortality trends in the wider population. Nevertheless they are also now expected to live shorter lives in future, £310bn shorter.
These new data show that under David Cameron and Theresa May previous falls in mortality rates have come to an end; progress is at its worst since the end of the Second World War. And so far the response from policy makers has been non-existent.
Read more about the stalling and falling life expectancy in an editorial published this week in the BMJ here
The Figure below and a free PDF of the book it is from can be found here

Public Spending in proportion to GDP in twelve rich countries
May 5, 2017
The choices that we make
People in different countries make different choices. In Norway they chose to deal with the financial crash of 2008 in such a way that the population did not suffer unduly and life expectancy there has risen by a year since 2011. In contrast, in the UK there has been no overall rise since 2011 due to increasing mortality among the very elderly. This is one of the many costs of choosing to tolerate high inequality. Static pensioner poverty, rising child poverty, worsening housing rights for more and more people, and rising debts are other costs that keep growing.
On May 4th 2016 it became clear that falls in UK life expectancy are now expected to save £310 billion from future pension payouts, a very large increase on the estimate of £28 billion made for all FTSE 350 companies on March 31st 2017. Those actuarial estimates of future savings being made illustrate the extent of the damage being done in terms of millions of fewer years of life now expected to be lived.
The rich tell themselves a story of there being no alternative. They say that they must be rewarded for their apparently great talents and, if others have less as a result that is just bad luck and that they have not tried hard enough. But most of the rich do not accept the individual luck that was involved in them amassing their wealth. And the very rich, through their influence on newspapers and campaign funding, played a significant part in why the UK so narrowly, but apparently irrecoverably, voted to leave the European Union.
There always is an alternative. In fact there are many, one of which is to be more like Norway. To see what that might result in, and the other alternatives, copies of ‘The Equality Effect’ can be found here or here.
April 9, 2017
Living in extraordinary times
Every so often a social statistic is released that confirms something extraordinary has occurred, something so strange that it cannot continue, suggesting that the trend has to change again soon.
[Original submitted text of article posted on the Telegraph Newspaper Website by Mark Fransham and Danny Dorling]
Often such statistics involve good news stories. The current fall in the infant mortality rate worldwide is so fast that it will soon have to slow down, as the rate cannot become negative. Similarly, a few years ago life expectancy in some of the most affluent parts of the UK was increasing by more than a year in a year. That was also clearly unsustainable, unless people there became immortal.
This year’s impossible-to-carry-on social statistic is found in the rise in private renting in the UK. The rise has now reached such a speed that if it were to continue rising at current rates then within ten years half of all households headed by someone aged under 55 will be renting privately. Within another ten years half of all UK households would be.
The graph shows the proportion of households born in each decade that were renting privately in 2005/6 and also ten years later (according to the most recently released data). The graph reveals that by 2015/16 71% of all households headed up by someone in their twenties or late teens was renting privately. A decade earlier that proportion had been 50%.

For people born in the 1970s, just over a quarter (26%) are now renting privately, exactly the same proportion as ten years earlier for that cohort. There appears to be no escape from ‘generation rent’ even for this older generation. What that statistic means is that the number of people in their late thirties or early forties who managed to get a mortgage in the last ten years have been cancelled out by people of the same age who had to give up buying, who split up and have rented, or who left another tenure to become a private renter.
The statistics for even older people appear to be getting even worse, unless you equate renting privately at older ages with greater freedom. For those who are now aged between 48 and 57 the proportion who head up a household that is privately renting has risen from 12% in 2005/6 to 14% in 2015/16. In short, if you were nearing middle age ten years ago and were not already on the ‘housing ladder’ then you are even less likely to be on it now.
These statistics bear witness to the end of an era – an era in which the older you got, the more likely you were to escape private renting. The trends most recently revealed by the Family Resources Survey, when compared to the same Survey data from a decade earlier, suggest that (on average) there is no longer any escape. Private landlords are buying up such a high proportion of properties that as people in the UK age their chance of not having to rent privately for another year no longer improves. The ‘housing ladder’ is becoming a fiction because, in net terms, as many people have been stepping off the ladder as have stepped on to it.
Why do we know that this cannot continue? That is because the rate of change has been so fast. For the trend to continue most people aged under 40 today should assume that given currently trends they will be renting from a private landlord for the rest of their lives. Within a decade most people aged under 50 should assume they will always rent, then most aged under 60. At the same time over 90% of people in their twenties, then over 90% in their thirties will be privately renting, and at this point the increase has to slow down because it simply is not possible that more than 100% of an age group are in any one tenure.
So can mass private renting be sold to the British? The argument for increasing private renting in the UK was that the rate was below what was usual in many other European countries and having a population that can more easily migrate is good for the economy. In the rest of Europe people have a greater choice over whether to rent or buy. Those who rent have much better security of tenure and enjoy lower rents for higher quality properties. Those who buy elsewhere in Europe do not expect to make the financial gains that homeowners and landlords in the UK have made in recent decades.
As long as house prices continue to rise much faster than wages in the UK the trends shown in the graph above can be expected to continue, regardless of Brexit. The fact that we cannot sensibly expect those trends to continue as they have for much longer may tell us many things. Not least over what we ought to expect to happen to house prices in future. They can only keep rising if we keep moving this quickly towards a mass private renting future.
Read version published on the Telegraph Website April 8th 2017
March 29, 2017
A Better Politics: How Government can make us happier, & despair and hope in Scotland
Politics in Britain and in many other countries would be better if politicians concentrated on the things which are most important to people. The things which are most important to people when you look at their lives and what happens to them and what they say involve their health and their wellbeing and their happiness.
Now it is not often until you get to later on in life, that you get older, that you realize how important things like health are. And how unimportant other things that you might think matter are – the superficial consumption of goods that you think will make you happier turn out to be much less important than those around you and yourself having good health.
If politicians realized that these are things that mattered most to most people, and often not what the politicians thought mattered, or what might matter to the politicians that got them into politics in the first place, then politics could be much better than it is.
In late 2016 we learnt that life expectancy is no longer rising in Scotland. For the first time (outside war-time) since records were published in 1861 life expectancy for both women and men did not rise. After 2012 it appears to stall at 81.1 years for women and 77.1 years for men. This is part of a wider trend seen across the UK, and in the USA, but not in other countries in Europe or elsewhere in the world. There is now mounting evidence of falls in life expectancy taking place for particular groups in our societies. Why have things become worse here?
The talk these words summarise described recent trends in inequality and health in affluent countries and suggest that the UK and USA have become very unusual compared with global trends – with Scotland suffering as a result. There are signs of hope that people in these two, no longer very united, states are now beginning to realise that the growth of inequalities has caused, and is still causing, widespread harm. Signs of hope from elsewhere in the world where inequalities in many other places are much lower and/or falling were also explored.
What is happening in the UK and the USA is the exception, not the norm and that in some ways it is the end of a forty-year experiment to test the supposed benefits of promoting inequality, in which we (and especially people in Scotland) have been the guinea pigs. The experiment is unlikely to end well as those who have most benefited from it seek to preserve as much inequality as they can.”
Danny Dorling is the Halford Mackinder Professor in Geography at the University of Oxford. He was previously a professor of Geography at the University of Sheffield. Danny’s work concerns issues of housing, health, employment, education, wealth and poverty. His recent books include, co-authored texts The Atlas of the Real World: Mapping the way we live, Bankrupt Britain: An atlas of social change, Geography, and People and Places a 21st-century atlas of the UK. Recent sole authored books include All That is Solid in 2014; Injustice: Why social inequalities persist revised in 2015; and A Better Politics: How government can make us happier in 2016
A Better Politics
Danny Dorling's Blog

- Danny Dorling's profile
- 96 followers

