
Nate Silver's Blog, page 72
February 25, 2019
Relievers Have Broken Baseball. We Have A Plan To Fix It.
Earlier this month, Major League Baseball said it was considering a rule change to require pitchers to face at least three batters per appearance — or finish an inning — as part of a series of initiatives to improve the pace of play. I don’t hate this; I’ve always been a fan of relief pitchers working longer outings. But I think the MLB proposal misses the real problem.
The issue isn’t really with relievers who face just one hitter at a time. In fact, LOOGYs — Left-handed One-Out Guys — are already fading in popularity as teams realize that if a pitcher isn’t good enough to face multiple hitters in a row, he may not belong in the bullpen pecking order at all.
Instead, the problem concerns teams that use a parade of relievers who enter the game from the sixth inning onward and throw the hell out of the ball, knowing they’ll probably max out at one inning at a time. (The Yankee bullpen is a prime example.) You might call these pitchers OMGs: One-inning Max-effort Guys. They can be incredibly, game-changingly effective, but they aren’t necessarily all that skilled.
In fact, the whole problem is that OMGs are a renewable resource, with no real constraints on supply. Teams can take failed starters with two decent pitches and, after some weeding out, turn them into OMGs who will strike out 25 or 30 percent of the batters they face, provided they only have to throw one inning every second or third day. It also yields rosters that are grossly imbalanced relative to the amount of value that these relievers generate. According to FanGraphs, relief pitchers accounted for only about 9 percent of the value (in wins above replacement) that all position players and pitchers created last year. And yet, they occupy about 25 percent of roster slots.
And to a larger degree than you probably realize, these OMGs bear responsibility for the ever-increasing rate of strikeouts in baseball — something that was easier to shrug off until MLB attendance started to decline.
More relievers means more strikeouts
Strikeouts have been increasing for more or less the entirety of baseball history. Here’s the trajectory from 19081 up until last year — when, for the first time, more plate appearances ended with strikeouts than with base hits.

There are a couple of peaks marking the end of the Deadball Era in the late 1910s and then another pitchers’ era in the mid-to-late 1960s, but overall the trend is very steady. Over this period, the correlation between the year and the strikeout rate is 0.91.
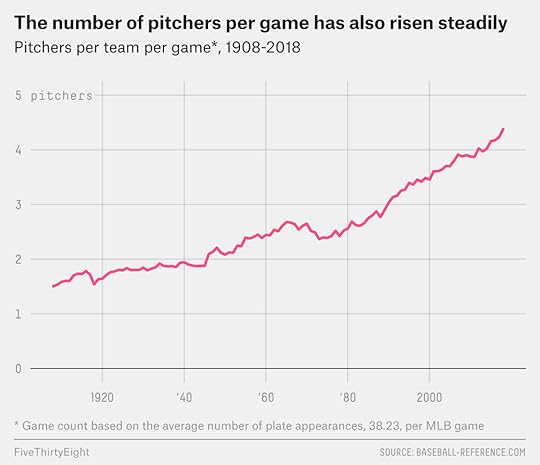
One other baseball trend has been equally if not more relentless, however: As time has passed, teams have relied more and more on their bullpens. As a result, both starting pitchers and relievers have seen increasingly shorter stints. Thus, the number of pitchers per team per game has steadily increased, from 1.4 in 1908 to around 4.4 now.
The correlation is stronger still if you look at the number of pitchers used relative to the number of plate appearances in a typical game.2 For instance, if you take the number of pitchers used per 38 plate appearances3 — over the long run, MLB teams average about 38 plate appearances per game — you get this:
That looks a lot like the previous graph showing the strikeout rate — the correlation is 0.96 — including a dip in both pitchers used and strikeouts at the end of the Deadball Era in the late 1910s and again at the end of the Second Deadball Era in the early 1970s, and then an especially steep acceleration in both strikeouts and pitchers used over the past few years.
It’s not just a coincidence that relief pitcher usage and strikeout rate are correlated in this way. When you take a starter and use him in relief — especially in a short stint that typically lasts only an inning or so — his strikeout rate will be usually be higher, and sometimes a lot higher. You can also expect him to throw harder and to use a more dangerous repertoire consisting of more fastballs and sliders.
Here’s the tale of the tape. Using data from FanGraphs, I looked at all pitchers who worked both as starters and relievers between 2016 and 2018, providing for a direct, head-to-head comparison of how the pitchers performed in each role. These pitchers’ strikeout rates were about 12 percent higher when they came on in relief than when they started. They also threw about a mile per hour harder in relief.4
Starters supercharge their K rate when working in relief
Statistics for MLB pitchers who worked as both starters and relievers, 2016-18
As starter
As reliever
Strikeout rate
18.4%
20.6%
Fastball velocity
91.6 mph
92.5 mph
Share fastballs
54.1%
55.1%
Share sliders
13.9%
15.0%
Observations are weighted by the lesser of the number of batters a pitcher faced as a starter and in relief from 2016 to 2018. For example, a pitcher who threw to 500 batters as a starter and 200 batters as a reliever would receive a weight of 200. Pitchers who averaged fewer than 15 batters faced per start, i.e. who served as “openers” or tandem starters, are excluded from the analysis.
Source: Fangraphs
Those are meaningful gains, but the really big differences come when you use pitchers in short stints that are roughly one inning long. In the next table, I’ve assigned the pitchers who worked both as starters and relievers into three groups: first, those who averaged five or fewer batters faced per relief appearance (these are guys who usually threw just one inning at a time — the OMGs); second, those who averaged more than five but fewer than eight batters faced (a mix of one-inning and multi-inning appearances); and third, those who averaged eight or more batters faced (mostly multi-inning appearances).
It’s much easier to throw an inning at a time
Statistics for MLB pitchers who worked as both starters and relievers, 2016-18, by how many batters faced per relief appearance
Five or fewer batters
As starter
As reliever
Strikeout rate
19.9%
23.9%
Fastball velocity
91.7 mph
93.6 mph
Share fastballs
53.6%
56.9%
Share sliders
17.7%
19.4%
Between five and eight batters
As starter
As reliever
Strikeout rate
18.7%
20.6%
Fastball velocity
91.5 mph
92.3 mph
Share fastballs
53.6%
54.0%
Share sliders
12.6%
13.6%
Eight or more batters
As starter
As reliever
Strikeout rate
16.7%
17.7%
Fastball velocity
91.6 mph
92.2 mph
Share fastballs
55.6%
55.8%
Share sliders
13.4%
13.9%
Observations are weighted by the lesser of the number of batters a pitcher faced as a starter and in relief from 2016 to 2018. For example, a pitcher who threw to 500 batters as a starter and 200 batters as a reliever would receive a weight of 200. Pitchers who averaged fewer than 15 batters faced per start, i.e. who served as “openers” or tandem starters, are excluded from the analysis.
Source: Fangraphs
The first group — the OMGs — got a massive, 20 percent boost to their strikeout rate as relievers. They also gained about 2 mph worth of fastball velocity. And they were able to throw fastballs or sliders — the pitches that seem to be at the core of increasing K rates — 76 percent of the time in relief as compared with 71 percent of the time as starters.
Conversely, the third group — the long relievers who routinely worked multi-inning stints — got only a 6 percent gain in their strikeout rates relative to the ones they had as starters, and they added only 0.6 mph to their fastballs.
LOOGYs aren’t really the problem
The MLB proposal would effectively kill off the LOOGY, along with its much rarer companion, the ROOGY. So it’s worth asking: If relief pitchers are especially effective when they’re limited to only one inning of work, does it follow that they do even better when limited to just one or two hitters? That is to say, could MLB’s proposal to require that pitchers face at least three batters cause an especially large reduction in strikeout rates?
The answer is: not really. If you further break down our sample of pitchers and look at those who threw very short stints in relief,5 they actually had fewer strikeouts than those who averaged around an inning per appearance.6 A lot of this is selection bias: Guys who are brought in to face only one or two hitters at a time are usually mediocre pitchers with big platoon splits. Left-handers who became LOOGYs are generally worse as starting pitchers than the rest of the sample; indeed, they’re quite a bit better in relief than in their starting roles. Nonetheless, they’re not all that effective in relief — much less effective than the OMGs — and because they throw so few innings, they don’t affect the bottom line that much in terms of baseball’s strikeout rate.

And because LOOGYs are fading in popularity, they don’t necessarily contribute all that much to slowing down the game. Of the roughly 16,000 pitching changes in 2018, only about 5,000 occured in the middle of the inning, according to data provided to FiveThirtyEight by David Smith of Retrosheet. These midinning changes are indeed time-consuming — adding about 3 minutes and 15 seconds worth of game time, Smith estimates. (Pitching changes between innings add only about 15 seconds, by contrast.) But they aren’t all that common.
How to bring balance back to bullpens
There’s a better idea than the MLB minimum batters proposal, one that would also speed up the game but that would yield more interesting strategy and — most importantly, from my point of view — cut down on the number of strikeouts, perhaps substantially. The core of my proposal is simple: Each team should be limited to carrying 10 pitchers on its 25-man active roster, plus an Emergency Pitcher.
Like it? Hate it? Well, let me give you some of the details first:
What’s an Emergency Pitcher? He’s a pitcher who could be signed either on a game-by-game basis — in the way that emergency goalies are used in the NHL — or for any length of time up to a full season. The Emergency Pitcher couldn’t be a member of a team’s 40-man roster, although — just for fun — he could be a member of a team’s coaching staff.7 Emergency Pitchers could enter the game only under certain circumstances:
If the starting pitcher left the game because of injury;
If one team led by at least 10 runs;
If it were the 11th inning or later; or
If it were the second game of a doubleheader.
Position players could still pitch, but they wouldn’t be allowed to pitch to a greater number of batters than the number of plate appearances they’d recorded so far on the season as hitters. A backup catcher with 100 plate appearances could face up to 100 batters as a pitcher, for instance (which works out to roughly 20 or 25 innings). With this rule, teams could use position players to pitch on an emergency basis basically whenever they wanted, but they couldn’t designate pitchers as position players just to circumvent the 10-pitcher requirement. Brooks Kieschnick types would need to have their innings and plate appearances monitored carefully.8
After the roster expanded to 40 players in September, minor league call-ups who were not on the 10-pitcher list could start games, subject to a requirement that they threw at least 60 pitches or five innings or — a mercy rule — gave up at least five runs. They could not appear in relief, however.
Relief pitchers, especially the OMGs, aren’t going to like this, so the restrictions could be phased in over several years. For instance, you could start with a 12-pitcher limit beginning in 2020, then ratchet it down to 11 pitchers in 2022 and 10 pitchers in 2024 as teams adapted to the new requirements.
As you can see, the goal here is to be fairly strict: While we want to provide for a bit of flexibility, we mostly want to force teams to stick to the 10 players they designate as pitchers as much as possible. For that matter, we’d probably also want to tighten rules surrounding the and minor-league call-ups, which teams regularly use and abuse to add de facto roster slots — but that’s not a part of this proposal per se.
Toward a new equilibrium
So how would teams use their pitching staffs under these rules? That’s anyone’s guess, and part of the fun would be in seeing the different strategies that teams adopted. But my guess is that the average team would do something like this to fill the roughly 1,450 innings that major league teams pitch in each regular season:
What a 10-man pitching staff might look like
Role
Games Pitched
Games Started
Innings Pitched
Ace starter
34
34
230
No. 2 starter
33
33
210
No. 3 starter
33
33
195
No. 4 starter
32
32
180
No. 5 starter
30
22
150
Long reliever/spot starter
40
3
100
Durable middle reliever
55
0
90
RH set-up
60
0
85
LH set-up
70
0
75
Closer
60
0
80
Role
Games Pitched
Games Started
Innings Pitched
Emergency Pitchers
10
0
20
September call-up starters
5
5
25
Position players
5
0
10
Games Pitched
Games Started
Innings Pitched
Total
467
162
1,450
This strategy envisions that starting pitchers would throw 6.0 innings per start, up from 5.4 innings per start in 2018 but a bit less than the 6.2 innings per start that pitchers averaged in the 1980s. Relievers would average around 1.6 innings per appearance, meanwhile — considerably up from 2018 (1.1 inning per appearance) and about the same as in the 1980s.
Overall, this plan would entail using 2.9 pitchers per team per game, which is close to where baseball was in the late 1980s. But we could balance out the workload more effectively than teams did back then. As you can see in the table, we could get the necessary innings from a 10-man staff without having to ask starters to throw 270 or 280 innings, as ace starters sometimes did in the 1980s, and without having to ask closers to throw 140 innings a year, as sometimes happened too. Starters would have to work through the third time in the order a bit more often, but there would still be plenty of room for discretion on the part of the manager.
The most consequential change would be that we’d cut down on the number of OMG innings. There would still be plenty of them, to be sure. But if you went overboard, it would come with a lot of trade-offs. If a team tried to employ five relievers who each worked 70 appearances of one inning each, for instance, its five starters would have to average about 6.5 innings per start, so they’d be working through the third time in the lineup a lot more often.
And if you did want to use a pitcher to face only one or two batters, you could still do it, but it would be more costly still — with a 10-man pitching staff, someone else is always going to have to pick up the slack.
This would also relieve (pun somewhat intended) the monotony of the OMGs. We wouldn’t be removing any spots from the 25-man roster. (In fact, we’d essentially be adding one for the Emergency Pitcher.) But we’d be requiring at least 15 of them to be used on position players. Pinch runners, pinch hitters, platoon players, defensive replacements and third catchers — all of whom have become endangered species as teams use every marginal roster slot on an OMG — would begin to roam the baseball field freely again.
I’m reluctant to estimate the overall amount by which my rule change would reduce strikeouts or improve pace of play. That’s because baseball strategy is a dynamic system, and our goal is to change teams’ overall attitudes toward pitcher usage. Pitching to contact might become more common again, for instance, as starters would need to throw longer outings. Keep in mind that if starters are only expected to work through the order two or two-and-a-half times, tossing perhaps five or six innings, they can also throw at relatively high effort. So we wouldn’t just be reducing strikeouts by exchanging some OMGs for multi-inning relievers; starters would also have to pace themselves more, too.
But if relief-pitcher usage has as close a relationship with strikeout rates as I think it does, the net effects could be substantial. This rule would essentially roll relief-pitcher usage back to what it was in the late 1980s or early 1990s and could bring strikeouts back toward what they were back then too, when pitchers struck out about 15 percent of the batters they faced instead of the 22 percent they do now.
That’s probably too optimistic; at least some of the increase in strikeout rate undoubtedly has to do with pitchers being bigger and stronger and throwing harder than ever before.9 But some kind of intervention is needed. The OMG-dominated equilibrium of today may be ruthlessly efficient, but it isn’t making for an aesthetically or strategically rewarding form of baseball.


February 21, 2019
How Bernie’s 2020 Map Might Change Without The #NeverHillary Vote
Bernie Sanders picked up support in some unusual places during his 2016 campaign to be the Democratic presidential nominee. The self-described democratic socialist won states such as Oklahoma and Nebraska that are typically associated with right-of-center policy views. He also did surprisingly well with self-described conservative voters — granted, a small-ish part1 of the Democratic primary electorate — picking up almost a third of their votes. Perhaps less surprisingly given that Sanders isn’t technically a Democrat, he performed really well with independent voters, winning them by roughly a 2:1 margin over Hillary Clinton.
So as Sanders launches his 2020 campaign as a candidate with both formidable strengths and serious challenges, his biggest problem might seem to be that there’s more competition for his base this time around, with Massachusetts Sen. Elizabeth Warren and others also competing for the leftmost part of the Democratic electorate. An equally big problem for Sanders, however, is that voters this time around have more alternatives to Hillary Clinton — left, right and center — to choose from.
Roughly one-quarter of Sanders’s support in Democratic primaries and caucuses in 2016 came from #NeverHillary voters: people who didn’t vote for Clinton in the 2016 general election and who had no intention of doing so. (The #NeverHillary label is a little snarky, but it’s also quite literal: These are people who never voted for Clinton despite being given two opportunities to do so, in the primary and the general election.) This finding comes from the Cooperative Congressional Election Study, a poll of more than 50,000 voters conducted by YouGov in conjunction with Harvard University. The CCES asked voters who they voted for in both the primaries and the general election; it also asked voters who didn’t vote in the general election who they would have chosen if they had voted. Here’s the overall breakdown of what Sanders primary voters did in November 2016.2
What Bernie Sanders primary voters did in November 2016
Voted for Hillary Clinton
74.3%
–
Voted for Donald Trump
12.0
–
Voted for Gary Johnson
3.2
–
Voted for Jill Stein
4.5
–
Voted for other candidates or voted but didn’t recall
2.5
–
Didn’t vote but said they would have voted for Clinton
1.6
–
Didn’t vote and didn’t say they would have voted Clinton
1.9
–
Voters in shaded categories are #NeverHillary voters.
Source: COOPERATIVE CONGRESSIONAL ELECTION STUDY
About 74 percent of Sanders’s primary voters also voted for Clinton in November 2016. Another 2 percent didn’t vote but said on the CCES that they would have voted for Clinton if they had voted; it doesn’t seem fair to consider them anti-Clinton voters, so we won’t include them in the #NeverHillary camp. The remaining 24 percent of Sanders voters were #NeverHillary in the general election, however. Of these, about half voted for Trump, while the remaining half voted for Gary Johnson, Jill Stein, another third-party candidate or didn’t vote.3
Overall, Sanders won 43 percent of the popular vote in Democratic primaries and caucuses in 2016. If 24 percent of that 43 percent were #NeverHillary voters, that means Sanders’s real base was more like 33 percent of the overall Democratic electorate. That isn’t nothing — it could easily carry the plurality in a divided field — and there were plenty of Clinton voters who liked Sanders, so he could pick up some of their votes too. But it does jibe with polls showing that Sanders and Warren together have around 30 percent of the Democratic primary electorate in 2020 and not the 43 percent that Sanders got in 2016.
You might be tempted to think that these #NeverHillary voters are leftists who thought Clinton was too much of pro-corporate, warmongering centrist. But relatively few of them were. Less than a fifth of them voted for Stein, for example. Instead, these voters were disproportionately likely to describe themselves as moderate or conservative. Among the 31 percent of self-described conservatives who voted for Sanders in the Democratic primaries, more than half were #NeverHillary voters, for example. A large minority of the independents and Republicans who supported Sanders were #NeverHillary voters as well.
#NeverHillary voters were conservative, not super liberal
The ideological and partisan breakdown of #NeverHillary voters in the 2016 Democratic primaries
Sanders Voters
Group
Clinton
Sanders
Pro-Sanders**
#NeverHillary
Very liberal
45.2%
54.6%
46.9%
7.7%
Liberal
55.6
43.7
39.4
4.3
Somewhat liberal
59.4
40.2
32.7
7.5
Middle-of-the-road
60.2
38.7
24.9
13.8
Conservative*
66.5
31.3
14.9
16.4
Sanders Voters
Group
Clinton
Sanders
Pro-Sanders
#NeverHillary
Democrats
66.2%
32.9%
28.8%
4.1%
Independents and Republicans
33.6
65.0
37.9
27.1
* Includes voters who described themselves as “conservative,” “somewhat conservative” or “very conservative.“
** Sanders voters who voted for Clinton in the general election or didn’t vote but said they would have voted for Clinton.
Source: COOPERATIVE CONGRESSIONAL ELECTION STUDY
A more complicated way to characterize the #NeverHillary vote is via regression analysis. Using the CCES — which permits fairly intricate regression model designs because of its large sample size — I took all of Sanders’s primary voters in 2016 and evaluated a host of variables to see what predicted whether they were #NeverHillary in the general election.
The most significant variables were, first, whether the voter was a Democrat, and second and third, two policy questions that have proven to be highly predictive of voter preferences in the past: whether the voter thinks that white people benefit from their race and whether the voter wanted to repeal the Affordable Care Act. Non-Democrats, voters who didn’t think whites benefited from their race, and voters who wanted to repeal the ACA were much more likely to be #NeverHillary voters. Voters who were rural, poor, who lived in the South or the Northeast, who were born-again Christians, who were conservatives, and who were military veterans were also somewhat more likely to be #NeverHillary, other factors held equal. Black people, Hispanics, women, liberals, millennials, union members and voters with four-year college degrees were less likely to be #NeverHillary voters.
In addition, some factors related to the primary calendar affected the #NeverHillary vote. After Trump won the Indiana primary, effectively wrapping up the Republican nomination, more anti-Clinton voters filtered into the Democratic primaries. And the #NeverHillary vote was lower in states where an open Republican primary or caucus was held on the same date as the Democratic one. This implies that a fair number of #NeverHillary voters would actually have prefered to vote in the Republican primary. But if they couldn’t, because the Republican primary was closed or wasn’t held on the same date, they voted in the Democratic primary (for Sanders or another Democrat and against Clinton) instead.
We can also evaluate the geographic breakdown of the #NeverHillary vote. In each state, we can estimate the anti-Clinton vote in two ways, either by directly measuring it (e.g., 19 percent of Sanders voters the CCES surveyed in Illinois were #NeverHillary) or through the regression technique that I used above (which is similar to an MRP analysis). Without getting too much into the weeds, I used a blend of the two methods in each state based on the sample size of Sanders voters there; the direct measurement is more reliable in states with a large sample, while the regression method is better in states with a smaller one. The table below shows where the largest share of Sanders voters (as well as voters who chose another Democratic candidate apart from Clinton and Sanders4) were anti-Clinton voters:
Sanders benefited from #NeverHillary voters in red states
The breakdown of Sanders and #NeverHillary voters in the 2016 Democratic primaries
#NeverHillary
State
Sanders’s Share of pop. vote
share of Sanders voters who were #NeverHillary
voted sanders
Other
Total
Alaska
79.6%
49.8%
39.7%
0.1%
39.7%
W.Va.
51.4
45.2
23.2
7.1
30.4
Okla.
51.9
42.3
21.9
3.7
25.6
Vt.
86.0
28.3
24.3
0.2
24.5
Idaho
78.0
30.4
23.8
0.4
24.2
Neb.
57.1
42.0
24.0
0.0
24.0
Utah
79.2
29.6
23.4
0.3
23.7
Ky.
46.3
37.9
17.6
3.9
21.4
Ore.
56.2
32.1
18.1
1.0
19.0
R.I.
54.7
32.1
17.6
1.2
18.8
Mont.
51.6
31.8
16.4
2.4
18.8
N.D.
64.2
19.6
12.6
5.7
18.3
Hawaii
69.8
25.9
18.1
0.1
18.2
Maine
64.3
28.0
18.0
0.1
18.1
Kan.
67.7
26.4
17.9
0.0
17.9
N.H.
60.1
27.5
16.6
1.2
17.8
S.D.
49.0
34.8
17.1
0.0
17.1
Nev.
47.3
35.1
16.6
0.0
16.6
Del.
39.2
36.8
14.4
0.6
15.0
Wash.
72.7
19.3
14.0
0.1
14.1
Mo.
49.4
25.8
12.7
0.6
13.3
Md.
33.8
31.4
10.6
2.0
12.7
Mass.
48.5
24.4
11.8
0.9
12.7
La.
23.2
40.8
9.4
3.2
12.6
Calif.
46.0
24.2
11.1
0.5
11.6
Ind.
52.5
22.2
11.6
0.0
11.6
Mich.
49.7
21.1
10.5
1.2
11.6
Pa.
43.5
25.1
10.9
0.5
11.4
Ariz.
41.4
24.2
10.0
1.3
11.3
N.C.
40.9
20.9
8.5
2.6
11.1
Minn.
61.7
17.5
10.8
0.0
10.8
Wis.
56.6
18.6
10.5
0.2
10.7
Conn.
46.4
20.8
9.6
1.0
10.6
N.Y.
42.0
25.1
10.5
0.0
10.5
N.M.
48.5
20.8
10.1
0.0
10.1
Ark.
30.0
23.9
7.2
2.2
9.4
Ill.
48.6
18.4
8.9
0.5
9.4
Fla.
33.3
23.8
7.9
1.3
9.2
N.J.
36.6
24.2
8.8
0.1
9.0
Ohio
43.1
19.5
8.4
0.4
8.8
Tenn.
32.5
22.7
7.4
0.8
8.2
Iowa
49.6
15.4
7.6
0.3
8.0
S.C.
26.0
28.8
7.5
0.3
7.8
Va.
35.2
21.3
7.5
0.3
7.8
Colo.
59.0
11.7
6.9
0.4
7.3
Texas
33.2
19.0
6.3
0.9
7.2
Ala.
19.2
25.5
4.9
1.7
6.5
D.C.
20.8
28.0
5.8
0.4
6.2
Ga.
28.2
19.4
5.5
0.3
5.7
Wyo.
56.7
9.3
5.3
0.1
5.4
Miss.
16.6
14.8
2.5
0.5
3.0
Source: COOPERATIVE CONGRESSIONAL ELECTION STUDY
The largest number of #NeverHillary voters, as a share of the Democratic primary electorate, were in Alaska, West Virginia, Oklahoma, Vermont, Idaho, Nebraska, Utah and Kentucky. Other than in Vermont, where extreme loyalty to Sanders generated a large number of write-in votes for Sanders and other candidates in the general election, those are obviously really red and largely rural states. Apart from Kentucky, they were also all states won by Sanders in the primaries.
Although there may have been something of a market for a populist candidate in these states, it’s also likely that Sanders benefited from being the only alternative to Clinton. In fact, there are several states where the #NeverHillary vote pushed Sanders over the top and where the pro-Sanders vote alone wouldn’t have been enough for him to win. These are Indiana, Michigan, Montana, Nebraska, Oklahoma, Oregon, Rhode Island and West Virginia.

The good news for Sanders is that the states where he benefited the most from the #NeverHillary vote — especially in Appalachia and in the Interior West — have relatively low delegate tallies. So they’re places that he can potentially afford to lose. It does mean, however, that Sanders will have to hit his mark in his other strong regions, including New England (where Warren will provide fierce competition), the Upper Midwest (where Sen. Amy Klobuchar of Minnesota could create problems in her home state and Wisconsin) and the Pacific Northwest (where Sanders would prefer that candidates like Washington Gov. Jay Inslee and former Colorado Gov. John Hickenlooper not enter the race).
It also means that Sanders won’t just be competing against other progressives but also against relatively moderate candidates. If #NeverHillary voters from 2016 are again looking for an anti-establishment candidate, Sanders could still fit the bill. If they want a moderate instead, however, they’ll have a lot more choices than they did in 2016 in the form of candidates like Klobuchar and (if they enter the race) Joe Biden and Beto O’Rourke. It’s also possible that #NeverHillary voters were mostly motivated by sexism, in which case any of the male candidates could stand to benefit.
None of this dooms Sanders by any means. On balance, he probably benefits from a divided field, in fact, wherein his extremely loyal base gives him a high floor of support. But a multi-way race is way different than a two-way one, so Sanders’s coalition may not be all that similar to what we saw in 2016.
From ABC News:
Who Will Be The Obama Of 2020?
Welcome to FiveThirtyEight’s weekly politics chat. The transcript below has been lightly edited.
sarahf (Sarah Frostenson, politics editor): For the last several months, former President Barack Obama has been busy giving advice to 2020 Democratic contenders. He hasn’t endorsed anyone (and may never do so), but who do we think is best positioned to be the next “Obama candidate”? And, more importantly, do we think what worked for Obama in 2008 would work for a 2020 candidate?
julia_azari (Julia Azari, political science professor at Marquette University and FiveThirtyEight contributor): Obama ran in 2008 as (kind of) an outsider but not a populist. But the current crop of candidates isn’t very well-positioned to make outsider claims, as the FiveThirtyEight Politics podcast crew pointed out. Instead, they’re better poised to talk about economic populism.
So that’s a big difference that immediately jumped out to me.
sarahf: Elizabeth Warren and Bernie Sanders are both pushing populist economic policies this cycle. But I’d argue that neither is really in the mold of Obama.
It’s also not clear to me, given that the economy is pretty good right now, how effective a rallying cry it’ll be for 2020. I think there’s an opening for someone like Cory Booker, who’s running on a message of love (which is reminiscent of Obama’s message of hope and change in 2008).
perry (Perry Bacon Jr., senior writer): I tend to think Beto O’Rourke (if he decides to run) and Booker will end up running Obama-like campaigns, appealing to voters with personas as much as their policy agendas. I would put Kamala Harris in this group as well.
Granted, Booker is an insider, not an outsider, but I don’t know how much of an outsider Obama really was — he was a sitting senator in 2008. I do think Booker and Obama share broad themes of trying to unite the country.
O’Rourke also seems to have some of that Obama-like charisma — people are begging him to run for president, but I suspect they don’t know a lot about his record.
natesilver (Nate Silver, editor in chief): Not to interrupt but are we … underestimating how much Obama was about personality rather than policy in 2008? Not that he isn’t a substantive guy. But I’m old enough to remember the 2008 primaries. And there were not a hell of a lot of rigorous debates over policy.
julia_azari: That’s fair, Nate. But it’s complicated. Obama’s bid, especially against Hillary Clinton, was about personality. Not a ton of policy difference there.
But his presidency was a lot of reacting to big issues and problems — the economy, of course, but also the Arab Spring. And police violence against unarmed African-Americans became a major national issue.
So when we ask about Obama’s legacy, are we asking about his 2008 run or his presidency?
sarahf: That’s a good point, Julia. If we look at Obama’s presidency, I’d argue that parts of the Democratic Party don’t want someone who replicates Obama’s more consensus-based approach. Many, especially on the Left, wish he’d gone farther on issues, which is why we’re debating “Medicare-for-all” right now and not, say, how to save the Affordable Care Act.
perry: I think it’s clear that Sanders and Warren are not running in the Obama mold.
They can’t say that — because Obama is so popular among Democrats, and Sanders did not do well in 2016 with black voters, who both love Obama and are an important constituency in the party. But privately, the Sanders supporters I talk to think Obama was a fine but underwhelming president.
natesilver: Publicly, there are a VERY few vocal Bernie supporters who think Obama was a bad president. And it’s probably a minority of Sanders supporters who think that, but it’s still out there.
julia_azari: So I was thinking about this when I read Nate’s piece about the “five corners” of the Democratic primary. The piece is right that Obama won with black voters, Latino voters and young voters — and that the Left didn’t really have a candidate in 2008. But I am also not sure the Left was even a thing in 2008.
It really took Warren, Sanders and the Occupy movement, along with slow economic recovery and some activism around issues of racial marginalization (like Black Lives Matter), to shape the Left as we know it.
perry: Also, Dan Pfeiffer, a former Obama adviser, has been encouraging Beto O’Rourke to get into the race. David Axelrod, another former Obama advisers, has been praising Pete Buttigieg, who has also gotten praise from Obama himself. (How many mayors are getting shout-outs from Obama?) So that gives you some sense of how people who were deeply involved in Obama’s 2008 campaign see the 2020 race.
natesilver: Yeah, the Obama people themselves are quite pro-Beto. Especially the Obama people who didn’t move on to work for the Hillary Clinton campaign in some capacity.
perry: Obama got some credit from liberal activists in 2008 for being opposed to the Iraq War, but I don’t think the Left was as organized then.
And it didn’t have obvious champions who were strong candidates. Now, the Left has Warren, Sanders and other candidates who are taking fairly liberal positions (like Harris).
julia_azari: I’d call Beto and Buttigieg the closest we have to “outsiders” in the race. Well, them and Tulsi Gabbard.
natesilver: Gabbard and Obama both have the Hawaii thing going on. Is she the new Obama?
perry: I agree with the idea that Beto is something of an outsider. He was in Congress, but I feel like he barely registered there. I literally don’t think I have ever covered him doing anything important on Capitol Hill.
sarahf: It’s interesting that no one is connecting Obama and Amy Klobuchar. Is it because she’s too much of a Washington insider?
natesilver: Both Klobuchar and Obama are very Midwestern, I say as someone from the Midwest.
perry: She is not particularly charismatic or inspiring. Yes, we have a FiveThirtyEight measurement for that :)
julia_azari: Is being charismatic an important part of Obama’s legacy?
natesilver: With Klobuchar, the problem is that she goes too far in the direction of pragmatism, whereas Obama tried (and often succeeded) to have it both ways in terms of projecting both pragmatism and idealism.
perry: Agree.
Obama was maybe center-left on policy, but his message was never really, “We can’t do this” — which is what Klobuchar keeps saying about a lot of big Democratic initiatives. She is not exactly hope and change. She is pragmatism. She even uses the phrase “pragmatic progressive” to describe herself.
julia_azari: A great example of this is the comment she made at a CNN townhall this week about the idea of free college for everyone. After saying she was against it, Klobuchar said: “If I was a magic genie and could give that to everyone and we could afford it, I would.” That was on every podcast I listened to this morning.
Another thing I’ve been thinking about that I haven’t seen in any of the candidates is that Obama had this very strong sense of history when he talked, particularly about race. He talked a fair amount about founding ideals. Because the current moment feels so pressing and Trump gives Democratic hopefuls such an obvious foil, I don’t have the sense that this is happening as much this time around.
natesilver: 2007-08 was fairly pressing too, though. With the financial crisis unfolding.
perry: I think Warren and Sanders are trying to tell stories and narratives, but about the economy. I don’t know that Booker or Harris can tell the story about race in America through the lens of being a black person in a compelling way, because Obama has done that.
I think we are agreeing that being an Obama-like candidate is not necessarily linked to being black. I agree with that to some extent — maybe 85 percent — but I have also watched voters tell Booker, “I like you, you sound like Obama.” And that is certainly related to Booker being black.
natesilver: And that’s one area — the sense of history and how it affected him personally –on which Beto, in particular, falls flat relative to Obama. He’s coming from a fairly privileged upbringing, so his personal “journey” isn’t likely to be all that compelling.
julia_azari: Another question I have is whether those stories will be more important in a crowded field — where differentiation is at a premium — or less important as who the hell can remember anything about anyone?
perry: The narrative that Warren and Sanders are telling is distinct. The other candidates are saying that what is wrong in the U.S. is largely about Trump, but those two are setting themselves apart by saying the villain is the wealthy or the 1 percent. That will matter to voters on the Left.
But Harris, as she was about to start her formal campaign, spoke extensively about her mother. I wonder if that resonated much with voters, with so much else going on in the news. I doubt it.
natesilver: Maybe we’re not talking enough about Booker? His period as mayor of Newark feels a lot like Obama’s time as a community organizer, in terms of how he’s trying to shape his narrative.
One of the things that was relatively distinctive about Obama was that he embraced his urbanness, when presidents typically come from more rural or suburban areas.
Booker has been trying to do the same thing.
perry: I think Booker is obviously in the Obama mold. You could even argue that Obama was in the Booker mold. (Booker was famous first, to some extent.)
julia_azari: But it seems to me like the Booker-Obama comparison is vulnerable to ham-handed comparisons about them both being younger black men.
natesilver: Yeah — if people are looking at race, are they going to think that the Booker-Obama comparison is too on the nose? Like, you want to be Obama-ish or Obama-adjacent, but not too much like Obama.
julia_azari: I also wonder what it means for white men like O’Rourke or Buttigieg to be positioned as the inheritors of the Obama legacy. That seems to me to be a sign of a conscious effort to craft an Obama legacy that’s not about race or identity. (Though Buttigieg is gay, and I don’t want to downplay the significance of that.)
sarahf: So what would it mean then if Joe Biden were to enter the field? He was Obama’s vice president. Does proximity to Obama matter when it comes to being the “Obama candidate”?
perry: I don’t know. I tend to think that Biden’s waiting to make a decision about running is connected to the fact that he will likely not be a big favorite if he gets into the race. I think he assumes (like I do) that lots of people who voted for Obama aren’t going to vote for him.
natesilver: Also, the fact that Obama is meeting with all 73 other Democratic candidates seems like it’s not great news for Biden.
julia_azari: If Biden were to enter the race, it would focus questions on Obama’s legacy, because that would have to be part of Biden’s political story. It would definitely open him up for attack from the other candidates and make the idea of an “Obama candidate” more contested.
perry: I tend to think liberal Democrats in particular will find plenty of ways to attack Biden that will have nothing to do with Obama. Obama was young, something of an outsider and non-white, but Biden is none of those things. It will be easy for other candidates to suggest that they, not Biden, are the “Obama candidate” for 2020.
And I think the answer is intuitive when the question is: Who is more like the “Obama candidate,” Biden or Harris? (Harris.)
sarahf: But how much does it matter if a candidate is like Obama if the goal is to just select someone who can beat Trump?
perry: That’s a good question, but it may overlook how many different groups of people Obama won over. Obama managed to do somewhat well among white, non-college voters in the Midwest and get high turnout among African-Americans.
Is there anyone in this field who can do that?
natesilver: I mean …. maayyyyyyyyyyyyyyyyyyybe Booker? I’m much more bullish on Harris’s chances overall, but Booker has a reputation as being a little bit better as a retail politician.
julia_azari: The question also matters as to Obama’s eventual legacy, which is something that will be of importance to a lot of people — some of whom aren’t even professional presidential scholars!
perry: In some ways, the question of who will be the next Obama is quite relevant to electability considerations.
sarahf: COALITION BUILDING TIME
julia_azari: Yeah, the ability to build a coalition like Obama is the more pressing concern.
And in 2008, Obama did two things in terms of the electoral map that I think are notable: (1) He had a strong showing in the Midwest (he won Wisconsin by 14 percentage points and (2) he made a dent in some Republican areas (North Carolina, Virginia and Indiana).
perry: A 2020 version of Obama’s 2008 victory might be: getting big turnout among Asian, black and Latino voters, flipping Arizona and Georgia blue, nearly winning Texas, and carrying Wisconsin and Michigan, because those states are swingy.
julia_azari: And that’s a continuation, in some ways, of a kind of ad hoc Electoral College strategy, rather than a fundamental change.
sarahf: Or an example of successful coalition-building as you all mentioned. Any last thoughts?
julia_azari: I just want to reiterate that this is an important question about the direction of one of the two major parties and about the legacy of the first African-American president.
(And since I’m writing about it, not at all self-serving!)
natesilver: I do think electability was a pretty big part of the Obama brand in 2008. There was a lot of subtle and not-so-subtle messaging to suggest that he could expand the map more than Hillary Clinton could.
And remember, Obama was very popular in 2008, at least at the start of the campaign, even among independents and some moderate Republicans.
perry: I kind of think the search for the next Obama will end up like the search for the next Bill Clinton (a Southern centrist) that happened from, say, 2001 to 2007 (John Edwards, Mark Warner, etc.). The next great Democratic candidate will be his or her own thing — a person who builds a multiracial coalition (because that’s who the Democrats are), but in a way that is distinct from what Obama did. O’Rourke, Harris and Klobuchar are all distinct from Obama — Warren and Sanders are even more so.
natesilver: It’s hard to win the Democratic primary — or to win the general election as a Democrat — without building a multiracial coalition. Which is why I wonder if Obama isn’t the new normal.
February 19, 2019
Politics Podcast: Bernie Sanders’s Path To The Democratic Nomination
More: Apple Podcasts |
ESPN App |
RSS
| Embed
Embed Code
Sen. Bernie Sanders of Vermont announced Tuesday that he is running for president again. The FiveThirtyEight Politics podcast team describes what his paths to both success and failure in the 2020 Democratic primary could look like. It’s possible that his bedrock of support from 2016 could win him a plurality in a crowded 2020 field. But winning with a broad coalition of Democratic voters might be a more difficult task.
The crew also follows up on congressional Republican reactions to President Trump’s national emergency declaration.
You can listen to the episode by clicking the “play” button in the audio player above or by downloading it in iTunes , the ESPN App or your favorite podcast platform. If you are new to podcasts, learn how to listen .
The FiveThirtyEight Politics podcast publishes Monday evenings, with occasional special episodes throughout the week. Help new listeners discover the show by leaving us a rating and review on iTunes . Have a comment, question or suggestion for “good polling vs. bad polling”? Get in touch by email, on Twitter or in the comments.
February 18, 2019
Could Congress Block Trump’s Emergency Declaration?
President Trump has declared a national emergency in order to pay for physical barriers along the U.S.-Mexico border, but will Congress block it? That’s a long shot — but we can’t rule it out either.
Here’s the basic process, as the New York Times explained in an article after Trump’s declaration. Congress can take up a resolution to end a presidential national emergency declaration. If such a resolution passes in one chamber, the other must bring it up for a vote within 18 days. If the resolution passes both chambers and the president vetoes it, a two-thirds majority in Congress can override that veto.
In the House, Democrats say they are strongly considering a resolution to override Trump’s emergency declaration. If they take it up for a vote, the resolution is almost certain to pass — Democrats have a 235-197 majority in the House.
That would move the legislation to the Senate, where Republican Leader Mitch McConnell — although initially wary of Trump declaring a national emergency — has now expressed his support for the move. But there does not appear to be a way for him to avoid a Senate vote on this measure. And such a vote will force Senate Republicans, many of whom have said they are wary of presidents overextending their power at the expense of Congress, to choose between that principle of limiting executive power and backing a president with strong support among party activists on one of his signature initiatives, the border wall.
Republicans have a 53-47 advantage in the Senate, so only four defections and this resolution would pass. (The resolution is not subject to rules that would require 60 votes for it to move forward.) By FiveThirtyEight’s count, at least eight GOP senators — Tennessee’s Lamar Alexander, Maine’s Susan Collins, Alaska’s Lisa Murkowski, Kentucky’s Rand Paul, Florida’s Marco Rubio, Nebraska’s Ben Sasse, North Carolina’s Thom Tillis and Pennsylvania’s Pat Toomey — have said they oppose the national emergency declaration. Opposing the declaration and voting for a resolution to end it are not the same thing, but more than a dozen other Republican senators have also expressed reservations about Trump’s move.1
Every Republican senator’s statement (or silence) on Trump’s declaration of a national emergency
As of Feb. 18, 2019 at 12 a.m.
Statement on National emergency
Senator▲▼
State▲▼
Date▲▼
Source▲▼
Stance▲▼
Alexander
TN
2/16
“Unnecessary, unwi …
Opposes
Barrasso
WY
2/11
“I would prefer we …
Concerns/doubts
Blackburn
TN
Blunt
MO
2/15
“No president has …
Concerns/doubts
Boozman
AR
2/14
Boozman spokesman …
Undecided
Braun
IN
2/14
“This legislation …
Supports
Burr
NC
Capito
WV
2/15
“Our agreement mak …
Supports
Cassidy
LA
2/15
Liberal judges wi …
Supports
Collins
ME
2/14
“Declaring a natio …
Opposes
Cornyn
TX
2/14
“My concerns about …
Concerns/doubts
Cotton
AR
2/15
The offices of Cot …
Undecided
Cramer
ND
2/16
“As he’s said from …
Supports
Crapo
ID
2/14
“The President has …
Supports
Cruz
TX
2/15
“Senator Ted Cruz, …
Undecided
Daines
MT
2/15
“We need more forc …
Supports
Enzi
WY
Ernst
IA
Fischer
NE
2/15
“I appreciate the …
Supports
Gardner
CO
2/14
“Congress is most …
Concerns/doubts
Graham
SC
2/14
“I think this is a …
Supports
Grassley
IA
2/14
“I wish he wouldn’ …
Concerns/doubts
Hawley
MO
2/15
“The president is …
Supports
Hoeven
ND
2/16
“U.S. presidents f …
Supports
Hyde-Smith
MS
Inhofe
OK
2/15
“U.S. Sen. Jim Inh …
Supports
Isakson
GA
1/11
“I have a lot of t …
Concerns/doubts
Johnson
WI
2/14
“It would be a pre …
Concerns/doubts
Kennedy
LA
2/14
Said he supports T …
Supports
Lankford
OK
2/13
“The best thing t …
Concerns/doubts
Lee
UT
2/15
“The president’s n …
Concerns/doubts
McConnell
KY
2/14
“I indicated I’m g …
Supports
McSally
AZ
2/15
“Earlier this week …
Undecided
Moran
KS
2/15
“Throughout my tim …
Concerns/doubts
Murkowski
AK
2/14
“I don’t think thi …
Opposes
Paul
KY
2/14
“I’m not in favor …
Opposes
Perdue
GA
1/29
He continued to de …
Supports
Portman
OH
2/14
“I would prefer we …
Concerns/doubts
Risch
ID
2/14
“But other Senate …
Supports
Roberts
KS
2/14
If he had his drut …
Undecided
Romney
UT
2/14
“I will reserve ju …
Concerns/doubts
Rounds
SD
2/14
“If you get anothe …
Concerns/doubts
Rubio
FL
2/14
“We have a crisis …
Opposes
Sasse
NE
2/15
“We absolutely hav …
Opposes
Scott
FL
2/15
“I applaud the pre …
Supports
Scott
SC
2/14
“I would not oppos …
Supports
Shelby
AL
2/14
“I’m not concerned …
Supports
Sullivan
AK
2/15
A spokesman for Se …
Undecided
Thune
SD
2/14
“We don’t think th …
Concerns/doubts
Tillis
NC
2/15
“I don’t believe a …
Opposes
Toomey
PA
2/14
“I never thought t …
Opposes
Wicker
MS
2/14
“As a practical ma …
Concerns/doubts
Young
IN
2/15
“I need to learn m …
Undecided
Blank rows indicate that senator has not made a statement (or we could not confirm one).
Yes, we know that in the past GOP senators have hinted that they will break with Trump on key legislation and then not followed through. That said, we are talking about only four senators needing to break with the president on this resolution. And three of the Republicans to come out against the declaration — Collins, Murkowski and Paul — were key figures in stopping the GOP from repealing Obamacare in 2017, so they have in at least one major instance actually followed through on their concerns with a Trump initiative.
In other words, there’s a real chance that both houses of Congress pass this legislation. A bill adopted by the GOP-controlled Senate rejecting Trump’s emergency declaration would be important symbolically. And it would force Trump to issue the first veto of his presidency, which will bring even more attention to his already unpopular move to declare a national emergency.
What happens if Trump vetoes the resolution?
In the Senate, 67 votes would be needed to override his veto, meaning 20 Republicans would need to break with the president. As noted above, there are more than 20 Senate Republicans wary of this move. So it’s at least theoretically possible that the dam could break; the fissures run deeper than the typical issues on which only a handful of Republicans like Collins and Murkowski are considering a vote against the president. But not liking the emergency declaration and voting for a resolution that will stop it — and stoking Trump’s anger as many Republicans are gearing up for primaries in 2020 — are totally different things. It’s also not clear if McConnell is required to even hold a vote on the veto override.
The bill would also have to achieve a two-thirds majority in the House, which wouldn’t be easy. FiveThirtyEight has not done a formal whip count in the lower chamber. A two-thirds majority would require 288 votes — so 53 Republicans would have to join all the Democrats. Most Republicans in competitive districts lost in 2018, which means there are relatively few GOP representatives left who have to worry about electoral pressure. Earlier this year, amid the government shutdown, for instance, a bloc of about a dozen Republicans broke with Trump to back some Democratic measures to fund the government without wall money. So it’s not like all 197 House Republicans are Trump loyalists. But a dozen is a long way from the 53 GOP votes in the House to override his veto.
It’s still more likely the courts, not Congress, are the place where this national emergency declaration faces its most serious challenge. But the congressional process is worth watching too. Much of Trump’s agenda (such as confirming conservative judges to federal courts) is broadly supported by GOP legislators. In fact, you could argue that much of what has happened in Washington over the last couple years represents Trump embracing the congressional Republicans’ agenda, not the other way around. But the border wall is not really a major priority for McConnell or many key congressional Republicans. Trump cares deeply about it. So the president, by issuing this declaration, has forced his party into what amounts to a loyalty test — will they stand with him, even if it means abandoning some of their long-held concerns about executive overreach?
February 14, 2019
Trump Keeps Doubling Down On The Same Failed Strategy
President Trump will declare a national emergency and seek money to build a border wall, Senate Majority Leader Mitch McConnell said on Thursday, moments before the U.S. Senate passed a compromise spending bill that didn’t include wall funding.
If Trump follows through on the emergency declaration, he’ll be doing something that large majorities of Americans oppose — and he’ll be doing it at right as his job approval ratings had begun to rebound following the partial government shutdown in December and January.
Indeed, the act of declaring a national emergency to build a wall is even more unpopular than the wall itself — and the wall isn’t popular. Polls as tracked by PollingReport.com show an average of 32 percent of Americans in favor of the declaration and 65 percent opposed. Even in an era where many of Trump’s top priorities poll only in the low-to-mid-40s, that’s an especially large split, with roughly twice as many voters opposed as in favor.
Voters strongly oppose a national emergency over the wall
Polls conducted during and since the partial government shutdown on whether Trump should declare a national emergency to build a wall on the U.S.-Mexico border
Pollster
Dates
Approve/ Support/ Should
Disapprove/ Oppose/ Should not
CNN/SSRS
Jan. 30-Feb. 2
31%
66%
Quinnipiac University
Jan. 25-28
31
66
Monmouth University
Jan. 25-27
34
64
Quinnipiac University
Jan. 9-13
32
65
ABC News/Washington Post
Jan. 8-11
31
66
Average
32
65
Source: POLLINGREPORT.COM
The emergency plan could potentially become somewhat more popular if Trump tries to rally his base behind it, but it’s an issue that causes a fair amount of divisiveness even among Republican lawmakers.
And the strategy suggests that Trump didn’t learn any lessons from the shutdown. His approval rating, which was 42.2 percent on the day the shutdown began, bottomed out at 39.3 just as the shutdown was ending. It has since mostly recovered to 41.5 percent, however. Despite Trump’s having capitulated to House Speaker Nancy Pelosi in agreeing to reopen the government for three weeks, the sky didn’t fall and the base stuck with Trump.

The mechanics of this are fairly straightforward. Trump indeed has a loyal1 base. That base is so loyal, however, that very little about what Trump does seems to affect their views or him. Here is Trump’s approval rating by party according to Gallup since the midterm elections, for example. Among Republicans, Trump’s approval rating was steady at roughly 88 percent before, during and after the shutdown. Among Democrats, it was also largely unchanged.2 Among independents, however, his approval rating plunged from about 39 percent just before the shutdown to 31 and 32 percent in two polls conducted in the midst of it, before recovering to 38 percent once the shutdown was over.
Trump’s base remained loyal during the shutdown
Trump’s job approval rating, by party, before and after the government shutdown
Trump’s Approval Rating Among
Dates
Republicans
Independents
Democrats
Feb. 1-10
89%
38%
5%
Jan. 21-27
88
32
5
Jan. 2-10, 2019
88
31
6
Dec. 17-22
89
39
8
Dec. 10-16
86
37
7
Dec. 3-9
89
38
7
Nov. 26-Dec. 2
89
39
6
Nov. 19-25
86
34
9
Nov. 12-18, 2018
90
37
6
Polls in the shaded rows were conducted mostly or entirely during the government shutdown.
Source: Gallup
Again, nothing here is rocket science. It’s Electoral Politics 101. Trump does unpopular stuff, and he becomes more unpopular. The erosion mostly comes from independents because Republicans are highly loyal to him and Democrats are already almost uniformly opposed.
But Trump will need those independents to win re-election. He needed them to become president in the first place. Trump won independents by 4 points, 46 percent to 42 percent for Hillary Clinton, in 2016. Had they gone for Clinton by 4 points instead, she would have won the national popular vote by 4 or 5 points, and won Wisconsin, Michigan, Pennsylvania, Florida and possibly Arizona.
Or things could get a lot worse than that for Trump, and he could lose independents by a wider margin. In the 2018 midterms, Republicans lost independents by 12 percentage points, contributing to a 40-seat loss in the House. The key facet about the midterms is that turnout was very high, including among the Republican base. But it was also high among the Democratic base, and Republicans badly lost independents. The base alone isn’t enough to win national elections, especially for Republicans, since fewer voters identify as Republicans than as Democrats.
There’s just not a lot more to say about this. If Trump didn’t learn he needs to reach beyond his base from either the midterms or from the shutdown, he probably won’t figure it out in time for 2020.
From ABC News:
Politics Podcast: Trump Plans To Declare A National Emergency
More: Apple Podcasts |
ESPN App |
RSS
| Embed
Embed Code
White House Press Secretary Sarah Huckabee Sanders released a statement Thursday saying that President Trump plans to sign a bipartisan budget deal and declare a national emergency to build a wall at the southern border. The FiveThirtyEight Politics podcast team reacts to the news of the planned declaration, and Vox senior correspondent Dara Lind joins the podcast to discuss the contours of the border security deal.
You can listen to the episode by clicking the “play” button in the audio player above or by downloading it in iTunes , the ESPN App or your favorite podcast platform. If you are new to podcasts, learn how to listen .
The FiveThirtyEight Politics podcast publishes Monday evenings, with occasional special episodes throughout the week. Help new listeners discover the show by leaving us a rating and review on iTunes . Have a comment, question or suggestion for “good polling vs. bad polling”? Get in touch by email, on Twitter or in the comments.
February 13, 2019
Everyone’s Running — And That Could Be Dangerous For The Democrats
Minnesota Sen. Amy Klobuchar became the 10th major Democratic candidate for president on Sunday. She almost certainly won’t be the last addition to the field. Another 20 or so prominent Democrats are still considering a presidential bid, which could eventually send the number of candidates into the teens or even 20s — perhaps eclipsing the 17 major candidates who ran for the Republican nomination in 2016.
But is the number of candidates really a meaningful metric? Sometimes the field can winnow dramatically in the run-up to the first primaries and caucuses or shortly thereafter. By my count, 12 major candidates sought the Republican nomination in 2000. But many of them dropped out before anyone voted, and after New Hampshire it was really just a two-way race between then-Texas Gov. George W. Bush and Sen. John McCain. And in 2004, then-Sen. John Kerry emerged from a crowded Democratic field to win the nomination fairly easily after strong showings in the early states.
Those cases are more the exception than the rule, however. In fact, the size of the field usually does tell us a lot about how the primary will play out. In particular, it tells us whether party elites are likely to form a consensus around a single candidate, as the Democratic establishment did around Hillary Clinton in 2016 but as Republicans famously failed to do in that year’s primary process, paving the way for the nomination of President Trump.
The crowded field developing for 2020 doesn’t necessarily imply that an anti-establishment candidate will prevail. Even when party elites don’t get their first choice, they usually get someone they can live with. But the high number of candidates does imply a higher-than-usual risk of chaos.
It also implies that the “next-in-line” candidates, former Vice President Joe Biden and Sen. Bernie Sanders, aren’t intimidating anyone. Neither Biden nor Sanders have officially entered the race yet, and it’s possible they’ll unveil a slew of endorsements when (and if) they do, which would show that the party backed them all along. But that seems unlikely. If they had strong support from party elites, we probably wouldn’t have so many other candidates already running or actively contemplating a bid — especially candidates who appeal to the same kinds of voters as Sanders and Biden do.1 That inference also aligns with reporting about Biden and Sanders that suggests they’re having trouble finding the support from party actors they were hoping for.
Let’s take a step back, though. How to define the number of “major” candidates running for president is a little tricky. Technically, there are already hundreds of people who have filed their paperwork to run for president in 2020, but most of them are people you’ve never heard of and never will. In a perfect world, you might evaluate a series of criteria to determine who’s a major candidate, including whether they’re regularly included in media coverage about the campaign, whether they’re included in polls, whether they’ve raise a significant amount of money, whether they’re invited to participate in the debates, whether they have traditional credentials for the presidency, whether they have ballot access in most states, and so forth. It’s probably worth erring on the side of inclusiveness, but you can go overboard and wind up with a list that’s dozens or hundreds of candidates long. For purposes of this article, though, I’m mostly using press coverage and credentials as the markers of major candidates. If the media is ambivalent about whether someone qualifies as a major candidate, I tend to give them the benefit of the doubt if they’ve held elected office before, but otherwise not.
In my judgment, then, there are 10 major Democrats who have either officially launched their campaigns or formed a presidential exploratory committee. (Note that entering the race2 and withdrawing still counts as running; this will become relevant in a moment.) Here are the first nine, in alphabetical order:
Sen. Cory Booker of New Jersey.
Mayor Pete Buttigieg of South Bend, Indiana.
Former San Antonio mayor and former Housing and Urban Development Secretary Julian Castro.
Former U.S. Rep. John Delaney of Maryland.
U.S. Rep. Tulsi Gabbard of Hawaii.
Sen. Kirsten Gillibrand of New York.
Sen. Kamala Harris of California.
Sen. Klobuchar of Minnesota.
Sen. Elizabeth Warren of Massachusetts.
You could probably argue against the inclusion of Buttigieg and perhaps even against Delaney and Gabbard, but there is some precedent (albeit not a lot) for U.S. representatives becoming president, and Buttigieg is getting a fair amount of media coverage (and he’s an elected official). But Andrew Yang, the founder of a nonprofit that teaches young people to run startups, and Marianne Williamson, an author and “spiritual teacher,” probably do not qualify as major candidates as they don’t hold public office, nor are they nationally renowned for other reasons. A harder case is former West Virginia state senator Richard Ojeda, who dropped out after entering the race in November. In terms of media coverage, such as , Ojeda was about halfway between Yang and Buttigieg. I’m inclined to include him because, as mentioned, I prefer to give candidates who have held elected office the benefit of the doubt. Thus:
10. Former state senator Richard Ojeda of West Virginia (withdrawn).
Which other Democrats might enter the field? Here is a possibly incomplete list of names. I’ve included everyone who is:
Given at least a 10 percent chance of running at PredictIt.
Or is included on The New York Times’s list of potential candidates.
Or has expressed in a recent news story that they’re still considering a bid.3
Which other Democrats might run for president?
Chance that potential Democratic presidential candidates might run, based on PredictIt evaluations,* The New York Times and Nate’s guesses
Candidate
Chance
Source
John Hickenlooper
89%
PredictIt
Bernie Sanders
88
PredictIt
Sherrod Brown
87
PredictIt
Jay Inslee
87
PredictIt
Beto O’Rourke
77
PredictIt
Steve Bullock
75
New York Times guesstimate
Joe Biden
74
PredictIt
Eric Holder
66
PredictIt
Eric Swalwell
60
Nate’s wild guesstimate
Terry McAuliffe
59
PredictIt
Jeff Merkley
50
New York Times guesstimate
Tim Ryan
40
Nate’s wild guesstimate
Seth Moulton
40
Nate’s wild guesstimate
Michael Bloomberg
33
PredictIt
Michael Bennet
25
New York Times guesstimate
Bill de Blasio
25
New York Times guesstimate
John Kerry
25
New York Times guesstimate
Stacey Abrams
20
Nate’s wild guesstimate
Mitch Landrieu
15
PredictIt
Hillary Clinton
11
PredictIt
Andrew Cuomo
10
PredictIt
* As of 5:15 p.m. on Feb. 12, 2019.
For Inslee, O’Rourke, Bloomberg and Landrieu, PredictIt asks bettors whether a potential candidate will enter the race by a certain date, rather than whether they’ll run at all.
These probabilities imply that an additional 10 or 11 Democrats will enter the race, although there’s still a fairly wide range of possibilities. If you assume (possibly dubiously) that each candidate’s decision is independent, the 95 percent confidence interval runs from seven additional candidates to 14. That means that we’ll end up with a total of between 17 and 24 Democratic candidates, including the 10 (one since withdrawn) we have already.
So while a handful of candidates have declined a bid — Los Angeles Mayor Eric Garcetti and former Massachusetts Gov. Deval Patrick probably foremost among them — this is likely to be a very big, possibly even record-breaking field.
In primaries since 1972 that haven’t featured an incumbent president, parties have averaged about 10 major candidates for president. So Democrats are looking at roughly double the average. Here’s who I consider the major candidates to have been in past years — again, acknowledging that the term “major” is pretty subjective but that I’m erring on the side of inclusivity:
How many ‘major’ candidates ran in previous primaries?
Number of major candidates in presidential primaries since 1972, excluding primaries for parties with an incumbent president running for re-election
Year
Party
No. of Candidates
Nominee
Other candidates
2020
D
17 to 24
?
Booker, Buttigieg, Castro, Delaney, Gabbard, Gillibrand, Harris, Klobuchar, Ojeda, Warren, others TBD
2016
R
17
Trump
Cruz, Kasich, Rubio, Bush, Carson, Paul, Christie, Huckabee, Fiorina, Gilmore, Santorum, Perry, Walker, Jindal, Graham, Pataki
2016
D
5
Clinton
Sanders, O’Malley, Chafee, Webb
2012
R
12
Romney
Santorum, Paul, Gingrich, Perry, Huntsman, Bachmann, Roemer, Johnson, Cain, McCotter, Pawlenty
2008
R
12
McCain
Romney, Huckabee, Paul, F. Thompson, Keyes, Hunter, Giuliani, Brownback, Gilmore, Tancredo, T. Thompson
2008
D
10
Obama
Clinton, Edwards, Richardson, Biden, Dodd, Gravel, Kucinich, Vilsack, Bayh
2004
D
10
Kerry
Edwards, Dean, Clark, Kucinich, Gephardt, Lieberman, Sharpton, Moseley Braun, Graham
2000
R
12
Bush
McCain, Keyes, Forbes, Bauer, Hatch, Alexander, Buchanan, Dole, Kasich, Quayle, Smith
2000
D
2
Gore
Bradley
1996
R
12
Dole
Buchanan, Forbes, Alexander, Keyes, Dornan, Gramm, Lugar, Specter, Wilson, Fletcher, Taylor
1992
D
8
Clinton
Brown, Kerrey, Harkin, Tsongas, McCarthy, Wilder, Agran
1988
R
7
Bush
Dole, Robertson, Kemp, du Pont, Haig, Laxalt
1988
D
11
Dukakis
Jackson, Gore, Gephardt, Simon, Hart, Babbitt, Traficant, Applegate, Schroeder, Biden
1984
D
8
Mondale
Hart, Jackson, Glenn, McGovern, Askew, Cranston, Hollings
1980
R
9
Reagan
Bush, Anderson, Baker, Connally, Crane, Dole, Pressler, Weicker
1976
D
16
Carter
Brown, Wallace, Udall, Jackson, Church, Bayh, Bentsen, Byrd, Fauntroy, Harris, Shapp, Shriver, Washington, Sanford, Mondale
1972
D
15
McGovern
Humphrey, Wallace, Muskie, Chisholm, Bayh, Harris, Hartke, Jackson, Lindsay, McCarthy, Mills, Mink, Sanford, Yorty
“Major” is a somewhat squishy term, and although this list errs on the side of inclusivity, a few candidates may have slipped through the cracks. The table includes candidates who withdrew before competing in any primaries.
I have the 17-candidate Republican field of 2016 as the largest since at least 1972, although the 1972 (15 candidates) and 1976 (16 candidates) Democratic primaries are close. You can also see how the number of candidates has tended to rise and fall over time. After the chaotic 1972 and 1976 nomination cycles, parties averaged 8.6 candidates per cycle between 1980 and 2000. The average has been 11 per election since 2004, however, and it will likely rise to 12 or 13 depending on how many more candidates we get this year.
As should be pretty intuitive, larger fields are correlated with more prolonged nomination processes in which both voters and party elites have a harder time reaching consensus. Below is a table comparing the number of candidates in each past cycle against the share of the overall popular vote the nominee eventually received. I’ve also included a more subjective measure of whether party elites were able to get their way. I consider the party to have decided — that is, for party elites to have gotten their preferred choice — if there was a clear front-runner in endorsements in advance of the Iowa caucuses and that candidate won the nomination. And I consider the elites to have failed if a factional candidate who lacked broad support from the party establishment won. Then there are in-between cases such as the 2008 Democratic primary, in which party elites didn’t necessarily get their first choice (or there wasn’t a clear first choice), but the candidate who emerged was broadly acceptable to multiple major factions of the party.
Bigger primary fields mean more uncertainty
Number of “major” candidates in presidential primaries since 1972* and whether the eventual nominee was favored by party elites
Year
Party
Nominee
No. of Candidates
Did party elites get what they wanted?
Nominee’s share of pop. vote in primaries
2016
R
Trump
17
No
44.9%
1976
D
Carter
16
No
40.2
1972
D
McGovern
15
No
25.3
2012
R
Romney
12
Yes
52.1
2008
R
McCain
12
Sort of
46.7
2000
R
W. Bush
12
Yes
62.0
1996
R
Dole
12
Yes
58.8
1988
D
Dukakis
11
Sort of
42.4
2008
D
Obama
10
Sort of
47.4
2004
D
Kerry
10
Sort of
61.0
1980
R
Reagan
9
Yes
59.8
1992
D
B. Clinton
8
Yes
52.0
1984
D
Mondale
8
Yes
38.3
1988
R
H.W. Bush
7
Yes
67.9
2016
D
H. Clinton
5
Yes
55.2
2000
D
Gore
2
Yes
75.4
* Excluding nomination processes for which an incumbent president was running for that party.
“Major” is a somewhat squishy term, and although this list errs on the side of inclusivity, a few candidates may have slipped through the cracks. The table includes candidates who withdrew before competing in any primaries.
Source: Wikipedia
This table ought to worry establishment Democrats. The three past elections when the field was as large as its shaping up to be in 2020 all resulted in party elites failing to get their way. They also resulted in a nominee who failed to get 50 percent of the popular vote in the primaries, which could yield a contested convention since Democratic delegate allocation rules are highly proportional to the popular vote. In a field of 20 candidates, for instance, you’d project — extrapolating from the data above — that the eventual nominee would have either 32 percent or 40 percent of the popular vote, depending on whether you use a linear or logarithmic trendline. That could mean that the race is decided at the convention.

Granted, extrapolation can be dangerous in cases like these. If we do wind up with a field of 20 or so Democratic candidates, we’ll be in outlier-land because we’ve never had a field so large before.
But the past electoral cycles where the field was nearly as big as this one shouldn’t exactly be comforting to Democrats, and it should be particularly worrying for next-in-line candidates such as Biden. Democratic voters like a lot of their choices and feel optimistic about their chances of beating Trump in 2020. The large field is both a sign that there may not be consensus about the best candidate and a source of unpredictability.
From ABC News:
Our Very First 2020 Vice Presidential Draft
Welcome to FiveThirtyEight’s weekly politics chat. The transcript below has been lightly edited.
sarahf (Sarah Frostenson, politics editor): We’re back with a snake draft of 2020 Democratic presidential contenders, but this time with a twist — we’re picking the … VICE PRESIDENT.
I know — we don’t know who the presidential nominee is yet. But let’s face it: Even if the primary field grows to 20-plus Democrats, only one can win the nomination. So we might as well talk about who would make a desirable running mate (if not commander-in-chief). And before you scoff, a candidate’s choice for VP can signal a lot about what he or she prioritizes or considers to be a campaign weakness.
Remember, we’re trying to pick someone who’d make a good second-in-command, although our picks tend to diminish in quality as the rounds wear on. The rules are as follows: Four rounds, so between the four of us, 16 potential 2020 Democratic veeps. Let’s determine the order. (I’m going to write our names on paper and recruit someone in the office to draw them out of a hat while Nate orders some Chinese takeout.)
natesilver (Nate Silver, editor in chief): I’m pretty excited about this, I gotta say.
(The VP draft, not just the Chinese food.)
geoffrey.skelley (Geoffrey Skelley, elections analyst): All about a well-balanced meal, or presidential ticket.
sarahf: The lineup:
Clare
Nate
Geoff
Sarah
natesilver: Pretty happy with the No. 2 pick here.
sarahf: I can’t believe I have to go twice in a row. I hate 
February 11, 2019
Politics Podcast: Amy Klobuchar’s Path To The Democratic Nomination
More: Apple Podcasts |
ESPN App |
RSS
| Embed
Embed Code
On Sunday, Sen. Amy Klobuchar of Minnesota announced her candidacy for president, joining an already crowded field. The FiveThirtyEight Politics podcast crew assesses her potential advantages, including being a Midwesterner in a field with many coastal politicians, and her possible weaknesses. The team also discusses the political significance of the Green New Deal resolution, which was released by progressive Democrats last week.
You can listen to the episode by clicking the “play” button in the audio player above or by downloading it in iTunes , the ESPN App or your favorite podcast platform. If you are new to podcasts, learn how to listen .
The FiveThirtyEight Politics podcast publishes Monday evenings, with occasional special episodes throughout the week. Help new listeners discover the show by leaving us a rating and review on iTunes . Have a comment, question or suggestion for “good polling vs. bad polling”? Get in touch by email, on Twitter or in the comments.
Nate Silver's Blog

- Nate Silver's profile
- 730 followers

