
Nate Silver's Blog, page 131
June 29, 2016
Donald Trump Has A 20 Percent Chance Of Becoming President
Just launched: our 2016 general election forecast .
How do you predict a general election with Donald Trump?
We can think of a few basic approaches. One of them is to assert that precedent doesn’t apply to this election and that Trump’s case is sui generis. It’s not clear where that leads you, however.
If Trump is “unpredictable,” a phrase we heard used to describe him so often during the primaries, does that mean his chances of defeating Hillary Clinton are 50/50? If that’s what you think, you have the opportunity to make a highly profitable wager. Betting markets put Trump’s chances at only 20 percent to 25 percent instead.
In fact, despite (or perhaps because of) the unusual nature of his candidacy, the conventional wisdom holds that Trump is a fairly substantial underdog. In contrast to 2012, when there were frequent arguments over how solid President Obama’s lead in the polls was, there hasn’t been much of a conflict between “data journalists” and “traditional journalists” on this question of Trump’s chances. Nor has there been one between professionals who cover the campaign and the public; most experts expect Trump to lose, but so do most voters.
But should this seeming consensus give us more confidence — or make us nervous that we’re underestimating Trump again?
Giving Trump a 20 percent or 25 percent chance of becoming president means that Clinton has a 75 percent to 80 percent chance. That might seem generous given that, under ordinary circumstances, the background conditions of this election (no incumbent running and a mediocre economy) would seem to suggest a tossup. Are Clinton’s high odds justified on the basis of the polls? Or do they require making heroic assumptions about Trump, the same ones that got everyone, emphatically including yours truly, in trouble during the primaries?
The short answer is that 20 percent or 25 percent is a pretty reasonable estimate of Trump’s chances based on the polls and other empirical evidence. In fact, that’s quite close to where FiveThirtyEight’s statistical models, which are launching today, have the race. Our polls-only model has Trump with a 19 percent chance of beating Clinton as of early Wednesday afternoon. (The forecasts will continually update as new polls are added.) Our polls-plus model, which considers economic conditions along with the polls, is more optimistic about Trump, giving him a 26 percent chance.
Still, Trump faces longer odds and a bigger polling deficit than John McCain and Mitt Romney did at the same point in their respective races. He needs to look back to 1988 for comfort, when George H.W. Bush overcame a similar deficit against Michael Dukakis to win. Our models are built from data since 1972, so the probabilities we list account for elections such as 1980, 1988 and 1992, when the polls swung fairly wildly, along with others, such as 2004 and 2012, where the polls were quite stable.
Two empirical approaches to forecasting TrumpFor me, the lesson of the primaries is that one needs to be more rigorous, not less so, when forecasting elections. That means building a model instead of winging it. In contrast to our early, back-of-the-envelope skepticism about Trump, FiveThirtyEight’s forecast models were largely accurate in the primaries, with our polls-only model calling 53 of 58 races correctly1 and our polls-plus model calling 52 of 58. The polls were a long way from being perfect, but they were wrong within normal parameters: Upsets happened about as often as they were supposed to happen, according to our models.
Nor did the polls underestimate Trump. National polls had him leading the field all along. State-by-state polls overestimated him slightly — Trump lost states where the polls had him favored, such as Iowa and Oklahoma — although not by enough to cost him the nomination.
So what’s our approach this time around? Actually, we’ll take two approaches: polls-plus and polls-only.
The model we call polls-plus abides by the principle of “stick with what works.” It’s pretty much the same model that we used to successfully forecast the 2012 election, blending polls with an index of economic performance. As the election approaches, the weight assigned to the economic index will fade to zero, meaning that polls-plus and polls-only will converge. (Although they won’t be identical; there are some other, more subtle differences, as I describe in the guide to the forecast’s methodology.) For the time being, however, polls-plus assumes the race will probably tighten somewhat. That’s because it shows the economy as being almost exactly average and assumes there’s neither an advantage nor a penalty to the incumbent party in a year like this one, when an incumbent president is retiring. In other words, it sees the fundamentals of the race as showing a tossup, and reduces Clinton’s current lead of about 7 percentage points to a projected Election Day win of about 4 percentage points as a result.
Polls-only’s maxim is “keep it simple, stupid.” This is often a good strategy when faced with novel situations; instead of adding new assumptions, you should remove questionable assumptions. Historically in presidential elections, for instance, polls tend to converge toward the fundamentals down the stretch run. Usually that means they tend to tighten as Election Day approaches.
That tightening, however, may occur because the major-party presidential candidates are usually fairly equal in terms of factors such as fundraising, messaging and other basic aspects of running a campaign.2 That might not be true for Trump and Clinton this year, however. Trump is woefully behind Clinton in fundraising and campaign infrastructure. He’s also a less experienced politician, and faces more intraparty opposition, than any Republican nominee in a long time.
The polls-only model doesn’t make any assumptions about this. It doesn’t use fundraising or political experience as a factor in making its forecasts — instead, it just uses polls and demographic data. It doesn’t treat Trump any differently than it would treat Marco Rubio or Mitt Romney. But polls-only assumes the candidates’ current standing in the polls — meaning, Clinton ahead of Trump by 7.3 percentage points — is the best estimate of the Nov. 8 result. It also accounts for more uncertainty than polls-plus. Even so, it has Trump as a heavier underdog than polls-plus does.
I know some readers will be frustrated by our having two versions of the model; it seems like we’re trying to have it both ways. My view is this: The choice of assumptions can matter quite a bit when building models, especially in cases such as presidential elections where the historical sample sizes are small. We want to be more transparent about that. If polls-plus and polls-only show radically different results, that suggests the choice of assumptions matters a lot — something you deserve to know. And if they show highly similar results, that’s useful information also; it might give you more confidence in the robustness of our approach.
Which model is the official version of FiveThirtyEight’s forecast? They both are, and keep in mind that this will become something of a moot point because the models will converge toward each other. However, when you click on our forecast home page, you’ll see that polls-only is the default; we think it’s a better starting point in an election such as this one.
In addition to the polls-only and polls-plus forecasts, we’re also publishing something called a now-cast. The now-cast isn’t a forecast; it’s a hypothetical projection of what would happen if the election were held today.3 The now-cast is designed to be extremely aggressive about identifying trends in the polls, more aggressive than is optimal when forecasting an election several months out. (One of the big lessons of our model, in fact, is that you want to be fairly conservative about declaring turning points early in the race. Apparent shifts in the polls often reverse themselves.) As a result, the now-cast is subject to some fairly violent swings and will sometimes pick up more noise than signal. Still, it can provide for an interesting diagnostic of which candidate has momentum, however fleeting.
An Electoral College challenge for … Clinton?If the middling economy is one silver lining for Trump, another is his swing state polls, which don’t seem to be as bad for him as his national polls. They aren’t good by any means, either, but whereas Trump trails Clinton by 6.7 percentage points in our average of national polls, according to our polls-only model, he’s down 4.8 points in our adjusted polling average of Ohio, 5.7 points in Florida, 3.9 points in Iowa, and 2.0 points in Colorado, for instance.
Again, we don’t mean to suggest that these are great numbers for Trump; the Florida result, for example, would represent the worst loss by a Republican there since 1948. Nonetheless, and somewhat in contrast to the conventional wisdom, our model suggests that Trump is more likely to win the Electoral College while losing the popular vote than the other way around. (Though the chances of either scenario are small.)
Some of this may be because we just haven’t had all that much swing state polling; it’s possible we’ll see leads for Clinton in the mid- to high single digits as these states are polled more often. Just this morning, for example, the firm Evolving Strategies published a set of polls in swing states showing Clinton leading Trump by 10 percentage points, on average. If there are more numbers like those, the model will adjust accordingly.
But there’s another potential explanation, which is that Trump is badly underperforming in red states, presumably as a result of having failed to consolidate the Republican base. That may put some traditionally red states into play for Clinton. For instance, Arizona, Missouri, North Carolina and the 2nd Congressional District of Nebraska4 are all tossups, according to the polls-only model. (Polls-plus has Trump narrowly favored in these places.)
Some of these states could be useful to Clinton. Arizona, in particular, could help Clinton put together some winning maps based on Western or heavily Hispanic states, even if she loses much of the industrial Midwest. Others, such as Missouri, are probably more superfluous. They could potentially add to Clinton’s Electoral College margin, but they aren’t likely to be tipping-point states that make the difference between her winning and losing.
That goes doubly for states such as Texas, Utah, Kansas and Alaska, where polls have often shown a single-digit margin for Trump and have occasionally even had Clinton winning. Republicans are used to racking up huge numbers of votes in these states, bolstering their standing in the national popular vote. If Trump wins Texas by only 6 percentage points instead of 16, that will hurt his popular-vote margin without affecting his Electoral College odds much.
Is the reverse also true? Is Trump overperforming in blue states, relative to how a Republican usually does? It depends on where you look. The Northeast was Trump’s strongest region in the primaries, and he’s gotten relatively good numbers — although he still trails Clinton — in polls of New Jersey, Connecticut and Maine. (He also leads Clinton in one poll of Maine’s 2nd Congressional District, which would be worth one electoral vote.5) However, he’s losing by typical margins in New York and California, where he has vowed to compete.
Overall, the polls so far suggest a slightly less polarized electorate and a somewhat wider playing field than we’ve gotten used to in recent years. That’s a potentially refreshing change, although it may prove to be ephemeral as both Clinton and Trump have room to grow with their party bases and could gain ground in traditionally blue and red states as a result.
Undecideds are abundant, so uncertainty is highGiving Clinton a 75 percent or 80 percent chance of winning might seem bold. It’s actually fairly cautious, however, compared with what the model would normally say about a candidate with a 7-point lead.
That’s because Trump is at only 36 percent in our national polling average, while Clinton is at only 43 percent. Gary Johnson, the Libertarian Party candidate whom our model explicitly includes in the forecast, is polling in the double digits in some polls, while we’re seeing a significant undecided vote and some votes for other candidates, such as Jill Stein of the Green Party.
Historically, high numbers of undecided voters contribute to uncertainty and volatility. So do third-party candidates, whose numbers sometimes fade down the stretch run.6 With Clinton at only 43 percent nationally, Trump doesn’t need to take away any of her voters to win. He just needs to consolidate most of the voters who haven’t committed to a candidate yet.
Related:

A User’s Guide To FiveThirtyEight’s 2016 General Election Forecast
We’ve just launched FiveThirtyEight’s 2016 general election forecast, which projects how the 538 Electoral College votes could break down in the presidential election. The forecast will be continually updated through Election Day on Nov. 8. Here’s a bullet-point-style look at how it was built.
What’s new in the model since 2012?Not that much! It’s mostly the same model as the one we used to successfully forecast the 2008 and 2012 elections.There’s no special variable for Republican Donald Trump or Democrat Hillary Clinton. They’re treated the same as any other candidates would be with the same polling numbers.We built procedures to handle Libertarian Gary Johnson and other third-party candidates.We double-checked lots of assumptions and code.We’re now showing different versions of the model: the polls-only and polls-plus forecasts, and the now-cast (what would happen in an election held today).Major themes and findingsThink probabilistically. Our probabilities are based on the historical accuracy of election polls since 1972. When we say a candidate has a 30 percent chance of winning despite being down in the polls, we’re not just covering our butts. Those estimates reflect the historical uncertainty in polling.State polls > national polls. All versions of our models gain more information from state polls than from national polls.Errors are correlated. But while the election is contested at the state level, the error is correlated from state to state. If a candidate beats his polls to win Ohio, there’s a good chance he’ll also do so in Pennsylvania.Be conservative early and aggressive late. Fluctuations in the polls in the summer are often statistical noise or short-term bounces. The model is trained to be conservative in reacting to them. Fluctuations late in the race are more meaningful, and the model will be more aggressive.Three versions of the modelPolls-plus: Combines polls with an economic index. Since the economic index implies that this election should be a tossup, it assumes the race will tighten somewhat.Polls-only: A simpler, what-you-see-is-what-you-get version of the model. It assumes current polls reflect the best forecast for November, although with a lot of uncertainty.Now-cast: A projection of what would happen in a hypothetical election held today. Much more aggressive than the other models.Differences between polls-plus and polls-onlyPolls-plus combines polls with an economic index; polls-only does not.Polls-plus will include a convention bounce adjustment; polls-only will not.Polls-plus starts by assuming that likely voter polls are better for Republicans; polls-only makes no such assumption. Both models revise this assumption as more data becomes available.Polls-plus subtracts points from third-party candidates early in the race, while polls-only does not.Both models employ a regression that is based on demographics and past voting history. But polls-only weights the regression less and places less emphasis on past voting history.Polls-only accounts for more uncertainty than polls-plus.Polls-plus and polls-only will tend to converge as the election approaches.Differences between polls-only and now-castThe now-cast is basically the polls-only model, except that we lie to our computer and tell it the election is today.As a result, the now-cast is very aggressive. It’s much more confident than polls-plus or polls-only; it weights recent polls more heavily and is more aggressive in calculating a trend line.There could be some big differences around the conventions. The polls-only and polls-plus models discount polls taken just after the conventions, whereas the now-cast will work to quickly capture the convention bounce.Four major stepsAll versions of the model proceed through four major steps:
Step 1: Collect, weight and average polls.Step 2: Adjust polls.Step 3: Combine polls with demographic and (in the case of polls-plus) economic data.Step 4: Account for uncertainty and simulate the election thousands of times.Step 1: Collect pollsAlmost all state and national polls are included. If you don’t see a poll, it’s for one of these reasons:
The poll is very new, and we haven’t had a chance to add it yet.The poll was conducted directly on behalf of one of the presidential campaigns or an affiliated PAC or super PAC.The pollster is on FiveThirtyEight’s banned pollster list (pollsters we think may be faking data or engaging in other blatantly unethical conduct).The poll is listed under a different name. (Tip: FiveThirtyEight generally lists polls by the name of the polling company, not the media sponsor. So look for “Selzer & Co.,” not “Bloomberg Politics.”)Which poll version do we use?Sometimes, there are multiple versions of a poll. For example, results are listed among both likely voters and registered voters.
We prioritize polls as follows: likely voters > registered voters > all adults.If there are versions with and without Gary Johnson, we use the version with Johnson.All other ambiguous cases are considered ties. Sometimes, for instance, a pollster will publish results showing two likely voter models instead of one. Our program will average any such instances together.Calculating a weighted averageWe calculate a weighted average in each state, where poll weights are based on three factors:
FiveThirtyEight’s pollster ratings, which are based on a firm’s track record and methodological standards.Sample size. A larger sample helps, but there are diminishing returns.Recency, which is less important early in the campaign and becomes more important later on.When a firm polls a state multiple times, the most recent poll gets more weight, but the older polls aren’t discarded entirely. The trend line adjustment (see Step 2) also helps to put more emphasis on recent data.Step 2: Adjust pollsThere are five adjustments, listed here in the order in which the model applies them. (The trend line and house effects adjustments are generally the most important ones.)
Likely voter adjustmentConvention bounce adjustment (in only the polls-plus model)Omitted third-party candidate adjustmentTrend line adjustmentHouse effects adjustmentLikely voter adjustmentPolls of registered voters and adults are adjusted to be equivalent to likely voter polls.The adjustment begins with a default setting but changes as the model collects data on polls that list both registered and likely voter numbers.Historically, Republicans gain slightly in likely voter polls — a net of 1 to 2 percentage points — compared with registered voter or adult polls. Therefore, in the polls-plus model, the default is that likely voter polls slightly favor Republicans. The polls-only and now-cast models ignore this historical precedent and use a default of zero.But so far this year, Trump isn’t gaining ground on Clinton in likely voter polls. In several polls, Clinton has done slightly better in the likely voter version, in fact. Thus, this adjustment doesn’t have much effect right now.Likely voter polls tend to show fewer undecided voters.Convention bounce adjustmentHistorically, parties receive large but fleeting bounces in the polls after their party convention. For instance, Walter Mondale led Ronald Reagan 48-46 in one poll conducted just after the Democratic National Convention in 1984!The bounces have been smaller in recent years, but candidates can still come out “hot” after their conventions (e.g., McCain/Palin in 2008).The polls-plus model applies a convention bounce adjustment, subtracting points from a candidate’s polls just after his or her convention.Polls-only and now-cast do not apply an adjustment.As another line of defense, both polls-plus and polls-only weight polls less if they’re conducted in the immediate aftermath of the convention (but now-cast weights them fully).Polls-plus assumes that a modern-day convention bounce is worth 3 to 4 percentage points. But because the conventions occur back-to-back this year, the bounces could obscure each other.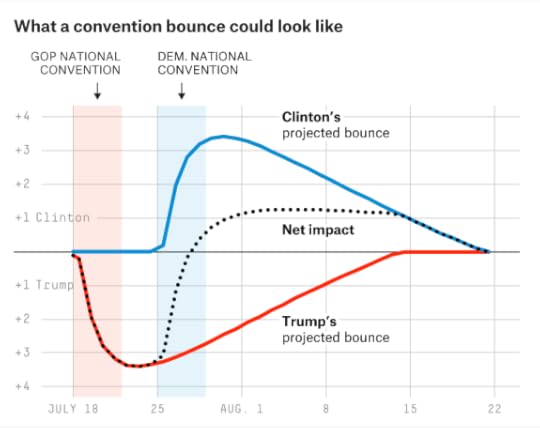 Omitted third-party adjustmentAlso known as the “missing Johnson adjustment.” Because our default is to use polls with Johnson, we adjust polls that don’t list him.The model estimates how much of Johnson’s support comes from the major-party candidates, instead of from undecided voters. (Answer: Relatively little support for Johnson is from undecided. Clinton and Trump both poll considerably lower in polls that include Johnson.)The adjustment assumes Johnson takes his support from Clinton and Trump equally.The adjustment differs in each state. It will take more points away from Clinton and Trump in states it perceives to be good for Johnson.Trend line adjustmentThe model detects movement in the polls by making comparisons between different editions of the same poll. For example, if Clinton is at 46 percent in the Quinnipiac poll of Florida in August and was at 43 percent in the same poll in July, that suggests she’s gained 3 percentage points. Likewise, if Trump’s at 41 percent in the Rasmussen national poll this week and he was at 40 percent last week, that suggests he’s gained 1 percentage point.The model runs this calculation for Clinton, Trump and Johnson separately. It’s possible for all candidates to gain (or lose) votes from undecided.By making an apples-to-apples comparison, this method removes a lot of noise.Next, the model takes these comparisons and draws a trend line from them using loess regression.Polls are adjusted based on this regression. For instance, if Trump led in a North Carolina poll by 1 percentage point in June, but the trend line shows him having gained 3 percentage points nationally since then, the model will treat the poll as showing him up by 4 percentage points. This calculation varies slightly from state to state based on a state’s elasticity score. More about this later.The question is how much smoothing to use in the trend line. Less smoothing = a more aggressive forecast.Empirically, using more smoothing early in the race and less smoothing late in the race works best. In other words, the trend line starts out being quite conservative and becomes more aggressive as Election Day approaches.House effects adjustmentHouse effects are persistent partisan “leans” in polls. For instance, Rasmussen Reports polls are typically Republican-leaning, relative to other polls.The model detects each polling firm’s house effect by comparing its polls to others of the same state.The model then subtracts a proportion of the house effect back out. The proportion depends on the number of polls each firm has conducted. For instance, say a pollster has a 3 percentage point Clinton-leaning house effect. The model might subtract only 1 point from Clinton if the firm has conducted only a few polls. But it might subtract 2.8 points if the firm has conducted dozens of polls, and the model had a very strong idea of its house effect.House effects are calculated separately for Clinton, Trump and Johnson. A pollster could have both a pro-Clinton and pro-Trump house effect if it tended to show few undecided voters, for instance.In calculating house effects, the model needs to determine what an average poll is, as a basis for adjusting the other polls. This average is weighted, based on each firm’s pollster rating. In other words, high-quality polls have more say in the house effects adjustment.Step 3: Combine polls with other dataThis is when we go from adjusting polls to actually forecasting what will happen in the Electoral College.We refine the forecasts by combining the polls with demographic and economic data.But there are a few technical steps first: Adjusting the third-party vote, allocating undecided voters and projecting the national popular vote.Adjusting the third-party voteHistorically, third-party candidates tend to underperform their early polls. Essentially, some third-party voters may really be undecided voters using the third-party candidate as a placeholder. (Note that third-party candidates do not necessarily underperform their late polls. This is more of a concern in the summer and early fall.)Therefore, early in the race, the polls-plus model will subtract some of the vote from the third-party candidate based on this pattern and reallocate it to undecided.The polls-only model and the now-cast do not do this. They leave the third-party vote as-is.Allocating undecided votersUndecided voters are split evenly between the major-party candidates. Empirically, an even split works better for presidential races than a proportional split.Late in the race, the third-party candidate will also get a share of undecideds.A small portion of the vote is also reserved for “other” candidates (e.g., Green Party candidate Jill Stein, etc.) in states where we expect four or more candidates to be on the ballot.Projecting the national popular voteIn all versions of the model, the national popular vote is held constant when combining polls with demographic data.For example, if Clinton is up by 5.1 percentage points nationally before the demographic regressions are applied, she’ll also be up 5.1 points after they’re applied.How do we project the national popular vote? There are two possible approaches: Top-down, using national polls, and bottom-up, estimating the national popular vote from state polls.The model uses a blend of both approaches but puts considerably more weight on the state polls strategy, which has been more accurate historically.In calculating the bottom-up estimate, the model controls for each state’s partisan voter index (PVI), a measure of how it voted in the past two presidential elections. Thus, it won’t be thrown off if we have lots of polling from blue states but little from red states, or vice versa.National polls versus state polls
To recap, the model mostly uses state polls. But national polls can influence the forecast in some subtle ways:
They’re helpful for calculating adjustments to the polls, especially the trend line adjustment and house effects adjustment.They’re used, in conjunction with the state polls, in estimating the national popular vote.Partisan voter index (PVI)We’ve been using the term “demographics” loosely. The most important factor in these regressions is not the demographics per se but instead the PVI — how a demographic group voted relative to the national average in the past two elections.Our PVI calculations are similar to those used by Cook Political Report, although we weight 2012 more heavily (75 percent) than 2008 (25 percent) instead of weighting them evenly.Our version of PVI also adjusts for home-state effects from the presidential and VP candidates. Historically, presidential candidates perform a net of 7 percentage points better in their home states. Because both Clinton and Trump are from New York, this effect cancels out this year! The VP candidate historically provides about a 2 percentage point boost to the ticket in his or her home state. We’ll add this to the model once the VPs are chosen.Calculating demographic regressionsInstead of using one regression model, we take three strategies, which range from more simple to complex, and blend them together. The reason for this is that the more complex methods (especially strategy 3) are subject to potential overfitting. Hedging the complicated methods with simpler methods produces a better result.
Strategy 1: Pure PVI. This works by taking the national popular vote estimate and adding a state’s PVI to it. For example, if Clinton’s up 4 percentage points nationally, and a state’s PVI is Democrat +5 percent, she’d be projected to win the state by 9 percentage points.Strategy 2: Regional regression. The adjusted polling average in each state is regressed on PVI and on dummy variables indicating which major region the state is in (Northeast, South, Midwest, West). Historically, this is the most effective approach. It can capture major changes in voting patterns from one election to the next, but doesn’t suffer from much overfitting. Regions are based on a combination of Census Bureau regions and political regions, as defined by FiveThirtyEight. Where they differ, a state is considered split between two regions. For example, Maryland is considered half Southern and half Northeastern by the model.Strategy 3: Demographic regression. We regress the adjusted polling average in each state on PVI and several other variables, mostly related to race and religion, that are pertinent in this year’s election. (This includes the percentages of voters who are black, Hispanic, Asian, non-Christian, evangelical Christian, Mormon and college graduates. It also includes an economic index for each state, showing change over the last 12 months.The regression employs a technique designed to remove spurious variables. Still, it’s vulnerable to some degree of overfitting.The polls-plus model uses a 30/50/20 blend of strategies 1, 2 and 3. That means the regional regression gets the most weight.Polls-only and now-cast do not use pure PVI, and instead use a 70/30 blend of strategies 2 and 3.So far, our regressions suggest that the electorate is slightly less polarized than in 2008 or 2012. Red states aren’t quite as red, and blue states aren’t quite as blue.Blending polls and regressionThe adjusted polling average in each state is combined with the regression. The regression estimate gets more weight early in the race and when there’s less polling. The regression gets 100 percent of the weight when there’s no polling in a state. The polling average can get as much as 95 percent of the weight late in the race in a state with abundant polling.Polls-only and now-cast give slightly less weight to the regression than polls-plus does.As a final step, the regression is recalibrated so that the overall national popular vote is unchanged. If a candidate gains ground in one state because of the regression, the model will necessarily have her lose ground in another.In other words, the purpose of the regression models is not to say the country’s demographics inherently favor Trump or Clinton. Instead, it’s to create a more realistic distribution of the projected vote across each state, especially in states with limited polling. We don’t want to have Clinton winning Kansas based on a single poll there, for instance, while she’s badly losing Nebraska.Calculating the economic indexIn the polls-plus model, the polls/regression blend is combined with an economic “fundamentals” index.Similar to how we calculated it in 2012, the economic index is based on the change in six frequently updated variables over the past year: jobs (nonfarm payrolls); manufacturing (industrial production); income (real personal income); spending (personal consumption expenditures); inflation (the consumer price index); and the stock market (S&P 500).The six variables are normalized to have the same mean and standard deviation then are averaged together, with each variable weighted equally. As of late June, the economy is a mixed bag. For example, income growth is slightly above-average (0.4 standard deviations above average), while industrial production has been slow (1.0 standard deviations below average). Overall, the economy is almost exactly average, relative to the past 50 years of data.The “fundamentals” forecastPolls-plus uses the economic index to calculate a “fundamentals” forecast, assuming that a better economy helps the incumbent party. For example, if the economic index was 0.5 standard deviations above average, it would have the incumbent party winning by 4 to 5 percentage points nationally.The fundamentals model also includes a variable to indicate whether an elected incumbent (such as President Obama in 2012) is running. Because there’s no elected incumbent this year, the model treats this factor as neutral.Therefore, because the economy is almost exactly average and because there’s no incumbent running, the fundamentals model has the race as a tossup.Blending polls and fundamentalsPolls-plus blends the fundamentals-based forecast with the weight assigned to fundamentals declining over time. Right now, 35 percent to 40 percent of the weight is assigned to fundamentals, but it will decline to zero by Election Day. (Highly technical note: Because fundamentals forecasts are subject to overfitting, the weight assigned to the fundamentals is constrained, based on a calculation derived from a 2014 paper by Lauderdale and Linzer.)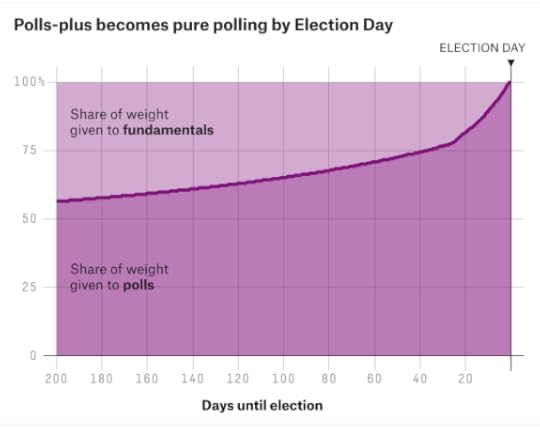 State elasticity scoresSuppose polls-plus assumes that the polls will move slightly toward Trump by Election Day — for instance, that he’ll go from trailing Clinton by 7 percentage points nationally to trailing her by 4 percentage points.Does that mean polls-plus just adds 3 points to Trump in every state? Not quite. Some states are more elastic or “swingy” than others. That is, they’re more sensitive to changes in the national trend.For example, New Hampshire is more “swingy,” because it has a relatively homogenous set of moderate, middle-income white voters.By contrast, Mississippi has relatively few swing voters. Instead, its vote is bifurcated between highly conservative whites and reliably Democratic African-Americans. It won’t change as much as the national polls do.States where one party is dominant (for instance, Massachusetts for Democrats or Utah for Republicans in a typical year) will also tend to swing less given changes in the national vote.Elasticity scores are calculated from individual-level voting records from the Cooperative Congressional Election Study (2012) and state-by-state exit polls (2008).Step 4: Simulate the electionThe final major step is to account for the uncertainty in the forecast and simulate the election.The uncertainty decreases as Election Day approaches.The error from state to state is correlated. If Trump significantly beats his polls in Ohio, he’ll probably do so in Pennsylvania also. Figuring out how to account for these correlations is tricky, but you shouldn’t put too much stock in models that don’t attempt to do so. They’ll underestimate the chances for the trailing candidate if they assume that states are independent from one another.Three types of error
Each simulation accounts for three potential types of error and uncertainty:
National error. The polls are systematically off throughout the country.Demographic and regional error. The polls are off in states that have demographic or geographic factors in common.State-specific error. The polls are off in a particular state, with no effect on other states.National errorIn each simulation, a random number is drawn to model national error. It’s applied to every state about equally, subject to that state’s elasticity score.The magnitude of the national error is based upon: The amount of time until the election (more time = more error); the number of undecided voters (more undecideds = more error); and the number of third-party voters (more third-party votes = more error).Because there’s a significant undecided and third-party vote, national uncertainty is higher than usual this year.Demographic and regional errorSome states’ outcomes are more correlated than others. For instance, if Trump beats his polls in Minnesota, he’ll probably also do so in Wisconsin. But that might not tell us much about Alabama.The model simulates this by randomly varying the vote among demographic groups and regions. In one simulation, for instance, it might have Trump beating his polls throughout the Northeast. Therefore, he wins Maine, New Hampshire and New Jersey. In another simulation, Clinton does especially well among Hispanics and wins both Arizona and Florida despite losing Ohio.The simulations are conducted from a file of more than 100,000 voters, built from the exit polls and CCES.The following characteristics are considered in the simulations: religion (Catholic, mainline Protestant, evangelical, Mormon, other, none); race (white, black, Hispanic, Asian, other); region (Northeast, South, Midwest, West); party (Democrat, Republican, independent); and education (college graduate or not).To get a better sense of how this works, here’s a correlation matrix drawn from recent simulations. You can see the high correlation between Wisconsin and Minnesota, for example.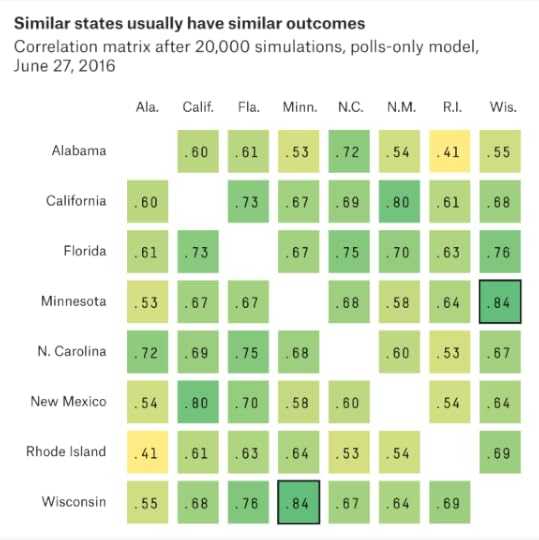 State-specific errorFinally, the model randomly adds additional error specific to one state at a time.A state has more state-specific error when it has fewer polls.It also has more error when polls and demographics disagree. If the regression models and the adjusted polling average show significantly different results — such as in a state like Utah, for instance — that contributes to uncertainty.And states have more state-specific error when they have smaller populations. Small states usually have more demographic idiosyncrasies than larger ones; that makes them harder to poll and harder to model based on patterns we see elsewhere in the country.Odds and ends
That’s basically it! But we’ll conclude with a few odds and ends:
We usually run at least 20,000 simulations for each version of our model each day. That’s a lot, but it still produces a small amount of sampling error. You shouldn’t worry too much when win probabilities change by less than a percentage point.We simulate the vote by congressional district in Maine and Nebraska, which award one electoral vote to the winner of each district and two electoral votes statewide. Where available, district-level polling is used in these forecasts.If no candidate receives a majority of electoral votes, the model assigns the election to Trump half the time (because Republicans are very likely to control a majority of congressional delegations if the election is close) and to the winner of the popular vote the other half of the time.Our distributions have fat tailsNational error, regional error and state-specific error are drawn from a probability distribution. Specifically, they’re drawn from a t-distribution (with 10 degrees of freedom).The t-distribution has fatter tails than a normal (bell curve) distribution. That means it assigns shorter odds to “extreme” outcomes. For example, if a normal distribution laid odds of 50-to-1 against an event, a t-distribution would have it more like 30-to-1 against. And if a normal distribution assigned odds of 1,000-to-1 against, the t-distribution would have it more like 180-to-1 against.The t-distribution is theoretically appropriate given the small sample size. The model is based on only 11 past elections (from 1972 through 2012). We don’t have enough data to really know how the tails behave: whether a candidate trailing by 15 points on Election Day has a 1, 0.1 or 0.01 percent chance of winning, for example. The t-distribution makes more conservative assumptions about this.Handling the third-party voteMost of the procedures I’ve described for Clinton and Trump are also applied for Johnson, but there are some exceptions.The regression-based estimates are simpler for Johnson. Instead of demographics, his vote is modeled based on his vote in 2012, the third-party vote from 1980 through 2008 (i.e., the Perot/Anderson vote), and a state’s PVI.There’s no demographic/regional error for Johnson, only national error and state-specific error. Recent third-party candidates have tended to rise or fall in all states together.The model uses a combination of a beta distribution and a t-distribution to model Johnson’s vote. That produces some funky, right-tailed distributions that look like this: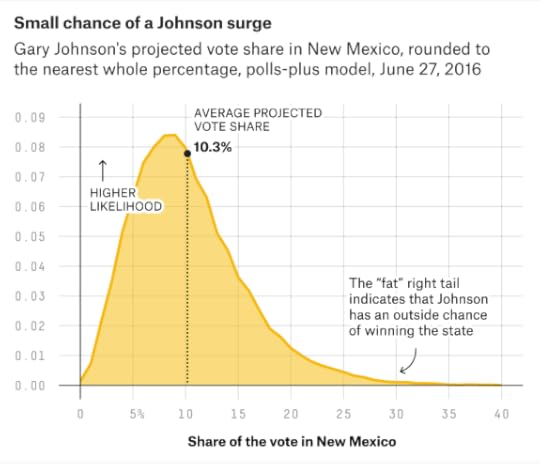 Third- and fourth-party ballot accessWe assume parties will have ballot access in any state where they’ve already secured ballot access, or where they had ballot access in 2012 and the ballot access deadline has not yet passed this year.As applied right now, these rules imply that Johnson will be on the ballot in all 50 states and Washington, D.C. We’ll revisit them if and when he misses ballot access deadlines.The rules also imply that there will be at least one fourth-party candidate (e.g., Stein) on the ballot in every state except Georgia, Indiana, Montana, North Carolina and Oklahoma.Errors and omissions?We try to avoid tinkering with the model once it’s published, but we’re always on the lookout for bugs, especially in the first week or two after the model is released.If there are any significant changes to the model, we’ll disclose them here.If you see something that looks wrong, drop us a line at polls@fivethirtyeight.com.

June 27, 2016
What The Model Knows (Live From San Francisco)
Listen to the latest episode of the FiveThirtyEight elections podcast.
Subscribe: iTunes |Download |RSS |VideoLast week, the elections podcast crew descended upon San Francisco to eat burritos and discuss politics. We talked about the latest from the U.K. and D.C. — and Nate described how his general election forecast is shaping up. Plus: the latest round of Harry Enten vs. Nate Silver elections trivia, and the greatest fan mail we’ve ever received.
Here's the letter we read on stage at our San Francisco show. Answers on this week's elections podcast. pic.twitter.com/L2nLIiq0ZC
— Jody Avirgan (@jodyavirgan) June 27, 2016
You can stream or download the full episode above. You can also find us by searching “fivethirtyeight” in your favorite podcast app, or subscribe using the RSS feed. Check out all our other shows.
If you’re a fan of the elections podcast, leave us a rating and review on iTunes, which helps other people discover the show. Have a comment, want to suggest something for “good polling vs. bad polling” or want to ask a question? Get in touch by email, on Twitter or in the comments.

June 21, 2016
‘Dump Trump’ Is Doomed, But We Can’t Take Our Eyes Off It
In this week’s politics chat, we consider the “Dump Trump” movement, fueled by Donald Trump’s chaotic campaign. The transcript below has been lightly edited.
David (Firestone, managing editor): Suddenly we’re seeing wildfires on the interstate to Cleveland. Some anti-Trump delegates are hoping to use the convention rules to #dumpTrump, and they’re even hiring lawyers and advisers. Is this a real thing, or yet another Bill Kristolline fantasy?
Harry (Enten, senior political writer): I think Clare can speak to the seriousness more than I can, but I can say that this isn’t just Kristol spouting off. Yes, he has his fantasies, but there’s more than just a handful of delegates who are talking about this stuff. Probably not close to a majority, but more than a handful.
Clare (Malone, senior political writer): I was at the beach on Friday when all this broke and not checking the internet. This story … surprised me when I finally came back to civilization, let’s say that.
Nate (Silver, editor in chief): I don’t think it’s a real thing yet. I’m debating whether it’s on the verge of being a real thing or on the verge of being on the verge of being a real thing.
I think it’s a verge-and-a-half away, roughly.
David: OK, let’s just assume for a moment that it might be real. How would it even work? How can you bend the rules to negate the wishes of millions of GOP voters?
Clare: I think it’s going to be REALLY difficult, even if they pass the proper rules that would allow people to “vote their conscience” (maybe I shouldn’t use scare quotes for that), for those “Dump Trump” people to get enough Trump-sympathetic delegates to defect, which they would need if they want to swing things.
Nate: In a technical sense, it isn’t that complicated. It’s a party meeting, and the delegates to the meeting can rewrite the rules basically however they want. If they want to dump Trump, they can.
The questions are whether it would be at all wise to do so and whether enough delegates on the floor — and in advance of that, on the rules committee — would want to do so.
Harry: The way this works, in my opinion, is if you can get the voters to agree with this. That’s the problem in the first place. Whether you like Trump or not, he earned a majority of delegates. How can delegates change what seemed to be an honest process?
Clare: They will be essentially disenfranchising the primary voters, which, if I were a GOP delegate, I would think long and hard about. It’s a bit of a political/moral question, isn’t it? The rule of the people versus the rule of the elites! Is this the 18th century or what?! We’ve been having the same arguments for centuries now. It’s just that we have Taylor Swift-dating-conspiracy theories to distract ourselves with these days.
Nate: Yep. The voters chose Trump. And it wasn’t all that close in the end. You could argue the case up through mid-April or so, when he was squeaking by with some pretty narrow pluralities. But Trump won a majority in every contest from New York onward. That was a pretty clear mandate from the voters.
David: I’m a little worried that the media is seizing on these stories because we’re all so desperate for the drama of a floor contest. Trump deprived us of our dream!
Harry: I think that’s a great point, David. You know there was all that talk about a contested convention, and it made folks like Nathaniel, Clare, you and me giddy. Then after that faded, some people latched onto the idea of a contentious Democratic convention. Now that seems like it’s not going to happen. So here we are, back to Trump again.
Clare: I think you might be onto something there, too. Cleveland seems pretty locked to me, but people love a good Trump headline. And to be fair to these Dump Trumpers (oof, bad name), a lot of them are diehard Cruz people or party activists who are sincere in their efforts. But when it comes to the evaluation of their actual plan, well … it seems less plausible than it is interesting. We might just be looking for some red meat for the interwebs.
Yeah, Harry — I lost so much of my brain space learning delegate rules, all for naught!
Nate: Part of it is also a sort of denial/coping mechanism, I think.
Clare: Are we all working through some stuff? Should we do an office retreat to a spa? Take the cure in Bath?
Harry: I say we should just get some ice cream and call it a day.
David: On the other hand, it’s not hard to see why delegates might be considering changing their minds. The campaign Trump has run in the last few weeks seems stunningly unprofessional. And the news that he can’t be bothered to even raise money must be scaring even a few of his diehards.
Nate: Trump’s had a rough start to the general election, to be kind, and in some ways is confirming anti-Trump Republicans’ worst fears about what sort of candidate he might be. But that doesn’t mean you can wave a wand and stuff the genie back into the bottle. A very luxurious bottle, the best bottle, I might add.
David: He has a million dollars of cash on hand. (OK, $1.3 million.) As our own Walt Hickey pointed out, the musical “Hamilton” made in two weeks what Trump pulled during May. How is this guy going to compete against the Hillary Clinton machine?
Clare: Well, this is where the earned media strategy is really tested, right? And as I said on the podcast the other day, I’m honestly befuddled as to what Trump’s general election campaign will look like. Is he going to visit all those factories and coal country places he’s always talking about? Do they even have enough B-roll of him shaking hands with the hoi polloi to make a decent campaign issues ad?
Harry: Why has this chatter started again? I go back to what I wrote on Monday about why Trump fired his campaign manager, Corey Lewandowski. Trump stuck with him until the polling started to stink. And I think plenty of Republicans see the polling, see Trump isn’t a big-time conservative and wonder, “Why the heck should we nominate this guy?”
Nate: Well, the cynical interpretation is that he stumbled into a strategy which, by some combination of gut instinct and sheer luck, just so happened to be a perfect strategy for the unusual circumstances of the Republican race in 2016, where you had 17 candidates running, a party leadership in disarray, a plurality of the electorate inclined to buy into racially coded messages, and so forth. But that Trump strategy isn’t very adaptable, and that it wouldn’t be a good strategy under very many other circumstances.
David: Still, it’s one thing to man the dump truck, and another to come up with an actual alternative. How do you start a convention rebellion without a candidate to lead it? And who might that candidate be?
Clare: I read something about how there are some GOP-ers who are considering the strategy of putting big-name spoiled candidates of the Republican persuasion on the ballot in certain states in the hopes of ruining Trump’s chances and thus throwing the whole thing to Clinton (e.g., Tom Ridge in Pennsylvania). This seems a bit… cannibalistic if you’re a Republican, but I suppose it speaks to the desperation in certain corners.
Harry: Well, this is the funny thing, right? Trump isn’t all that popular with Republicans. CNN had a poll out on Tuesday showing only 51 percent of Republicans would choose Trump versus 48 percent who would choose another nominee, but you cannot beat someone with no one. This white knight probably couldn’t unite Republicans. There are many reasons not to like Trump if you’re a Republican.
Nate: We have to mention that #nevertrump failed repeatedly at earlier points when the path was less uphill. And there were a lot of reasons for that, but the main one was maybe the failure to consolidate around an acceptable alternative. That’s no less of a problem now, and maybe more so.
Moreover, whichever candidate was picked would face a potentially huge penalty from all the Trump voters who were super pissed off about their guy being ousted. You can’t take polls from a couple months ago showing Kasich beating Clinton, for instance, without discounting them significantly to account for the fact that Kasich can only become the nominee if there’s a coup at the convention.
David: Could someone possibly arise from the ashes of the primaries? Just thinking about that dark period of 17 candidates sends a shiver down the national spine.
Harry: Who would the candidate be? Unless it’s Jim Gilmore, I don’t think any of these candidates have the power. (Note: Even my favorite, Gilmore, probably couldn’t do it.)
Clare: My god, it seems unlikely, but the Cavs won the NBA championships against the Warriors, so anything is possible (gratuitous Cavs ref? Check!)
I wonder if Dump Trump had started like … two months earlier, if it might have had some traction. Or even, a month earlier.
Nate: I’d think Ted Cruz and Paul Ryan are the two most obvious alternatives.
Cruz did a lot of work back in March and April at state conventions to ensure favorable delegate slates. A lot of the people in the hall will be loyal to him, personally. Enough to oust Trump? That’s not clear, and we’re doing some reporting on that. But they’ll be way more loyal to Cruz than to any other candidate, apart from Trump.
And I say Ryan just because he’s the de facto party leader and really sort of the last man standing if everything goes REALLY haywire. If Trump dropped out on his own volition, it might be Ryan, for instance.
But Cruz is more likely, I still think, for some of the reasons I explain here.
Clare: Paul Ryan, if he’s smart, won’t sully himself with any Hail Mary nomination attempt this year.
David: Cruz will probably be hanging out at Clare’s parents’ house near Cleveland, just waiting for the phone to ring. But to your point, Clare, Ryan is still as diffident as ever, insisting he’s not the guy. I take it you’ve never really believed that, Nate?
Nate: Look, I think all of this talk is far-fetched. As Harry said earlier, it would be different if there was evidence that the majority of GOP voters wanted to dump Trump. Or that Trump himself didn’t want the nomination.
Harry: Yes, I think we need to keep in mind that this probably isn’t the final presidential election ever. Why risk trying to alienate a Republican electorate that voted for Trump? It’s silly considering that right now the economy is OK and Obama is fairly popular.
Clare: I think a lot of this stuff is a coping mechanism of political types — makes them feel like they’re doing something productive as they see Trump’s polling slipping and his finances looking subpar.
Nate: Right. At some point, what’s the best way to Stop Trump? Well, you endorse Hillary Clinton … or Gary Johnson. Those are drastic measures, but no less drastic than trying to deny the will of your own voters. Then you campaign like hell for your congressional candidates.
Clare: Bush is out on the trail for House candidates! He’s taking Nate’s advice.
Harry: Let me ask a question: Why is it then that the betting markets have Trump at only about an 85 percent chance to win the nomination? What are people seeing that we aren’t?
Nate: It’s a very hard thing to model, Harry. My intuition is that 85 percent is considerably too low on Trump. In fact, those betting markets now give Trump almost as much chance of not being the nominee (15 percent) as of becoming president (18 percent), which seems wrong!
Clare: I thought numbers didn’t lie, you guys.
Nate: It’s a hard thing to model. I just very much doubt that those markets reflect any inside knowledge. (Among other reasons, because there’s nowhere near enough money to be made from them. It’s not very attractive to bet $100, and tie up your money, for the chance to win $5. but betting $5 for the chance to win $100 is pretty fun.) Instead, I think they reflect a slightly amplified version of the conventional wisdom.
BTW, those markets also give Hillary Clinton about a 5 percent chance of not being the Democratic nominee, which also seems way too high.
Harry: Perhaps we should divide each of those numbers by 5? So Trump has a 3 percent chance of not being the nominee and Clinton a 1 percent chance?
Nate: I don’t mean to disparage political betting markets, which are an incredibly useful resource that we cite all the time, but in terms of the amount of money at stake, they’re small potatoes as compared to sports betting markets, or other ways to gamble on the outcome of the race. (Think Trump’s going to be president? Buy defense stocks, canned goods and real estate in Vancouver.)
There’s also some evidence that these markets historically have a long shot bias, i.e., they overrate the probability of unlikely events.
Clare: Because … they’re gamblers.
David: Aren’t donors gamblers, too? And doesn’t Trump’s abysmal money haul suggest that they’re not willing to gamble on Trump?
Clare: I’ll take David’s excellent transition bait: Yeah, donors are gamblers in a sense, but perhaps Trump just seems too much of a wild card. One moment, it seems like maybe he could polish up, professionalize, and the next moment he’s whipped out his dog whistle and is polishing that.
Harry: Well, all I know is I don’t gamble. I have an addictive personality.
Nate: But to some extent, Clare, that whipsaw coverage of Trump is another reason to be skeptical of #DumpTrump efforts. He’s “only” down 5 or 6 points and people have overcome those sorts of margins before. The conventional wisdom may shift back to more of a glass-half-full mentality within a few weeks.
Clare: Right, I think people’s knickers are in a twist right now, though, because this is one of the first times in a long while that we’re seeing Trump down in polls. There’s some sticker shock attached to that.
Harry: I think David gets at the point here. The polls are one thing. It’s also that there’s no logical reason for a gambler to think he can come back in his or her eyes.
David: There’s all this talk that Trump is too lazy or proud to fundraise. But that seems like just a piece of the problem. He’s built a political base that doesn’t have a lot of disposable income to donate, and the hedge-fund guys don’t really have a big problem with Clinton.
Clare: Insert Bernie Sanders campaign line here.
Nate: I mean, I could come up with a compelling-sounding two-paragraph explanation for why Trump has pretty much no chance whatsoever. And I could come up with an equally compelling explanation for why he really has a pretty good shot. The conventional wisdom tends to careen between those two extremes, because there’s a lot of information to process and Trump is so unusual in so many ways.
The truth is probably somewhere in between, of course. Trump has an uphill battle, and a landslide is possible, and we probably shouldn’t pretend he’s just a “normal” candidate. But it’s awfully early and it’s much too soon to rule anything out.
Harry: Remember, Dukakis led at this point over Bush by a fairly wide margin in 1988.
Clare: I mean, in some ways, if Trump remains at this big of a fundraising deficit, this election is going to become about the power of pop culture and cultural id (Trump) vs. traditional campaigning as a persuasive force to change minds. Which is going to be more compelling? TV ads, or the reputation and aura of a single individual? (This is if you subscribe to the theory that Trump’s is a singular, personality-driven campaign in a way that’s pretty unique.)
David: The Lewandowski theory.
Clare: Right. This is like a live-action American Studies course. The power of advertising versus the power of reality TV. (This is not the de Tocqueville portion of American studies, sadly.)
Harry: The reason Trump can win is because among other reasons Clinton is quite unpopular.
Nate: In a sense, both candidates have work left to do. Clinton’s only at about 43 percent in the polls right now. Of course, Trump’s only at 37 percent, which is a lot worse.
Harry: I think that’s perhaps the biggest sign that there could be some interest in a Dump Trump. Some polls, like the CBS News poll, had him winning only 73 percent among Republican voters. Now a number of polls are better than that, but to see a major party candidate running for president getting only 73 percent of his own base is something else.
David: Presumably, she’s going to have to do more than just give speeches like today’s, where she tried to scare voters with a vision of Trump ravaging of the economy. When does the inspiration phase begin?
Nate: At the conventions, in large part. Which, by the way, is another reason that #DumpTrump is risky. There’s a good chance that a DumpTrump effort would fail to actually dump Trump, and yet turn the convention into a total dumpster fire.
Harry:
Clare: I
am
getting
so
sick
of
that
meme
SO
SICK
OF
IT
Find something new, internet.
Harry: Clare, I think you have an illness and the only cure is more dumpster fire.
David: And yet the dumpster was not consumed.
Clare: THAT is real deep, David.
Maybe Reince and the rest of the GOP establishment should reclaim the meme and take comfort — the party will survive!
David: What if Trump hires a decent speechwriter and actually moves the convention delegates? As you say, Nate, the conventions are the moment to begin making your case. Could he still pull that off?
Harry: Many bad candidates became good ones after successful conventions. I’m thinking Bush in 1988 or Clinton in 1992.
Nate: On the one hand, convention bounces have gotten smaller over time and voters already have a very strong impression of Trump, which makes it hard to move the needle. On the other hand, he has a lot of room to grow and the media will be eager to write the Trump comeback narrative after several weeks of very critical coverage.
Harry: There’s one thing Trump has said that I agree with: People love a winner. And being a winner equals being successful. The question of course is how does that happen? How does Trump turn from a loser to a winner? The first step, of course, is to truly unify that base. The other step, I think, is for Trump to shred the cartoon version of himself. Many people in the middle aren’t paying attention yet. Or at least not to a great degree. The problem is that Trump is so well-known. His words are repeated over and over again. That makes me a bit skeptical that a convention can really give voters new information.
Nate: The other thing, though, is that it’s the Republican convention … and Trump isn’t particularly conservative, and isn’t particularly Republican. He’s certainly not a good match for some of the movement conservatives that Cruz recruited to be convention delegates. That’s why it’s so … surprising/amazing that the GOP picked him. He’s both an extremely problematic general election nominee and a problematic standard-bearer for the party in terms of upholding its policy platform.
Clare: Yeah, Harry, that strategy would require Trump to plumb some depths. I’m not saying he doesn’t have them but it’s been really difficult to get him to move past superficial talking points. I have a hard time imagining what Trump policy talk looks like. I’m sure it’s going to happen in some form or another, but whether or not it gets deep enough to persuade undecideds is something I’ll be really interested to see.
Listen to the latest episode of the FiveThirtyEight elections podcast.
https://serve.castfire.com/s:5L8r1/audio/2811132/fivethirtyeightelections_2016-06-20-183832.64k.mp3?ad_params=zones%3DPreroll%2CPreroll2%2CMidroll%2CMidroll2%2CMidroll3%2CMidroll4%2CMidroll5%2CMidroll6%2CPostroll%2CPostroll2%7Cstation_id%3D4278Subscribe: iTunes |Download |RSS |VideoNate: I’d put it like this. I don’t know how much magic Trump can work at the convention. But it’s one of his best/only chances to reintroduce himself to America. If Dump Trump tries and fails, it could make the convention a shitshow and make it really hard for him to do that. In fact, close turns things into sorta the worst of all possible worlds, where Trump is still the nominee but the party is even more split, and good luck getting any sort of a convention bounce.
Clare: Thank you for using “shitshow” instead of “dumpster fire,” Nate.
David: Well, political writers will have a legitimate shot this year at the Pulitzer for best original drama. Thanks for joining us this week.
Harry:
Nate:
Clare: Screw you guys.

June 20, 2016
British Referendum Polls Are A Mess
This week’s elections podcast jumps across the pond to discuss the British referendum on whether to leave the European Union. Tom Clark, chair of the Guardian’s editorial board (and newly appointed editor of Prospect, a London-based magazine), shares the latest polls and helps explain why those numbers can be all over the place in the U.K. Stateside, the podcast politics crew also tracks Donald Trump’s recent tumble in national polls.
P.S. The podcast will be on the road later this week! We’ll be in San Francisco on Thursday and Los Angeles on Saturday. More information is here.
https://serve.castfire.com/s:5L8r1/audio/2811132/fivethirtyeightelections_2016-06-20-183832.64k.mp3?ad_params=zones%3DPreroll%2CPreroll2%2CMidroll%2CMidroll2%2CMidroll3%2CMidroll4%2CMidroll5%2CMidroll6%2CPostroll%2CPostroll2%7Cstation_id%3D4278Subscribe: iTunes |Download |RSS |VideoYou can stream or download the full episode above. You can also find us by searching “fivethirtyeight” in your favorite podcast app, or subscribe using the RSS feed. Check out all our other shows.
If you’re a fan of the elections podcast, leave us a rating and review on iTunes, which helps other people discover the show. Have a comment, want to suggest something for “good polling vs. bad polling” or want to ask a question? Get in touch by email, on Twitter or in the comments.

June 14, 2016
Can Trump And Clinton Transform The Electoral Map?
In this week’s politics chat, we entertain crazy/not-so-crazy ideas about where the battleground will be in the 2016 presidential election. (Utah? New Jersey?) The transcript below has been lightly edited.
micah (Micah Cohen, politics editor): Clare is on vacation …
natesilver (Nate Silver, editor in chief):
June 13, 2016
How We Categorize Tragedies Like Orlando
The day after the deadliest mass shooting in U.S. history, the elections podcast takes stock of how politicians are responding and the words members of the media are using. FiveThirtyEight’s lead news writer Carl Bialik talks about how we categorize these tragedies and how those categories — terrorist attack, mass shooting, hate crime — often overlap. Also, the crew discusses the idea, put forward by some commentators, that a terrorist attack could boost Donald Trump’s poll numbers.
On a different note, we added a new live show to our California mini-tour: We’ll be in Los Angeles at the Crest Theater with our friends from “The West Wing Weekly” on Saturday, June 25. More information here.
Here’s a transcription of part of our conversation, lightly edited:
Jody Avirgan: Carl, this was classified almost immediately as a terrorist incident, a mass shooting and a hate crime, among other things. So let’s start with terrorist incident. Why was this so quickly called terrorism?
Carl Bialik: I think there are a few factors here. We knew that the suspect had called 9-1-1 and pledged allegiance to ISIS. And evidence emerged from his father and from some other people about his hatred, specifically hatred towards gay people. And using this act as a way to incite terror in the U.S., among the gay community, it seemed that the evidence was that he had a goal of inciting terror with this shooting.
Jody: And then it was called a hate crime pretty quickly. President Obama used the word “hate”; Hillary Clinton used the term as well. Why was that label applied?
Carl: The shooter targeted a nightclub where gay people were celebrating and he had expressed a hatred for gay people. With some terrorist incidents, the details of who the person is attacking are not important to that person. It’s more about killing or injuring some people to frighten others. But in this case, the suspect seemed to be targeting, very specifically, a group of people whom he had expressed hatred for.
Now, one thing to note about both of the categories you’ve asked about is that they have legal definitions as well, and sometimes we can get confused because those specific legal charges aren’t added to a case. In this [instance], the suspect is dead. There won’t be any case against him, so that won’t come into play.
Jody: What’s the right language you try to use around something like this, or any incident when so many people die from gun violence?
Carl: Unfortunately this one, by any definition, would fall into the mass shooting [category]. What ends up being contested ground is: Do there need to be four people who were killed, or just four people who were killed or injured? (I say “just,” but that’s still a horrific tragedy when it happens.) But there’s a difference between an incident that’s extremely rare and happens usually fewer than five times a year in the U.S. and an incident that happens almost every day in this country.
This is the worst mass shooting in U.S. history, by either definition of a mass shooting. But even that gets contested because there’s a history of massacres of Native Americans and blacks in riots.
I think this falls into the category of the much rarer kinds of events we think of, like the Charleston church shooting or San Bernardino or the [Umpqua] Community College [in Oregon]. But to the people who define a mass shooting as an incident where at least four people are injured, that happens 300, 400 times a year.
Clare Malone: Carl, you wrote an article that went up this weekend about how more and more terrorist attacks are using guns. And I was just wondering when specifically we started to see this uptick.
Carl: Thankfully, in the U.S., these incidents are rare enough that it makes it a little hard to pinpoint. But it’s really been in the last few years that there have been deadly incidents like this using guns, claiming many lives in one attack. Now, what I was looking at specifically was among deaths caused by terrorists in the U.S. In about the last five years, deadly incidents of terrorism have increased and the number of people killed in them has started to increase. It’s also important to keep in mind that even after the horrific incident in Orlando, these numbers are still well below both the numbers of people who died from guns in the U.S. and the number of people in the world who die from terrorist incidents involving guns. There are countries where there are deaths from terrorists using guns almost every day. Whereas in the U.S. these are still pretty rare events.
Nate Silver: Yeah, and this is a case where you have to be a little bit careful of that statistic. It’s true that something like 85 percent — and it’ll go up as a result of Orlando — 85 percent of deaths caused by terrorism in the U.S. since 9/11 have been the result of guns. But there’s both a numerator and a denominator there, right? The numerator is the number of deaths caused by terrorists using guns, and that’s horrific and it’s going up, but the denominator is also the fact that there haven’t been very many terrorist incidents that don’t involve guns. That is partly a result of success — at least we think, maybe we’ve been lucky — in preventing terrorists from doing things like having access to explosives, from bombing things, from hijacking airplanes, from having access to chemicals, to weapons of mass destruction.
So it’s horrific, but if you talk to terrorism experts, the stakes are much higher when you have the potential to access planes as weapons, or when you have the potential access to weapons of mass destruction (obviously). So it’s kind of a new category for Americans. We had very few terrorist attacks, and the ones we had were what Al Qaeda used to call “spectacular”: killing hundreds or thousands of people at a time.
Carl: Getting a gun and preparing to use it, learning how to use it — these are things that more people can do. And more people who read about Islamic State or other groups and agree with their ideology, without having to connect with them or get any instructions from them, could carry out attacks. There are still a lot of vulnerable gatherings of people. So the lone wolf has that potential in a country where a lot of people can access dangerous firearms.
Jody: The data around hate crimes is notoriously spotty and under-reported, so I’m just wondering what we think we need in order to have a clear-headed conversation about moments like this.
Carl: A lot of [hate crimes] don’t get reported at all to police, and then police don’t always consider them hate crimes even if the victim does. And that can change over time. So what might look like an increase in hate crimes might just be a greater awareness of them. It could be a change in state law that encourages or discourages more people to report them, depending on whether the penalties and the enforcement gets stiffer or weaker. Whether these are on the rise or whether we’ve just grown more aware of them and created the language to describe them — it’s very hard to separate those things.
Jody: And just to add some context there: Only about 11 percent of law enforcement agencies nationwide reported a single hate crime in the last FBI report. The Department of Justice and FBI are trying to train agencies to be better at that. The Southern Poverty Law Center has written that LGBT people are far more likely than any other minority group to be victimized by violent a hate crime. They’re about 2 percent of the population and account for about 17 percent of violent hate crimes.
But again, these stats are really spotty and it’s hard to make progress on this if we don’t know how to quantify the problem.
You can stream or download the full episode above. You can also find us by searching “fivethirtyeight” in your favorite podcast app, or subscribe using the RSS feed. Check out all our other shows.
If you’re a fan of the elections podcast, leave us a rating and review on iTunes, which helps other people discover the show. Have a comment, want to suggest something for “good polling vs. bad polling” or want to ask a question? Get in touch by email, on Twitter or in the comments.

June 7, 2016
Will Trump Screw Up Everything We Know About Elections?
In this week’s politics chat, we examine what we know about how presidential elections work — or, what we think we know — and whether Donald Trump upends the apple cart. The transcript below has been lightly edited.
micah (Micah Cohen, politics editor): Let’s talk about Trump and what he means for the political science interpretation of elections. There are a lot of research-based maxims, but will they apply here?
To start us off: What are the main poli-sci maxims?
harry (Harry Enten, senior political writer): “It’s the economy, stupid.”
micah: How about: Partisan identification is the overwhelming driver of vote choice. And relatedly: The candidates don’t matter that much.
julia (Julia Azari, associate political science professor at Marquette University and FiveThirtyEight contributor): So I’d divide the poli-sci approaches into three rough camps: Group No. 1 focuses on the economy, as Harry said. The economy is what we like to call a valence issue; everyone wants a better economy. On the other hand, there’s camp No. 2, which focuses on party identification and polarization. How often are Democrats going to vote for a Republican because of the economy (or vice versa), in other words? The “campaigns matter” crowd falls into this group because campaigns help inform voters about which candidates share their positions. And finally, there’s group No. 3, which is much smaller, who see campaigns, events and other what we like to call “stochastic factors” as the main drivers of election outcomes.
And now everyone knows why political scientists are so much fun at parties — we use words like “valence” and “stochastic” to describe simple ideas.
micah: What about the idea that it’s really hard for a party to keep the White House for three consecutive terms?
natesilver (Nate Silver, editor in chief): I’m going to get in a lot of arguments with you guys about the two-term curse, which is based on a sample size of post-World War II elections and doesn’t really hold up at all if you look before that.
julia: Bring it! (You are certainly right about pre-WWII.)
natesilver: But I think it’s safe to say that political scientists agree there’s a significant advantage in being an elected, first-term incumbent (as President Obama was in 2012) and then there’s less agreement about what happens after that.
julia: Yes. One prominent forecasting model, Alan Abramowitz’s “time for change,” takes into account exactly that.
harry: You mean the “time for change” model that decided to include a polarization ad hoc variable, which proved to provide a less accurate forecast in 2012?
julia: Ha, yeah, that one.
micah: Shots fired!
natesilver: Guys, let’s not debate individual models. There’ll be plenty of time for that later.
micah: OK, so let’s take the idea that party ID is so determinative. There’s been a lot of talk about white, working-class Democrats voting for Trump and better-educated, suburban Republicans, particularly women, voting for Hillary Clinton. Is there evidence partisanship will be less of a driving factor this year?
harry: There’s not much evidence of that at this point, Micah. Trump is coalescing Republican support like prior Republicans. The question to me is more along the lines of whether people who had identified as Republicans no longer identify as Republicans or independent-leaning Republicans.
julia: I have two thoughts that sorta dodge this question in two ways. First, I think the sort of evidence that would address that directly is not fully available yet, though polling gets more predictive as we get closer to the election (the sky is also blue, the pope also Catholic).
Less tautologically, and with the caveat that Harry’s right about Republican support, one wonders if the campaign will reveal Trump to be some weird hybrid of a Republican and a third-party candidate because his views are so out there.
It’s hard to identify flat-out lack of preparation on policy issues on the left-right spectrum, but I’ll submit that this lack of preparation makes it more likely that Trump deviates (more than he has already) from standard party positions.
And there’s the whole “not actually a Republican” thing. I think it may matter that this is a pretty unique party candidacy.
micah: It’s hard for me to imagine Trump’s support among Republican women who live in the suburbs of Philadelphia being completely normal.
natesilver: I’d also point out that the advantage in partisan turnout and enthusiasm can vary quite a bit from election to election, and we don’t know a lot about how it will look in 2016 yet. There might be a lot of grudging Trump or Clinton voters who are showing up in registered voter polls, but who aren’t liable to show up to vote.
julia: Lots of talk about suburbs, but don’t most suburbs trend blue? (Except the ones a few miles from me here in Milwaukee!)
micah: There are lots of Republican suburbs in the Sun Belt too. The Southwest. The South.
harry: It’s still early, but Arizona looks vaguely competitive, which would be a sign that something is different this year. In 2012, Republican Sen. Jeff Flake of Arizona — he’s not a fan of Trump — nearly lost his bid for the U.S. Senate. And polls show both John McCain and Trump potentially in trouble out there.
julia: True. I would think the Atlanta suburbs or Phoenix ones might be more of an issue than Philadelphia.
micah: Yeah, that’s fair.
All right, so I’m going to pronounce the partisanship-drives-everything rule “shaky” in the age of Trump.
natesilver: Well, that might be going too far, Micah. There’s very strong evidence that polarization and partisanship have been on a historic uptrend. It’s one of the most important facets of American politics in the past quarter-century. There’s a question as to when and whether that trend might reverse itself, and whether 2016 could be a manifestation of that in some ways. And there are some technical questions as to how you measure partisanship and how it might affect how you build an election model. But I’d say the partisanship-drives-everything rule is holding up pretty well right now, including the House speaker endorsing the GOP candidate despite denouncing him for having made racist statements.
micah: Next up: It’s the economy, stupid.
julia: I learned a lot listening to Ben Casselman talk about this on the elections podcast. One thing that strikes me is that economic indicators are really ambivalent. A recent book by Marc Hetherington and Tom Rudolph suggests that polarization has brought with it some serious motivated reasoning when it comes to assessing the state of the economy. The president’s partisan supporters look at the indicators of strength; opponents find indicators of weakness. The “soft recovery” from the 2008 recession is especially susceptible to that.
micah: Interesting … so now the economy gets filtered through a partisan lens?
harry: Yes, I mean, I guess I’m not surprised by that. Everything goes through a partisan lens these days.
julia: Yes. Hetherington and Rudolph find that while partisanship is not a complete substitute for reality, Republicans and Democrats have pretty different perceptions of whether things have improved or not (they also look at national security), and this, in turn, affects how much people trust the government.
While I’m aggressively political science-ing here, I’d like to mention a qualitative study I’m reading about politics in Wisconsin, “The Politics of Resentment” by Katherine Cramer. She spent time talking to rural voters in Wisconsin, and there are lots of interesting points raised, but one is that people’s economic perceptions are not clearly distinct from their cultural identities and other non-economic attitudes. These things are often tied together.
I don’t know if Trump’s support taps into that exactly, but his main two talking points are trade and racial resentment/xenophobia.
natesilver: We can get into some relatively technical territory — or not — in terms of how you translate the economy into a forecast. At a very basic level, a strong economy helps the incumbent party and a weak economy hurts it. But the relationship is rougher than some of the models imply, in part because there are so many different objective and subjective ways to measure the economy.
julia: Yeah, this is one of the oldest debates in the forecasting literature and the economic voting literature more generally — is it GDP, employment, income/wealth, etc.? Perceptions of the economy in general or personal financial situation?
harry: Indeed, I’d argue that part of what a campaign is about is convincing voters that a candidate’s views on the economy are correct. That is, when the different measures conflict.
julia: “Are you better off than you were four years ago?”
natesilver: With a small sample — only like a dozen elections — I’d argue there’s really no way to know exactly which economic variables move the needle. Using some sort of economic composite is best, in my opinion (I have strong feelings about this), and that’s what FiveThirtyEight’s model does. Even then, the confidence intervals are fairly wide if you’re calculating them in the right way. Ben Lauderdale and Drew Linzer are good on this point.
harry: I think this year, as Ben Casselman pointed out on the podcast, there isn’t any real clear sign of where the economy is pointing. If it was really negative, then Trump losing would show that he upended the fundamentals. Conversely, if he won with the economy cruising along, it would suggest that perhaps he is a really good candidate. Instead, I think this is the perfect year where a good or bad candidate can break a party’s shot of winning.
And so far the evidence is that Trump is more bad than good.
julia: That’s a great point there, Harry.
One thing that I keep coming back to is that I think in some ways a Trump defeat is overdetermined. This is good news if you are someone who is terrified of a Trump presidency, but bad news if you’re someone interested in the substance of elections. I’m not just interested in which economic indicators make the best forecasts, but also in the question of why someone would cast a particular vote and what it means for parties and governance going forward.
micah: So that brings us to another maxim: Candidates/campaigns don’t matter that much. (Although maybe that’s a bit of a straw man?)
natesilver: I dunno if it’s that much of a straw man. I’ve gotten pretty deep into a couple of #nerdwars about it before.
julia: Agreed about the straw man issue. The study of presidential politics is like the worst experiment ever. Not enough repeat candidates to really get a sense of whether candidates matter. Like, we can probably conclude that Henry Clay, Adlai Stevenson and William Jennings Bryan were bad candidates.
harry: Heck, I’d even quibble about Stevenson.
julia: RIGHT! You try running a successful campaign against an affable, shape-shifting general who won World War II.
micah: Haha.
natesilver: In Senate and gubernatorial elections, where you have a much larger sample size, there’s evidence that candidates matter quite a bit. Or at the very least, that there are large residual effects that aren’t well-explained by fundamentals.
The argument is that presidential elections are different, though, because the nomination is a hotly contested, difficult process, which tends to produce good (or at least decent) candidates.
harry: And that’s what makes Trump so interesting. Most think Trump isn’t a good candidate.
micah: What are good candidate qualities and what are bad ones?
julia: Yes. And we are brought to the question of whether presidential campaigns are unique. This is especially interesting this year since the gender variable has now been introduced in the same study as the “random non-party xenophobe.” I would seriously fail someone if they turned this in in a research design class.
natesilver: If Trump loses by like 9 percentage points, though, isn’t that pretty strong evidence for “candidates do matter”? And if he wins or at least comes super close, isn’t that strong evidence that they don’t? I know it’s just one data point, but it’s a pretty darn interesting data point given that the “fundamentals” of the election are otherwise close.
julia: I’ve been giving this a lot of thought, and there was some useful psychology research that I referenced in my piece on electability a while back.
I think there are some straightforward ones: experience, perceptions of intelligence, authenticity. I also think perceptions of these characteristics are gendered and raced as hell.
harry: I would add that time in elected office is a big one in a lot of models that try to measure this. Trump, of course, is a zero on this score.
julia: Yeah. A lot of political science studies use previously held office as a measure of candidate quality. I’m working on something related to this right now … stay tuned/get excited!
natesilver: There may be some basic blocking-and-tackling stuff that Trump gets wrong, owing to a lack of experience as a candidate. And although you can cite counterexamples like Jesse Ventura or Arnold Schwarzenegger, in general those cases are the exceptions, and candidates without elected experience tend to do poorly relative to the fundamentals. Then again, Trump won the primaries, which is a significant feat.
So a big question is: Are the factors that allowed Trump to win the primaries pertinent to the general election, or were they unique to the Republican Party circa 2016?
julia: Yeah, I think what brings those three candidates together and distinguishes them from many other nonprofessionals is having some media experience.
natesilver: That’s interesting, yeah.
julia: Maintaining my dodging theme: I think the factors that allowed Trump to win the primaries are relevant, but not determinative.
natesilver: All three arguably took advantage of flukish circumstances, too. Schwarzenegger winning in a recall election with dozens of candidates on the ballot. Ventura being against two very unpopular opponents. Although, this reasoning gets circular. “Trump won because all the other candidates stunk” is sort of tautological.
julia: Plausible counterfactual outcomes to the 2016 race is an analysis that deserves more attention, I think.
micah: All right, are we missing any other maxims?
julia: I think the person who gets the most votes will probably win. (Though not necessarily!)
harry: Ronald Reagan had never won elected office before becoming governor of California. And yes, he was involved in politics, but Ventura (a small-town mayor) and Schwarzenegger were also involved in Republican politics for years, if not elected. So sometimes these guys can be stronger than we let on. Trump is arguably the least involved in actual politics of any of these guys, however.
natesilver: So let me ask an annoying question. Personal preferences aside, is there an outcome that would be better or worse, from the standpoint of the political science consensus?
harry: I guess the question ultimately comes down to: What is the political science consensus? I know that PollyVote, which is run by political scientists and averages all sorts of different types of forecasts, has Clinton as a favorite right now.
natesilver: Yeah, but that’s cheating by looking at polls and betting markets. The “fundamentals” models mostly show a tossup, or maybe even generic Republicans as a slight favorite.
micah: Wouldn’t Trump losing by 6 to 8 percentage points be a sign that some of the normal rules apply? Candidate quality matters, for instance.
If the economy stays so-so, we won’t get a good verdict on that.
julia: I hesitate to refer to anything as a political science “consensus,” but the fundamentals approach is pretty popular. However, the ambivalence of the fundamentals obscures the risks for political science. If Trump won despite the fundamentals favoring Clinton, then we’d probably implode.
Listen to the latest episode of the FiveThirtyEight elections podcast.
https://serve.castfire.com/s:5L8r1/audio/2778925/fivethirtyeightelections_2016-06-06-203225.64k.mp3?ad_params=zones%3DPreroll%2CPreroll2%2CMidroll%2CMidroll2%2CMidroll3%2CMidroll4%2CMidroll5%2CMidroll6%2CPostroll%2CPostroll2%7Cstation_id%3D4278Subscribe: iTunes |Download |RSS |Videoharry: I think we should be clear that there are plenty of political science models that look at the polls, so I don’t want to call it “cheating.” There’s more than just the economic fundamentals as far as political science is concerned.
julia: Oh yeah, even the most fundamental models take some polling into account — presidential approval if not election polls.
natesilver: Which is also cheating!
harry: I’d argue, for instance, that the president’s approval rating is a pretty big “fundamental,” and Obama’s approval rating is up and based on a regression (admittedly with a small sample size) would have Clinton favored.
micah: OK … closing thoughts.
natesilver: In my view, Trump’s a pretty good test of how much candidates matter. If he loses big in what should otherwise be a close election, that’s evidence that they matter quite a bit. And I’d argue that would go more against the political science consensus than toward it, although Julia’s absolutely right that it’s hard to define what the consensus is.
julia: My final thoughts: ambiguity and ambivalence are the watchwords of this political moment. Close elections, strong partisanship/polarization, new horizons in types of candidates. I’d also argue that both parties are moving on from the Reagan/New Democrat era, and so there’s murkiness about what the next sets of political debates (like in the general sense, not like podiums and moderators) will be.
natesilver: I also agree with Julia that Trump is extremely overdetermined. He’s unusual in so many ways. If he loses big — or wins big — we might be able to say that it had something to do with Trump, but we might not be able to say why, exactly.

June 6, 2016
Hillary Clinton Will Be Nominated Because More Democrats Are Voting For Her
It’s an emblematically annoying ending to the Democratic campaign, one that reflects both the acrimony between Hillary Clinton and Bernie Sanders and the fact that Clinton, in the end, is winning her party’s nomination by every available measure.
At 8:20 p.m. EDT on Monday night, the Associated Press declared Clinton to be the presumptive Democratic nominee based on her having accumulated 1,812 elected (pledged) delegates and 571 superdelegates, for 2,383 total delegates, exactly the number needed to win the nomination. In the overwhelming likelihood that Clinton’s nomination is confirmed at the Democratic convention in Philadelphia next month, she will officially become the first woman nominated for president by a major American political party.
In a statement released after the AP’s call, the Sanders campaign argued that the media is wrong to declare Clinton the presumptive nominee by including superdelegates, correctly pointing out that superdelegates can change their vote up until the convention, as several dozen superdelegates did in flipping from Clinton to Barack Obama in 2008. FiveThirtyEight’s pledged delegate count, which does not include superdelegates, has Clinton with 1,8111 pledged delegates to 1,526 for Sanders. The Sanders campaign said its “job from now until the convention is to convince superdelegates that Bernie is by far the strongest candidate against Donald Trump.”
But Sanders’s statement — and the AP’s call — distract from the larger point. Clinton will be the Democratic nominee because substantially more Democrats have voted for her. In addition to her elected delegate majority, she’s received approximately 13.5 million votes so far in primaries and caucuses, as compared with 10.5 million for Sanders.
Nor, after a strong run of contests for Sanders in late March and early April, is there much sign of forward momentum for Sanders. Over the past seven weeks, from the New York primary on April 19 through Puerto Rico on Sunday, Clinton has won 505 pledged delegates as compared with 428 for Sanders. Her current lead in our national polling average, 14.4 percentage points, is the widest it has been since mid-February.
On Tuesday, Clinton will almost certainly clinch majorities of elected delegates and the popular vote. Suppose that Sanders, who currently trails Clinton by a narrow 5 percentage points in our California polling average, were to win the state by 20 percentage points instead. Even in that case, Sanders would still trail Clinton nationally by almost 200 elected delegates and about 2 million votes, depending on turnout in California.
In fact, Clinton can still win an elected delegate majority provided that she wins just 215 of the remaining 714 pledged delegates available on Tuesday and in the District of Columbia’s primary next week, or 30 percent. Because Democratic delegate allocations are highly proportional to the vote share in each state, that means she’d need only about 30 percent of the vote. Thus, even if Sanders won every remaining contest 70-30 — by 40 percentage points — he’d still only roughly tie Clinton in pledged delegates and even then would very probably still trail her in the popular vote.
There are not many plausible arrangements under which Sanders would have become the Democratic nominee. He’s been aided by caucuses, which have much lower voter participation. He’d trail even if all states had open primaries, which are generally favorable to Sanders. If the Democratic race were contested under Republican rules, with no superdelegates but winner-take-all delegate allocations in states such as Florida and Ohio, Clinton would have clinched the nomination long ago. Clinton has won in those states where the turnout demographics most closely resemble those of the Democratic Party as a whole.
So it’s not just that Sanders can only win if a huge number of superdelegates flip their vote to him.2 He can win only if a huge number of superdelegates who have committed to Clinton flip their vote against her, despite her having won a clear majority of votes and elected delegates, thereby overturning the popular will.
But the AP’s “call” of the race, which has been confirmed by several other news organizations, means that superdelegates, rather than elected delegates, will have put Clinton over the top, removing some of the theatrics from Tuesday night’s elections. Clinton had scheduled a “victory rally” in Brooklyn on Tuesday night, on the assumption that the networks would call the race for her on the basis of elected delegates in New Jersey, where Clinton is heavily favored and where polls close at 8 p.m. (Clinton will almost certainly clinch a pledged delegate majority once the first batch of votes are reported in California late on Tuesday night, but that may not be an event the networks commemorate or that viewers stay awake for.)
The early call could also have somewhat unpredictable effects on Tuesday’s turnout and results. It probably won’t matter much in California, where many or most votes are cast by mail and cast early — but it could potentially matter in New Jersey, along with smaller contests such as South Dakota and New Mexico.
In the end, none of this will be enough to affect the outcome of the Democratic nomination, which has been fairly obvious since March. But Clinton needs support from Sanders voters or she could face a close call in the general election against Donald Trump. Any sense from Sanders or his voters that the system was “rigged” in her favor or that she won the nomination illegitimately — however ill-informed — could be harmful to her at the margin.
Still, even if the final 36 hours of the campaign don’t quite go as Clinton would have scripted them, she’s going to win the nomination and is the betting favorite to become the next president. Neither she nor Sanders, who has run a good campaign, have much to complain about.

Nate Silver's Blog

- Nate Silver's profile
- 730 followers

