
Nate Silver's Blog, page 129
July 21, 2016
Only 20 Percent Of Voters Are ‘Real Americans‘
We’ll be reporting from Cleveland all week and live-blogging each night. Check out all our dispatches from the GOP convention here .
CLEVELAND — “It’s been a rough year for the media experts,” Willie Robertson of “Duck Dynasty” said at the Republican National Convention this week. “It must be humbling to be so wrong about so much for so long.”
“But I have a theory about how they missed the Trump train,” he continued. “They don’t hang out with regular folks like us who like to hunt and fish and pray and actually work for a living. Heck, I don’t even know that they know how to talk to people from middle America.”
There’s been a lot of this talk at the RNC, about “real” Americans and “regular” Americans and how they’re the ones who make America great. When it’s not focused on the media, it’s usually directed at Hillary Clinton.
This real Americans stuff isn’t new; instead, it’s part of the populist tradition. The segregationist governor George Wallace of Alabama, a Democrat, regularly employed this sort of rhetoric. And at a 2008 fundraiser in Greensboro, North Carolina, Republican vice-presidential nominee Sarah Palin spoke of the “small towns that we get to visit … in these wonderful little pockets of what I call the real America.”
These politicians, implicitly and often explicitly, usually have certain people in mind when they refer to “real Americans.” They often mean white people without college degrees — the so-called “white working class.” They usually mean practicing Christians. Their examples usually refer to people in the South or the Midwest — not East Coast elites or West Coast hippies.
If you’re one of these “real Americans,” you’re in the majority in almost every respect. Most Americans are white, most are Christian, most don’t have college degrees, and most live in the South or Midwest Census Bureau regions. And yet, only about 1 in 5 voters meets all of these descriptions.
This helps to explain what seems like a paradox. “Real Americans” overwhelmingly voted Republican in the 2012 election. The differences might be even more pronounced this year. And yet, President Obama won re-election four years ago. And Clinton leads Donald Trump in the polls, albeit narrowly.
We can be more specific about this using the 2012 edition of the Cooperative Congressional Election Study, which surveyed more than 50,000 people.
Overall, about 48 percent of voters in the survey said they voted for Mitt Romney over Obama, closely matching Romney’s actual percentage of the vote.1 Among non-Hispanic white voters, however, Romney’s share rises to 56 percent.2 And among white Christians, it was 66 percent.
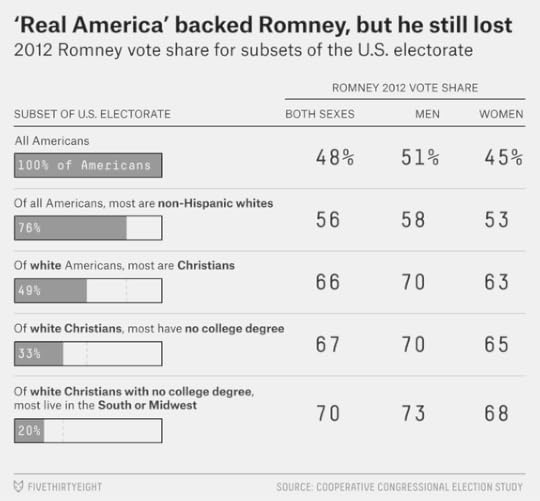
Because of the survey’s large sample size, we can home in even further. Among white Christians without college degrees who lived in the South or the Midwest — what we’re calling “real Americans” — Romney won 70 percent of the vote.
We can also consider gender, although it’s a tricky issue in this context. Mathematically speaking, men are a minority of the electorate. But populist candidates (including Trump) tend to attract more male than female support, and they often lionize predominately male occupations or activities. “Real American” men gave 73 percent of their votes to Romney in 2012, and Trump might get an even higher percentage this year.
But putting so many requirements on what it means to be a “real American” means that a lot of people are left out. Overall, “real Americans” made up only 20 percent of the electorate in 2012. And “real American” men were just 9 percent of it.
Related:

July 20, 2016
Nate Silver And Molly Ball Talk The Future Of The GOP
We’ll be reporting from Cleveland all week and live-blogging each night. Check out all our dispatches from the GOP convention here.
If Donald Trump wins in November, the Republican Party will be his for the foreseeable future. But what happens if he loses? I talked with politics writer Molly Ball of The Atlantic about whether the GOP can put the pieces back together in a post-Trump world.

July 19, 2016
If Americans Perceive A World In Chaos, Will They Turn To Trump?
We’ll be reporting from Cleveland all week and live-blogging each night. Check out all our dispatches from the GOP convention here .
CLEVELAND — The mood here in Cleveland is a little bleak. The city still has its share of vibrant neighborhoods, but it can feel awfully empty. The city accommodated a population of more than 900,000 in 1930, but Cleveland has fewer than 400,000 residents today. (Imagine if more than half the people in your town just vanished.) Then there’s the convention, and the security presence it brings, with downtown bisected by a maze of fences and patrolled by a phalanx of police, sheriffs and Secret Service personnel. Conventions don’t have the party atmosphere of major sporting events or ticker-tape parades; they’re stiffly staged, anxiety-inducing events, and most locals are staying away.
Donald Trump’s campaign, of course, has also struck a foreboding tone. It’s typical for the opposition party to dramatize the country’s problems, as a critique of the incumbent president’s performance. But not since Richard Nixon has a major-party candidate so explicitly run on a law-and-order theme, or so determinedly argued that the world is spinning out of control.
Polls suggest that many Americans agree with Trump: About 70 percent of them say the country is on the wrong track, and the percentage has gradually climbed this year. There’s also some contradictory evidence. A plurality of Americans say they’re better off personally than they were eight years ago, for instance, and President Obama’s approval ratings are decent, the highest they’ve been since after his re-election in late 2012.1 But put those doubts aside for a moment and assume that most Americans really do agree with Trump’s diagnosis of the problem and that they’re anxious in a way that they haven’t been since the Sept. 11 attacks. Does that mean they think Trump is the solution? Or will there be a flight to the safety of Hillary Clinton? It isn’t so clear.
I compiled data from the most recent telephone polls by ABC News, Bloomberg Politics, CBS News, CNBC, CNN, NBC News, Pew Research Center and Quinnipiac University, all conducted since the California primary on June 7. Each of them asked respondents whether they preferred Trump’s or Clinton’s approach on a series of major issues — for instance, terrorism and immigration. The items that were mentioned in at least three surveys are included in the table below.
ISSUEPREFER CLINTONPREFER TRUMPMARGINRace relations62%27%Clinton +35Foreign policy5733Clinton +24Health care5234Clinton +18International crisis5436Clinton +18Middle class4836Clinton +12Immigration5041Clinton +9Trade4642Clinton +4Guns4341Clinton +2Terrorism4447Trump +3Economy/jobs4148Trump +7Who will Americans trust if the world is in crisis?Source: Average of recent polls from ABC NEWS/WASHINGTON POST, BLOOMBERG POLITICS, CBS NEWS/New YORK TIMES, CNBC, CNN, NBC NEWS/WALL STREET JOURNAL, PEW RESEARCH AND QUINNIPIAC
Trump has a narrow edge on terrorism (and it grows a bit larger if polls ask about the Islamic State group specifically). But Clinton has an almost 2-to-1 advantage on foreign policy and on the handling of race relations. She leads by 18 percentage points on handling an unnamed international crisis. She also has an edge on immigration, which Trump has tried to tie to terrorism and crime. Neither candidate has an advantage on guns. Recent polls haven’t asked explicitly about crime.
One can also look at how head-to-head results between Clinton and Trump have changed as various frightening events have taken place around the world and in the United States, but they don’t tell a consistent story. In the Republican primaries, Trump appeared to gain after the San Bernardino and Paris terrorist attacks. But the general election may be different. Trump got some of his worst polls of the year shortly after the Orlando terrorist attack last month. He has drawn closer to Clinton recently, after shootings of police officers in Dallas and in Baton Rouge, Louisiana, but the impetus for that may be the renewed focus on Clinton’s email server instead.
An increasing number of these events have involved multiple threads that provide talking points for all sides: Orlando was a terrorist attack, but also a mass shooting and a hate crime, for instance.
So we simply don’t have a lot of evidence yet about which candidate would benefit from further domestic and international crises or the perception that the world is in chaos. And in some ways, with Trump having committed to the law-and-order strategy, the major strategic choices belong to Clinton. Does she pursue an LBJ-in-1964 strategy, suggesting that a tumultuous world requires her experience and steadiness of hand? Does she present a happier and more hopeful face, on the assumption that (as some studies have claimed) the more optimistic message usually wins? Or could she get stuck in between?

Nate Silver And John Dickerson Talk About Melania Trump’s Borrowed Speech
We’ll be reporting from Cleveland all week and live blogging each night. Check out all our dispatches from the GOP convention here .
Nate Silver, the editor in chief of FiveThirtyEight, sat down with John Dickerson, host of the CBS News show Face The Nation, to talk about the first day of the Republican National Convention, and whether there will be any effect from the accusations that Melania Trump plagiarized a portion of a 2008 speech by Michelle Obama.

Election Update: Clinton’s Lead Is As Safe As Kerry’s Was In 2004
There has been a lot of polling over the past few days in advance of the Republican National Convention, which got underway Monday in Cleveland. But it mostly confirmed the conclusion our election forecast models had arrived at late last week: Hillary Clinton leads Donald Trump by 3 or 4 percentage points. That’s down from a lead of 6 or 7 percentage points a few weeks ago.
As a result, Trump’s odds have improved. He has a 36 percent chance of winning the election, according to our polls-only forecast, and a 38 percent chance according to polls-plus. (While the polls-only and polls-plus forecasts are well aligned now, they may begin to diverge during the conventions — more about that in a moment.)
But Clinton remains ahead of Trump in the clear majority of polls. She leads by about the same margin that Barack Obama did heading into the conventions in 2008, and by a somewhat larger margin than Obama did in 2012.
I’ve nevertheless detected a lot of consternation among Clinton voters: Why isn’t her position safer? There’s really about a 35 or 40 percent chance that Trump will become president?
Based on the polls, we think the model is setting those odds about right. The race is a long way from being a toss-up, but a 3 or 4 percentage point lead heading into the conventions isn’t all that reliable, either. While Obama won twice with pre-convention leads of about that margin, John Kerry went into his convention with a lead of about 3 percentage points in 2004, but lost to George W. Bush. And in 2000, Bush had about a 4-point lead on the eve of the conventions, but lost the popular vote to Al Gore. (Bush won the Electoral College, of course.)
The flip side is that the recent polls could just as easily prove to be a low-water mark for Clinton. Conventions have oftentimes helped the incumbent party’s candidate. One of the biggest turnarounds came in 1988, when Michael Dukakis, the upstart winner of the Democratic nomination, held a lead of 6 or 7 percentage points going into the conventions. But a well-staged Republican convention in New Orleans helped to unify the GOP and highlight the successes of George H.W. Bush and Ronald Reagan, and Bush eventually won by a landslide.
What’s relatively safe to say is that we’ll know a lot more in a month or so. Below, you’ll find a comparison of where national polls stood heading into the challenging party’s convention, and then 30 days after the incumbent party’s convention.2 (By tradition, the incumbent party — Democrats this year — holds their convention last.) The pre-convention polls missed the final margin in the race by an average of 6.4 percentage points. By contrast, the post-convention polls missed it by 4.0 points, a considerable improvement. And since 1972, they’ve gone 11-for-11 in identifying the winner of the popular vote.
POLLING AVERAGEYEARHEADING INTO CONVENTIONS30 DAYS AFTER CONVENTIONSACTUAL RESULT1972Nixon +16.0Nixon +29.7Nixon +23.21976Carter +13.0Carter +4.0Carter +2.01980Reagan +6.0Reagan +2.6Reagan +9.71984Reagan +14.3Reagan +16.8Reagan +18.21988Dukakis +6.7Bush +3.0Bush +7.71992Bush +1.0Clinton +11.7Clinton +5.61996Clinton +16.8Clinton +16.0Clinton +8.52000Bush +4.3Gore +2.0Gore +0.52004Kerry +2.7Bush +1.8Bush +2.52008Obama +3.8Obama +3.1Obama +7.32012Obama +2.3Obama +1.9Obama +3.9Polls become much more accurate after the conventionsBut there are a couple of important caveats. One is that the conventions are being held much earlier than usual this year. There are 103 days between the conclusion of the Democratic convention on July 28 and the election on Nov. 8. By contrast, there were just 61 days separating the conventions and the election in 2012. The campaign is going to feel really long, and there will be several extra weeks for the poll numbers to gyrate around.
By far the more important qualification, however, is that while you should be keenly interested in what the polls say a month or so from now, you ought to be careful in the interim. That’s because the conventions have historically been associated with large, but sometimes temporary, bounces in the polls. Walter Mondale briefly moved into a near-tie with Ronald Reagan in 1984, for example, in an election he eventually lost by 18 percentage points.
In recent years the size of convention bounces has declined; instead of bounces that sometimes ran into the double-digits, they’ve been more like 4 percentage points instead. The bounces have also become harder to measure because, beginning with the 2008 cycle, the incumbent party began to hold its convention immediately after the challenging party, instead of waiting several weeks. That doesn’t give a lot of time for pollsters to measure the challenging party’s convention bounce.
In theory, that means the convention bounces could mostly cancel one another out. Our model assumes they’ll look something like this:
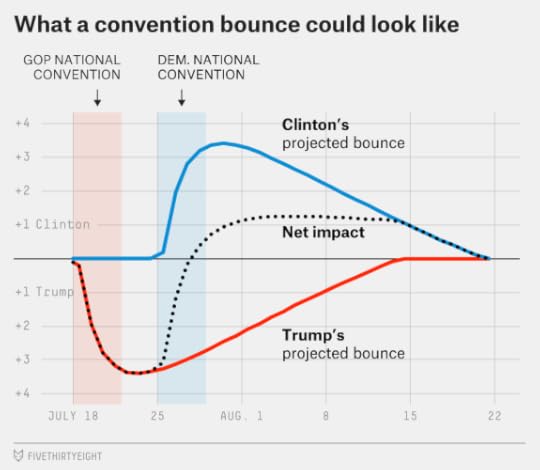
It would be a bad sign for Trump if he can’t at least tie Clinton in polls conducted in between the RNC and the DNC. Since recent convention bounces have averaged 3 or 4 percentage points, and Trump trails Clinton by 3 or 4 points now, that would suggest he’d had a below-average convention bounce. And it would certainly be a bad sign for Clinton if she doesn’t lead after her convention, since she both holds the lead going into the conventions and gets to hold her convention last.
Beyond that, you should read the polls with some caution over the next few weeks. Convention bounces may not be as crazy as they once were, but in both 2008 and 2012, the incumbent party came out “hot” after the conventions. John McCain and Sarah Palin briefly pulled into the lead in national polls after their 2008 convention in Minnesota, but that bounce soon dissipated. In 2012, Obama’s lead peaked at about 5 percentage points after the conventions, and it proved to be more durable, although still with some fluctuations along the way.
Related:July 18, 2016
A Trumpian Convention
The elections podcast crew is broadcasting from Cleveland! The rules committee appears to have put an end to the “dump Trump” campaign, delegates have approved a staunchly conservative party platform and the city has stocked up on riot gear in anticipation of protests. It’ll be an interesting week.
Nate Silver, Clare Malone, Harry Enten and Farai Chideya join Jody Avirgan to discuss what to expect from a week of pageantry, protests and over-caffeinated media.

You can stream or download the full episode above. You can also find us by searching “fivethirtyeight” in your favorite podcast app, or subscribe using the RSS feed. Check out all our other shows.
If you’re a fan of the elections podcast, leave us a rating and review on iTunes, which helps other people discover the show. Have a comment, want to suggest something for “good polling vs. bad polling” or want to ask a question? Get in touch by email, on Twitter or in the comments.

July 15, 2016
Election Update: 10 Questions About Where The 2016 Race Stands
Donald Trump has significantly improved his position in our general election forecasts as a result of state and national polls that show declining numbers for Hillary Clinton. Trump now has a 36 percent chance of winning the election, according to our polls-only forecast, and a 37 percent chance according to polls-plus, which also considers economic conditions.
With the conventions upon us — the Republicans’ starts Monday in Cleveland — let’s step back and ask some big-picture questions about where the race stands.
Who’s ahead in the polls right now?Despite a relatively poor run of polls, Clinton is very probably still ahead of Trump right now. That doesn’t mean she’d be assured of winning an election held today, let alone one in November — there’s a lot of uncertainty (see the next question for more about this). But polls-only has her ahead of Trump by 3.4 percentage points nationally, similar to the margin by which Barack Obama beat Mitt Romney in 2012.
If Clinton has a 3.4-percentage-point lead, as our model surmises, that means we’ll sometimes see national or swing state polls that show her ahead by margins in the high single digits, such as the set of swing state polls that Marist College released this morning. We’ll also see some polls showing Trump with narrow leads, like the polls Quinnipiac University released earlier this week. All of this is pretty normal.
It’s not quite correct to characterize the race as a tossup, however. A relatively emphatic majority of recent swing state and national polls still have Clinton ahead, but often by narrower margins than before.
What’s the degree of uncertainty?High, or perhaps very high, for a variety of reasons. As I noted above, the race isn’t that close — Clinton is matching Obama’s 2012 margin.1 But it’s early, so the outcome is highly uncertain. That uncertainty cuts both ways, meaning that Clinton could easily lose to Trump, and she could also easily end up winning in a landslide.
One reason for the high level of uncertainty is that polls are showing both a large number of undecided voters and a large number of third-party voters. An average of recent national polls shows Clinton at 40 percent or 41 percent and Trump at 37 percent or 38 percent, meaning that both candidates are struggling to get more than 40 percent of the electorate to commit to them.
Another challenge is that we’ve had a lot of political news lately — in some ways more than the polls can keep up with, even though we’ve had a lot of polls this week. The recent trend against Clinton could be a short-term blip caused by FBI Director James Comey’s testimony about her, the shootings of police officers in Dallas, or some other factor. Several other events that could move the polls — such as Bernie Sanders’s endorsement of Clinton, the terrorist attack in Nice, France, on Thursday, and Trump’s announcement of Mike Pence as his running mate — haven’t had time to show up in the polls yet.
At times like these, there are dangers both in overreacting and in underreacting to polling fluctuations. Our models are doing the best they can, but there’s inherently more uncertainty when the news cycle is fluid, versus when it’s relatively stable. It may be mid-August before the race settles into more of a steady state.
What’s the short-term trend in the polls?As I’ve said, it’s toward Trump. Or if we’re being more precise, it’s away from Clinton; national polls show Clinton declining faster than Trump is gaining, with the number of undecideds increasing in some polls. Libertarian Party candidate Gary Johnson has also seen a slight improvement in his numbers.
What’s the medium-term trend in the polls?It’s easy to become obsessed with how the polls have changed over the past day or the past week, but sometimes you’ll gain perspective by taking a longer-term view. Clinton’s position in the polls is about the same as it was on June 8, the day after she won the California primary. It’s better than it was for parts of May, when polls showed a very close national race. But it’s worse than it was for much of March and April, when polls had her ahead by high single digits. These types of fluctuations are fairly normal, especially early in the race; we were spoiled in 2012 by unusually stable polls.
Which states shape up as most important?We recently relaunched our tipping-point state calculation, which describes a state’s likelihood of providing the decisive votes in the Electoral College in a close election. (There’s more detail on this in our methodology primer.) The top states are — these names will sound familiar — Florida, Pennsylvania and Ohio.
Florida is a must-win for Trump; in our simulations this afternoon, Trump won the Electoral College only 6 percent of the time that he lost the Sunshine State. Pennsylvania isn’t quite as crucial for Clinton, but it’s close; in our simulations, she won the election only 22 percent of the time that she lost Pennsylvania.
Virginia and North Carolina are fourth and fifth on the tipping-point list. Clinton’s polls have held up relatively well in those states, even as the national race has tightened. Winning them could help her compensate for losing states in the Rust Belt or the Upper Midwest.
Does one candidate appear to have an overall edge in the Electoral College, relative to his or her position in the popular vote?Although either outcome is improbable, Trump is more likely to win the Electoral College while losing the popular vote than the other way around, according to the model. That doesn’t mean Trump is winning in swing states right now — but he’s behind by slightly less than he is nationally. While polls-only has Trump trailing by 3.4 percentage points nationwide, for example, it has him down 3.0 points in Pennsylvania, 1.2 points in Florida and by 0.6 points in Ohio. The rest of the swing states are more of a mixed bag — Clinton’s polling well in Colorado and Wisconsin, for instance. But the Florida-Ohio-Pennsylvania triad has been problematic for her, and that makes it hard for her to have a firewall of states that she can feel comfortable about.
How do the “fundamentals” look?By fundamentals, I mean factors apart from head-to-head polls that potentially have predictive power, such as economic conditions, incumbency and presidential approval ratings. We’ve long had a love-hate relationship with the “fundamentals” at FiveThirtyEight. In theory, they help us to understand why voters act as they do (a better economy encourages them to reward the incumbent party, for example). But in practice, models that have attempted to predict the election without looking at polls have a middling-to-poor track record. So we’ve decided to compromise by issuing both a polls-only model and a polls-plus model, which blends polls with an economic index. Right now, the economic index gets about 35 percent of the weight in polls-plus; it will decline to zero by Election Day.
The economic index implies that the race should be close. But stronger economic data lately — in particular, a good jobs report this month — shows an economy that is very slightly above average. That translates into a very narrow advantage, about 1 or 2 percentage points, for Clinton. Obama’s approval ratings — not a factor our models use, but useful for context — are also very slightly above average, which could help Clinton at the margin.
In that sense, the recent polling movement has brought the race more in line with the fundamentals, and a narrow Clinton win — or a narrow Trump win — wouldn’t be that surprising.
Related:July 14, 2016
Why Mike Pence Was Trump’s Least Worst Choice
UPDATE (July 15, 10:57 a.m.): Donald Trump has made it official, choosing Indiana Gov. Mike Pence as his running mate.
A wide variety of news outlets, led by Roll Call, are reporting that Republican Donald Trump plans to name Indiana Gov. Mike Pence as his running mate Friday. There’s some history of incorrect reporting on vice-presidential choices — Dick Gephardt turned out not to be John Kerry’s pick in 2004, for example — so these sources are hedging their reporting to various degrees. Betting markets price in about an 80 percent chance that Pence will be the pick, allowing an outside possibility of a last-minute surprise or change of heart on Trump’s behalf.
If the pick were Pence, I’d view it as the best choice Trump could have made from among a weak lot of finalists. That’s damning with faint praise to some degree, and I’ll highlight a couple of potential challenges with the pick later. But in Pence, Trump would basically be getting a “generic Republican”: a 57-year-old white man; the governor of a midsize, red-leaning state; someone with very conservative but otherwise conventionally Republican policy positions.
That’s probably a good thing, because a generic Republican at the top of the ticket would have a heck of a chance against Hillary Clinton, whose unpopularity would be record-breaking if not for Trump himself. The “fundamentals” of the campaign — Democrats seeking a third straight term to succeed a moderately but not overwhelmingly popular President Obama, amid a good-but-not-great economy — also point to an election that would be close if contested between typical candidates.
Of course, it won’t be Pence at the top of the ticket, and Trump — even after some recent gains — remains the underdog, according to the polls. Still, his calculation is different from Republican John McCain’s in 2008, when McCain made the high-risk pick of Sarah Palin. McCain, like Trump, trailed in the polls. Unlike Trump, however, that had less to do with McCain’s personal failings and more to do with the very challenging national environment for Republicans.2 McCain had every reason to shake things up, hoping to defy the national climate to win on the force of his and Palin’s personalities. Trump, conversely, would benefit from a return to normalcy and making the personalities of the race less important than voters’ feelings about the direction of the country.
Downsides to Pence? There isn’t a lot of electoral utility to the pick. As of early this afternoon, Trump already had an 84 percent chance to win Indiana, according to our polls-only forecast, meaning that Clinton would probably win it only in a national rout. According to our voter power index, a vote in Indiana is worth only 0.3 times as much as an average one elsewhere in the country, in terms of its likelihood of determining the Electoral College winner. By contrast, Virginia and Ohio — where possible Clinton VP picks Tim Kaine and Sherrod Brown reside — have a voter power index of 2.4 and 2.1, respectively.
For that matter, Pence isn’t especially popular in Indiana, having managed to alienate both liberals and conservatives with his handling of the Religious Freedom Restoration Act, which limited legal protections for LGBT residents of Indiana. Polls showed him only narrowly ahead of Democrat John Gregg in a race for a second term as governor. Pence will have to withdraw his name from the gubernatorial ballot if he’s Trump’s VP pick.
Related:Why Mike Pence Would Be Trump’s Least Worst Choice
A wide variety of news outlets, led by Roll Call, are reporting that Republican Donald Trump plans to name Indiana Gov. Mike Pence as his running mate Friday. There’s some history of incorrect reporting on vice-presidential choices — Dick Gephardt turned out not to be John Kerry’s pick in 2004, for example — so these sources are hedging their reporting to various degrees. Betting markets price in about an 80 percent chance that Pence will be the pick, allowing an outside possibility of a last-minute surprise or change of heart on Trump’s behalf.
If the pick were Pence, I’d view it as the best choice Trump could have made from among a weak lot of finalists. That’s damning with faint praise to some degree, and I’ll highlight a couple of potential challenges with the pick later. But in Pence, Trump would basically be getting a “generic Republican”: a 57-year-old white man; the governor of a midsize, red-leaning state; someone with very conservative but otherwise conventionally Republican policy positions.
That’s probably a good thing, because a generic Republican at the top of the ticket would have a heck of a chance against Hillary Clinton, whose unpopularity would be record-breaking if not for Trump himself. The “fundamentals” of the campaign — Democrats seeking a third straight term to succeed a moderately but not overwhelmingly popular President Obama, amid a good-but-not-great economy — also point to an election that would be close if contested between typical candidates.
Of course, it won’t be Pence at the top of the ticket, and Trump — even after some recent gains — remains the underdog, according to the polls. Still, his calculation is different from Republican John McCain’s in 2008, when McCain made the high-risk pick of Sarah Palin. McCain, like Trump, trailed in the polls. Unlike Trump, however, that had less to do with McCain’s personal failings and more to do with the very challenging national environment for Republicans.1 McCain had every reason to shake things up, hoping to defy the national climate to win on the force of his and Palin’s personalities. Trump, conversely, would benefit from a return to normalcy and making the personalities of the race less important than voters’ feelings about the direction of the country.
Downsides to Pence? There isn’t a lot of electoral utility to the pick. As of early this afternoon, Trump already had an 84 percent chance to win Indiana, according to our polls-only forecast, meaning that Clinton would probably win it only in a national rout. According to our voter power index, a vote in Indiana is worth only 0.3 times as much as an average one elsewhere in the country, in terms of its likelihood of determining the Electoral College winner. By contrast, Virginia and Ohio — where possible Clinton VP picks Tim Kaine and Sherrod Brown reside — have a voter power index of 2.4 and 2.1, respectively.
For that matter, Pence isn’t especially popular in Indiana, having managed to alienate both liberals and conservatives with his handling of the Religious Freedom Restoration Act, which limited legal protections for LGBT residents of Indiana. Polls showed him only narrowly ahead of Democrat John Gregg in a race for a second term as governor. Pence will have to withdraw his name from the gubernatorial ballot if he’s Trump’s VP pick.
To a national audience, Pence is almost entirely unknown; this morning’s CBS News/New York Times poll put his favorability rating at 5 percent against 8 percent unfavorable, with 86 percent of registered voters either being undecided or not knowing enough about Pence to have an opinion. A Marist College survey, meanwhile, puts him at 12 percent favorable and 21 percent unfavorable. That would present some risk to Trump, because there would be a scramble between the news media and the campaigns to define Pence in the eyes of the electorate. Given Clinton’s greater staffing and financial resources, it’s possible that Pence could stumble out of the gate.
And yet, several of the alternatives reportedly on Trump’s VP shortlist, especially Newt Gingrich and Chris Christie, are both widely known and widely disliked by the general electorate. So if Pence isn’t quite a risk-free choice, he’d be better than one who was guaranteed to be unpopular.

July 13, 2016
Election Update: When To Freak Out About Shocking New Polls
At 6 this morning, Quinnipiac University released a set of surveys of Florida, Ohio and Pennsylvania with the best polling news Donald Trump has gotten in a long time. In the version of the polls that includes third-party candidates — that’s the version FiveThirtyEight uses — Trump led Hillary Clinton by 5 percentage points in Florida, 1 percentage point in Ohio and 6 percentage points in Pennsylvania.
The results run in contrast to the preponderance of national polls, which show Clinton ahead by roughly 5 percentage points, on average. And some of the other polls released today weren’t as bad for Clinton. Some were even good for her, in fact. A Monmouth University poll showed her up by 13 percentage points in Colorado, while Fox News had her up by 9 points there. And a Marist College poll, contradicting Quinnipiac, had her up 8 points in Pennsylvania.
Nonetheless, the bevy of state polls today worked strongly to Trump’s benefit overall. His chances of winning the Electoral College are up to 29 percent, from 23 percent on Tuesday, according to our polls-only model. And they’re now 33 percent, up from 27 percent, in our polls-plus model, which also accounts for economic conditions. FiveThirtyEight’s forecasts are generally conservative until late in the race, so those qualify as fairly big changes by our standards.
Ordinarily, this is the point at which I’d urge a little patience. There’s been a lot of news over the past two weeks — the conclusion to the FBI’s investigation into Clinton’s emails and the Dallas shootings of police officers, in particular — and it would be nice to see how the polls settled in after a couple of slow weeks on the campaign trail. However, we’re entering a period of rapidly moving political news. Bernie Sanders endorsed Clinton only Tuesday. Trump is expected to name his VP later this week. And then we’ll have the party conventions. The prospects definitely look better for Trump than they did a week or two ago, but the landscape also looks blurrier, and it may not be until mid-August that we have a chance to catch our breath.
So for the rest of this article, I’m going to focus mostly on the Quinnipiac polls — both to explain why our model reacted relatively strongly to them, when some of the other data wasn’t so bad for Clinton, and as an example of how you might think about “unexpected” polling results as they arise over the next few weeks. If you’re a poll junkie, this situation will seem familiar. You think you have a pretty good idea of where the race stands, but then a couple of splashy polls come out that contradict that impression. You have to figure out how much to incorporate the new polls with the data you had previously.
The FiveThirtyEight models make that calculation automatically; we just input the new data and press “go.” That’s helpful because when people (us included) rely on their intuition about how to evaluate new polls, they tend to make one of two mistakes. The more common error is to treat every new poll as a “game changer,” inventing an elaborate story about how the whole race has been upended. Often, it turns out, these interpretations don’t hold up to scrutiny, and a highly touted new poll won’t move the forecast much at all, or a poll that comes out the next day contradicts it.
But there’s also the potential mistake of dismissing a poll as an “outlier” and ignoring it when it provides important new information. This mistake is probably becoming more common because of the influence of sites like FiveThirtyEight. People have learned to trust the polling average more than individual polls — and that’s a good lesson. However, they sometimes take this a step too far, forgetting that the average is composed of individual polls. The average isn’t an excuse to ignore data you don’t like.
So let’s talk about what the FiveThirtyEight forecast models do when they encounter a new poll. I realize that you probably don’t have a model of your own, but the thought process behind this can be valuable, I hope.
Check the pollster’s track record. Has the pollster been around for a while? If so, has it tended to produce fairly accurate results? FiveThirtyEight’s pollster ratings are based on data from hundreds of elections since 1998. Quinnipiac, for example, earns a good grade; its polls have usually been more accurate than average. Thus, Quinnipiac polls are worth taking seriously — and they get more weight in the FiveThirtyEight forecast than an unknown pollster would.Check the methodology (but keep it simple). Our pollster ratings are also based partly on the poll’s methods. They use a simple, two-pronged test. First, does the poll use live telephone interviewers and call mobile phones in addition to landlines? Second, does the polling firm participate in professional initiatives such as the American Association for Public Opinion Research Transparency Initiative, which work to promote disclosure? Polls that do these things — and Quinnipiac does both — have historically tended to be the most accurate. (There are, of course, lots of other ways to describe a pollster’s methodology. For example, does the poll use random digit dialing or list-based sampling? Unless you’re conducting a poll yourself, I wouldn’t get carried away with these critiques, which can quickly turn into cases of special pleading.)Check the sample size. People underestimate the amount of noise that can be introduced into a poll by sampling error. For example, a 600-person poll has a margin of error of plus-or-minus 4 percentage points. But that number pertains to one candidate’s vote share only. The margin of error for the difference separating the candidates is roughly twice that, or almost 8 percentage points. That means in a state where Clinton is really up by 5 percentage points, about 1 in every 40 polls will show her up by 13 percentage points (!) or more. And about 1 in every 40 polls will show Trump ahead by 3 points or more. Quinnipiac’s samples are on the larger side — about 1,000 people per poll — which makes this slightly less of an issue. But the Monmouth poll in Colorado surveyed only 404 people, which makes an anomalous result more likely.Check the dates. The order in which polls are released doesn’t always coincide with when they’re conducted. For instance, the polls Quinnipiac published this morning (July 13) aren’t especially recent, having been in the field for almost two weeks, from June 30 to July 11. There isn’t necessarily anything wrong with that — since it’s only July, you shouldn’t get too obsessed about recency. (A poll conducted on July 15 doesn’t inherently tell you much more about the November outcome than one conducted on July 1.) Still, check the dates before making inferences about cause and effect. Because many of Quinnipiac’s interviews were conducted before FBI Director James Comey’s critical comments about Clinton on July 5, it’s not clear how much his statement had to do with her poor numbers, for example.Check the sample population. Was the poll conducted among likely voters, registered voters or all adults? (The Quinnipiac polls were of registered voters.) In some years, such as 2010, when there was a massive “enthusiasm gap” in Republicans’ favor, this explained a lot of the difference from poll to poll. So far this year, it’s not clear whether registered voter or likely voter polls are better for Trump. Be wary, however, of polls of all adults, which can produce outlier-ish results in either direction; the FiveThirtyEight model significantly discounts these.Check what the pollster said previously. This one’s really important. Does the pollster have a significant house effect, meaning that it consistently shows better results for one party or another? Quinnipiac does have such a house effect; so far this year, its polls have been a net of 3.6 percentage points more favorable to Trump than others of the same states. This is an important mitigating factor for Clinton, although this morning’s polls still had bad news for her even if you adjust for it.1Check the trend lines. Even better than evaluating the firm’s overall house effect, check to see how the new poll compares with previous editions of the same survey. The Quinnipiac polls all showed worsening numbers for Clinton compared with polls they conducted in the same states last month, for example. What about those Marist polls? The top-line results were fine for Clinton, but the trend lines weren’t so good. Her lead declined from 15 percentage points to 8 percentage points in Marist’s poll of Pennsylvania, for example, and from 6 points to 3 points in Ohio. By contrast, some of Clinton’s stronger polls today — particularly the Fox News and Monmouth polls of Colorado — didn’t come with trend lines, since this was the first time those pollsters were surveying the state for the general election. The FiveThirtyEight models react strongly to these trend lines.Check out what other polls say. Most important of all, don’t look at the polls in isolation. Twelve polling firms have released data in Florida since June, with results ranging from Trump up 5 points to Clinton ahead by 13. The polling average, even with the heavily weighted Quinnipiac poll included, suggests that Clinton’s probably still a smidgen ahead there.Hopefully, this gives you a sense of why the Quinnipiac polls moved the model’s numbers a fair amount, when other polls don’t. On the one hand, Quinnipiac’s polls have been Republican-leaning, and we have a lot of other polls of Florida, Ohio and Pennsylvania. Those factors limit the damage to Clinton. But pretty much everything else about them was bad for her. They came from a highly rated pollster, and they took fairly large samples. The trend lines were negative for Clinton.
And we shouldn’t neglect that the polls came in three really important states. Florida, Pennsylvania and Ohio have 67 electoral votes combined, whereas Virginia and Colorado, where Clinton had stronger polls, have 22.
If that’s the to-do list when evaluating new polls, there are also a few to-don’ts. Here’s what not to do when you see a potential “outlier.”
Don’t throw the poll out. There’s no way to make a bright-line distinction about what poll is an “outlier” and which isn’t, making it hard to avoid cherry-picking. And more often than you might think, the so-called “outlier” proves to have the right answer — the Iowa Senate race in 2014 is one such example. Historically, taking an average of polls — “outliers” included — produces a more accurate forecast than alternative measures such as looking at the median.Don’t get lost in the crosstabs. Trust us — you don’t want to take the route of scrutinizing the poll’s crosstabs for demographic anomalies, hoping to “prove” that it can’t possibly be right. Before long, you’ll wind up in the Valley Of Unskewed Polls. Sample sizes are one issue. If a 600-person poll breaks out the results for men, women, Hispanics, blacks, Democrats, Republicans, older voters, younger voters and so forth, those subsamples will have extremely high margins of error, pretty much guaranteeing there will be some strange-looking results. Also, these comparisons are often circular. It might be asserted that a poll must be wrong because its demographics don’t match other polls. But no one poll is a gold standard — exit polls certainly aren’t. There are also legitimate disagreements over methodology — some polls weight by partisan identification and some don’t, for example. Although some of these debates may be important in the abstract, our experience has been that they involve a lot of motivated reasoning when raised in the middle of the horse race.Don’t get mad because the polls disagree. There’s less to fight about when polls show similar results. But that doesn’t necessarily mean they’ll turn out to be more accurate. Instead, that consensus may reflect herding — pollsters suppressing results that they deem to be outliers, out of fear of embarrassment. Sometimes, as in the case of the 2015 U.K. general election, there’s a strong consensus among pollsters about where the race stands, and the consensus turns out to be quite wrong.In fact, you should trust a pollster more if it’s willing to publish the occasional “outlier.” Clinton probably isn’t winning Colorado by 13 percentage points right now or losing Pennsylvania by 6 points. But the fact that Monmouth and Quinnipiac are willing to publish such results are a sign that they’re letting their data speak for itself. In the long run, that’s what leads to more accurate polling.

Nate Silver's Blog

- Nate Silver's profile
- 730 followers

