
Nate Silver's Blog, page 132
June 6, 2016
Elections Podcast: The Primaries Are Almost Over
The first leg of the 2016 election marathon is, finally, almost over. As the primaries come to a close, the elections podcast crew talks about what to expect from the final contests and what the Trump-related controversies of the past week mean for the general election. Also, FiveThirtyEight chief economics writer Ben Casselman joins the podcast to take a look at the latest lackluster jobs report and how the economy affects elections.
https://serve.castfire.com/s:5L8r1/audio/2778728/fivethirtyeightelections_2016-06-06-182428.64k.mp3?ad_params=zones%3DPreroll%2CPreroll2%2CMidroll%2CMidroll2%2CMidroll3%2CMidroll4%2CMidroll5%2CMidroll6%2CPostroll%2CPostroll2%7Cstation_id%3D4278Subscribe: iTunes |Download |RSS |VideoP.S. We’re coming to California! We’ll be in San Francisco on June 23 and Los Angeles on June 25. More information is here.
You can stream or download the full episode above. You can also find us by searching “fivethirtyeight” in your favorite podcast app, or subscribe using the RSS feed. Check out all our other shows.
If you’re a fan of the elections podcast, leave us a rating and review on iTunes, which helps other people discover the show. Have a comment, want to suggest something for “good polling vs. bad polling” or want to ask a question? Get in touch by email, on Twitter or in the comments.


June 3, 2016
Hispanic Voters Will Decide Bernie Sanders’s Fate in California
Three recent surveys from highly rated polling firms (Marist College, Field and Public Policy Institute of California) show Bernie Sanders just 2 points behind Hillary Clinton in California. Clinton is ahead by double digits, however, in other polls, including one that has her up by 18 percentage points. It’s making for another confusing finish in a primary season that has already had plenty of them. And it’s an indication of how little we know about how Hispanic Democrats (and Asian-American Democrats) are voting this year.
Our polls-only model, taking all the various polls into account, gives Clinton a 5 percentage point lead, and translates that into a 86 percent chance of her winning California. Even though Clinton has led in every poll, that seems overconfident given the generally mixed track record of the polls in the Democratic primaries this year, and I’d happily take Sanders at the 6-to-1 odds the model offers.1
But unlike in Michigan or Indiana, the two previous states that Sanders won as an underdog in our polling model, the demographics in California aren’t necessarily out of step with polls showing a Clinton lead.
At various stages throughout the Democratic primaries, we’ve been issuing forecasts from a demographic model. The ingredients of the model have changed slightly over time as we’ve learned more about what determines the Democratic vote — that Sanders does better than Clinton in caucuses, for example, or that Clinton does better in primaries that are closed to independent voters.
These demographic models have always accounted for race, but there are a lot of different ways to do it. Here are five alternative strategies:
I. Account for the percentage of white voters in a state; group all nonwhite voters (black, Hispanic, etc.) together.
II. Account for the percentage of black voters in a state; group all nonblack voters (white, Hispanic, etc.) together.
III. Account for the percentage of white voters and the percentage of black voters; group Hispanic, Asian and “other” voters together.
IV. Account for the percentage of black voters and the percentage of Hispanic voters; group white, Asian and “other” voters together.
V. Account for the percentage of white voters, the percentage of black voters and the percentage of Hispanic voters; group Asian and “other” voters together.
I’ve seen all of these strategies applied by various people over the course of the campaign. We ourselves have not been totally consistent about it, starting out by using strategy I, and most commonly using strategy IV, with occasional forays into strategy III.
Most of the time, it doesn’t make a lot of difference, but it does for California, and for some of the other states set to vote on June 7. Model I is very favorable for Clinton, for example. It notes that Clinton usually does well in states with lots of nonwhite voters. Therefore it projects Clinton to get 60 percent of the two-way vote2 in California, a state with lots of nonwhite voters, meaning that she’d beat Sanders by about 20 percentage points.3
Model II has Clinton as a slight underdog in California, by contrast. It notes that the state has relatively few black voters (more of those nonwhite voters are Hispanic or Asian), and that its primary is open to independent voters. To model II, California looks a lot like Indiana — another open primary state with few black voters — and it expects Clinton to lose California by 3 or 4 percentage points, similar to her margin of defeat in the Hoosier State.
These differences are even more profound in other states. Depending on which model you use, Clinton is either an underdog in New Mexico, which has few black voters but lots of Hispanics and Native Americans, or a 50-point favorite.
PROJECTED CLINTON VOTE SHARESTATEMODEL IMODEL IIMODEL IIIMODEL IVMODEL VCalifornia60.1%48.4%50.5%54.9%54.2%Montana46.239.139.638.436.7New Jersey63.759.159.960.359.4New Mexico76.046.752.463.261.0North Dakota26.529.528.828.328.8South Dakota47.439.540.238.336.0How you model race makes a lot of difference in your forecastAll models control for whether the election is open or closed to independent voters, whether it’s a primary or a caucus, and national polls at the time of the election.
This serves as a neat illustration of how small choices in building a model make a lot of difference. I don’t mean to make it seem like an exercise in futility, however. Instead, I think there are pretty good reasons to use one of the models (IV or V) that account separately for the Hispanic vote. Those models would have Clinton winning California by 8 to 10 percentage points, consistent with her lead in the polling average or maybe just a pinch better than it.
One reason is that Clinton has a good track record this year in states with large Hispanic populations, having blown Sanders out in Florida, Arizona, Texas and New York, and edged him out in Nevada (although she lost the Colorado caucuses). As you can see below, it’s hard to explain the vote in those states unless you have a variable to account for the Hispanic vote. (For the sake of simplicity, I’ve limited the table to models II and IV.) So it’s not just that the Hispanic vote is a statistically significant predictor of Clinton’s vote; it’s also highly practically significant.
CLINTON VOTE SHARESTATEMODEL II PROJECTIONMODEL IV PROJECTIONACTUALNevada42.7%47.7%52.7%Colorado39.643.340.6Texas56.466.466.3Arizona49.355.157.6Florida63.164.965.9New York56.257.258.0Accounting for states’ Hispanic populations produces more accurate resultsAnother reason is that, in those states, Clinton has done well in heavily Hispanic areas. So far, 17 majority-Hispanic districts have voted in the Democratic campaign: 10 congressional districts in Arizona, Florida, Illinois and New York, and seven state Senate districts in Texas (which tabulates its vote based on state Senate boundaries rather than congressional boundaries). Of those 17 districts, Clinton has won 16. In fact, she’s dominated them, winning an average of 66 percent of the vote to Sanders’s 34 percent. The lone, weird exception is Chicago’s earmuff-shaped 4th Congressional District, where Sanders won by 16 percentage points.4
VOTE SHARESTATEDISTRICTSHARE HISPANICCLINTONSANDERSTexas2789.1%72.4%–27.6%–Florida2783.170.5–29.5–Texas2982.067.5–32.5–Texas2077.571.8–28.2–Florida2575.772.8–27.2–Florida2674.069.4–30.6–Texas673.873.0–27.0–Illinois473.541.8–58.2–Texas2172.367.4–32.6–New York1570.472.8–27.2–Arizona770.158.5–41.5–Texas2668.467.8–32.2–Arizona367.060.1–39.9–Texas1966.771.0–29.0–New York1361.162.9–37.1–Florida952.467.1–32.9–New York1451.858.1–41.9–Clinton has dominated majority-Hispanic districtsDistrict numbers in Texas refer to state Senate districts; in other states, to congressional districts
Sources: Pew Research, The Green Papers, State of Texas
Exit polls also show some evidence of Clinton’s strong performance with Hispanics, although with some inconsistencies. They had her winning Hispanics by more than 40 percentage points in Florida and Texas and by nearly 30 points in New York, although narrowly losing them in Nevada and Illinois. In California, by contrast, recent polls do not show Clinton performing especially well with Hispanics. Instead, they have her winning them by about 7 percentage points, on average, similar to her overall lead on Sanders.MARGIN OF SUPPORTPOLLSTEROVERALLWITH HISPANICS/LATINOSField PollClinton+2Clinton+4Marist CollegeClinton+2Sanders+3SurveyUSAClinton+18Clinton+6PPICClinton+2Clinton+9YouGovClinton+13Clinton+12USC*Clinton+10Clinton+11Polls show a close race for California’s Hispanic voteUSC poll did not break out results among likely Hispanic voters. Results are extrapolated based on Hispanic registered voters.
The Hispanic vote is not monolithic; Mexicans, Puerto Ricans, Cubans and other groups all vote somewhat differently from one another. Age can matter a lot: Clinton performs well among older Hispanics while Sanders does well among younger ones.5 The predominantly Spanish-speaking Hispanic population can vote differently from the English-speaking Hispanic population. All of this can make it dangerous to extrapolate results from one state to another. But it also makes it tricky for the polls, which often have small sample sizes for ethnic subgroups and trouble reaching a representative sample of Hispanic voters. To add to the complication, California also has a significant Asian-American population, and we have very little evidence about how Asian-Americans are voting this year.
So while the polls could be off by enough for Sanders to win California — I like his odds better than our polling model does — they could also be off in the other direction, meaning that Clinton could win by 15 to 20 percentage points. In 2008, Clinton significantly outperformed her polls in California, in part by winning the Hispanic vote 2-to-1 over Barack Obama.
Whatever the outcome, it’s almost certainly too late to help Sanders win the nomination; he’d need to win every remaining state by roughly 35 percentage points to catch up to Clinton in pledged delegates. But California may tell us something about whether Hispanic Democrats are already standing with Clinton, or whether she’ll have some outreach to do to ensure they turn out for her in November.

June 2, 2016
The State Of The Polls, 2016
Two years ago, in advance of the 2014 midterms and in conjunction with the release of FiveThirtyEight’s pollster ratings, I wrote an article headlined “Is The Polling Industry In Stasis Or In Crisis?” It pointed out a seeming contradiction: Although there were lots of reasons to be worried about the reliability of polling — in particular, the ever-declining response rates for telephone surveys — there wasn’t much evidence of a crisis in the results pollsters were obtaining. Instead, the 2008, 2010 and 2012 election cycles had all featured fairly accurate polling.
Has the reckoning come for the polls since then? The evidence is somewhat mixed. The 2014 midterm elections were not a banner year for pollsters, with most polls showing a statistical bias toward Democrats (reversing their statistical bias toward Republicans in 2012). As a result, there were a handful of major upsets by Republican candidates, along with a few near misses. Still, the error in the polls was reasonably in line with historical norms. It wasn’t the disaster that pollsters have experienced in other countries, such as the United Kingdom and Greece, or even in previous U.S. midterm elections, such as 1994 and 1998.
Pollster Ratings:We’ve analyzed the historical accuracy of more than 350 polling agencies and rated them according to performance and methodology. See all of our pollster ratings »
If the 2014 midterm polls were a little better than reputed, however, the reverse might be true of the 2016 presidential primaries polls. Importantly, the polls (and even more so, the polling averages) had a good track record of calling winners, with the polling front-runner winning the vast majority of the time. Furthermore, the polls caught wind of Donald Trump’s popularity among Republicans early in the cycle, even as a lot of journalists (including, uhh, yours truly) were deeply skeptical about his chances. But the margins were often pretty far off, especially in the Democratic race, with Hillary Clinton often blowing away her polling numbers in the South and Bernie Sanders often doing so elsewhere in the country. Furthermore, although there weren’t many upsets, at least one of them — Sanders’s win in Michigan — was historically epic.
Don’t take our word for it, though: We’d encourage you to explore the data for yourself. We’ve just released a new set of pollster ratings, based on data up through and including the Oregon presidential primary May 17. We’ve also published the raw data behind these ratings: more than 7,900 polls conducted in the final three weeks before presidential primaries and caucuses and general elections for president, governor, and the U.S. Senate and House since 1998.
The methodology we use to calculate the pollster ratings is highly similar to the procedures we followed to generate our 2014 ratings, with a handful of exceptions that I describe in the footnotes.1
As before, the ratings are based both on a pollster’s past accuracy and on two easily measurable methodological standards:
The first standard is whether the firm participates in the American Association for Public Opinion Research Transparency Initiative, is a member of the National Council on Public Polls or contributes its data to the Roper Center for Public Opinion Research archive. Polling firms that do one or more of these things generally abide by industry-standard practices for disclosure, transparency and methodology and have historically had more accurate results.The second standard is whether the firm usually conducts its polls by placing telephone calls with live interviewers and calls cellphones as well as landlines. Automated polls (“robopolls”), which are legally prohibited from calling cellphones, do not meet this standard even if they use hybrid or mixed-mode methodologies (for example, robocalling landlines and then supplementing with cellphone calls placed by live interviewers).2 It’s increasingly essential to call cellphones given that about half of American households no longer have a home landline. Although internet polls show promise as a potential alternative, they do not yet have a long enough or consistent enough track record to be placed on the same pedestal as high-quality, live-interview telephone polls, based on our view of the evidence.But enough about methodology; let’s return to the question of how the polls fared in the 2014 midterms and 2016 presidential primaries.
First, here’s a calculation we call Simple Average Error. It measures the difference between the percentage of the vote separating the top two finishers in the election and the margin shown by the polls. For instance, if a poll had projected Trump to beat Ted Cruz by 2 percentage points in an election and Trump won by 10 points, that would count as an 8 percentage point error. Likewise, it would count as an 8-point error if Trump had been projected to beat Cruz by 2 points but lost to him by 6 instead.

In 2014, the average gubernatorial poll had an error of 4.5 percentage points as defined in this way, and the average Senate poll had an error of 5.4 percentage points. The gubernatorial polls were a bit more accurate than usual and the Senate polls a bit less, but both figures are reasonably in line with historical norms. A bigger problem is that most of these polls missed in the same direction, underestimating the Republican candidate. (We’ll take that point up in a moment.)
House polls are typically less accurate than Senate or gubernatorial polls — the further down the ballot you go, the larger the polling error tends to be — and 2014 was no exception, with the average House poll missing by 7.9 percentage points. That’s not a good result by any stretch of the imagination, although that number is inflated somewhat by a single polling firm, YouGov, which ambitiously released polls of all 435 congressional districts. Most of those polls had small sample sizes of fewer than 200 respondents, and most of them were in noncompetitive districts, which can be difficult to poll. (Our Advanced Plus-Minus and Predictive Plus-Minus calculations adjust for these factors, but Simple Average Error does not.) Excluding YouGov, the average error for House polls was 6.6 percentage points, still a mediocre performance, although similar to past years such as 1998 and 2010.
If House races can be tricky to poll, presidential primaries are even harder, for some of the reasons I mention here. Turnout is relatively low, people are sometimes choosing among several similar candidates, and voters often wait until the last minute to make their decisions. So primary polling is almost always a fairly wild ride. Still, the average error in primary polls this year was a whopping 9.4 percentage points, worse than the average of 8.1 percentage points in all presidential primaries since 2000. The problems were worse on the Democratic side, with an average error of 10.6 percentage points, compared with 8.3 percentage points in the Republican race.
And yet, the primary polls have done a pretty good job of picking winners. In 85 percent of polls this year, the leading candidate in the poll matched the winning candidate in the election. That’s much better than in 2012, when the leading candidate won in the polls only 61 percent of the time.
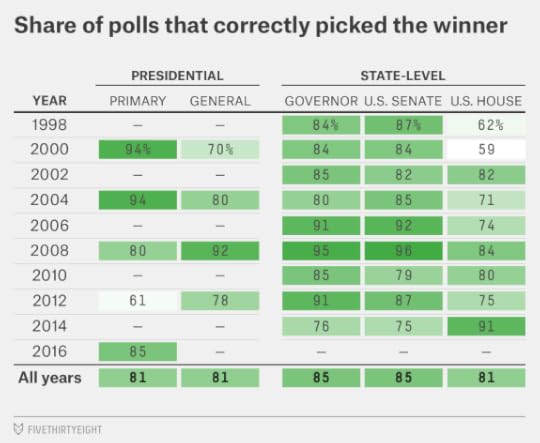
What gives? A lot of primaries and caucuses were lopsided this year, with strongly regional voting patterns; Clinton dominated in the South, and Trump cleaned up in the Northeast, for example. (By contrast, a lot of Republican primaries came down to the wire in 2012.) It’s easier to call the winners right, of course, when an election isn’t competitive. On the other hand, it can be harder for pollsters to nail down the margin in such races. A seemingly noncompetitive race can discourage turnout, either allowing the leading candidate to run up the score or, occasionally, the trailing candidate to do much better than expected because the leading candidate’s voters become complacent. As a technical matter, the handling of undecided voters also matters more in noncompetitive races.3 In a slight change this year, our Advanced Plus-Minus and Predictive Plus-Minus ratings account for the fact that less-competitive races are associated with a larger error, on average. Still, this doesn’t entirely excuse the polls.
Another useful measure of polling performance is statistical bias, which indicates whether polls consistently miss in the same direction. If over a large number of races, for example, your polling firm projects Democratic candidates to win by an average of 5 percentage points, and they win by 2 percentage points instead, that means those polls had a pro-Democratic (and anti-Republican) statistical bias of 3 percentage points. Statistical bias isn’t necessarily an indication of partisan bias; some media outlets that are accused of having a pro-Republican bias in their coverage have a pro-Democratic statistical bias in their polls, and vice versa. But it has nevertheless been a problem in recent years:
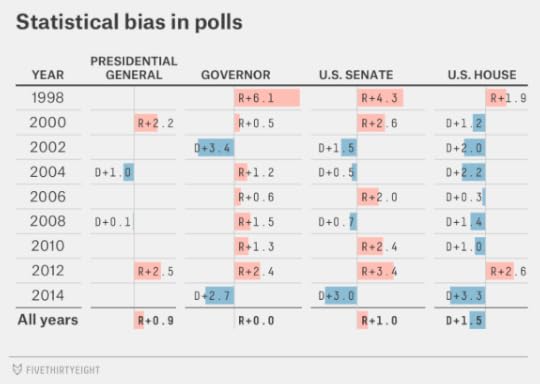
In 2012, the polls had a 2 or 3 percentage point pro-Republican bias, meaning that they underrated how well President Obama would do, along with Democratic candidates in gubernatorial and congressional races. In 2014, by contrast, they had roughly a 3 percentage point pro-Democratic bias. So rather than the merely good Republican year implied by the polls, Republicans had a near-landslide in the midterms instead.
The good news is that, over the long run, the polls haven’t had much of an overall bias, having underrated Republicans in some elections and Democrats in others. But the bias has shifted around somewhat unpredictably from election to election. You should be wary of claims that the polls are bound to be biased in the same direction that they were two years ago or four years ago.
You should also recognize the potential for statistical bias even (or perhaps especially) if the polls all seem to agree with one another. An uncannily strong consensus among the polls may indicate herding, which means polling firms are suppressing outlier results that appear out of line with the consensus. Good election forecasting models can account for the possibility of herding and statistical bias by assuming that the error in polls is correlated from state to state, but it raises the degree of difficulty in building a model.
What about bias in the presidential primary polls? Those numbers aren’t shown in the table above because the bias calculations we list in our pollster ratings pertain only to general elections. But we can calculate them by the same method. Indeed, statistical bias has been a problem in both party primaries this year.
In Republican primaries and caucuses, the polls generally had a pro-Trump and anti-Cruz bias. In races where Trump and Cruz were the top two finishers in some order, the bias was 5.5 percentage points in Trump’s favor. The bias dissipated as the race went along, and there wasn’t as much of a bias when another candidate — John Kasich or Marco Rubio — was Trump’s main competitor in a state. Still, the primary results ought to raise doubts about the theory that a “silent majority” of Trump supporters is being overlooked by the polls. In the primaries, Trump was somewhat overrated by the polls.
In the Democratic race, the polls had a 1.8 percentage point bias toward Clinton (and against Sanders) overall. However, it varied significantly based on the demographic makeup of the state, with Clinton outperforming her polls in diverse states and Sanders beating his in whiter ones. Specifically, in states where at least 25 percent of the population is black or Hispanic,4 the polls had a pro-Sanders, anti-Clinton bias of 5.7 percentage points. But they had an 8.2 percentage point bias toward Clinton, and against Sanders, in states where less than 25 percent of the population is black or Hispanic.
As I mentioned before, the polls mostly identified the right winners, and some of the bias reflected the candidates’ running up the score in demographically favorable terrain. (Clinton, for instance, won South Carolina by 47 percentage points instead of the 27 points projected by the polls.) Still, the results are troubling given that the Sanders and Clinton coalitions each contain hard-to-poll groups. In Clinton’s case, that means black and Hispanic voters, who are usually harder for polls to reach than white voters. For Sanders, that means young and first-time voters, who are also hard to reach and who are sometimes screened out incorrectly by likely voter models. Pollsters should think carefully about their strategies for reaching these groups in the general election.
Finally, let’s take a look at how some of the more prolific pollsters have performed recently. The following table contains our Advanced Plus-Minus scores for polling firms that released at least 20 total polls between the 2014 midterms and 2016 presidential primaries. Advanced Plus-Minus measures a poll’s error as compared against others that surveyed the same race, controlling for factors such as the number of days between the poll and the election.5 Negative scores are good and mean the pollster performed better than other polling firms under similar conditions.
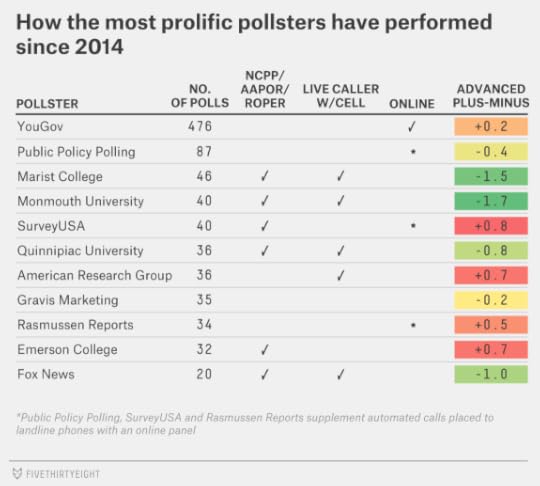
The best-performing polls recently have been those from Monmouth University and those from Marist College. Both apply “gold standard” methodologies, using live telephone interviews and placing calls to cellphones as well as landlines, and both participate in the AAPOR Transparency Initiative. Quinnipiac University, another “gold standard” pollster, has also performed fairly well of late. So has Fox News, which switched to new polling partners in 2011 and has gotten good results since then.6
Automated polling firms have gotten mediocre results in recent years, especially SurveyUSA and Rasmussen Reports, although note that SurveyUSA has a long history of accurate polling and so retains a high grade overall. Public Policy Polling has gotten fairly good results, by contrast, although that may be because the pollster engages in a high degree of herding.
YouGov, which fared poorly by calculations such as Simple Average Error, gets about an average rating according to Advanced Plus-Minus, which accounts for the fact that they were polling under difficult circumstances (for instance, polling obscure House races that nobody else tried to survey). Still, we’re awaiting more evidence about the reliability of online polls. SurveyMonkey, which has sometimes partnered with FiveThirtyEight, released a set of polls of the Democratic and Republican primaries before Super Tuesday and got mediocre results, but it isn’t really enough data to come to conclusions about long-term accuracy. Other online polling firms, such as Morning Consult and Ipsos, have focused on national polls instead of issuing state polls ahead of key primaries and general elections. In my view, the online pollsters have been too gun-shy as a group (with YouGov an important exception) to issue polls of state and local elections. These firms employ a lot of smart people, and my working assumption is that online polls are already more accurate than automated telephone polls (if not necessarily traditional telephone polls, at least not yet). But that’s nothing more than an educated guess until we get more data on how they perform.
Listen to the latest episode of the FiveThirtyEight elections podcast.
https://serve.castfire.com/s:5L8r1/audio/2767474/fivethirtyeightelections_2016-05-31-164514.64k.mp3?ad_params=zones%3DPreroll%2CPreroll2%2CMidroll%2CMidroll2%2CMidroll3%2CMidroll4%2CMidroll5%2CMidroll6%2CPostroll%2CPostroll2%7Cstation_id%3D4278Subscribe: iTunes |Download |RSS |VideoParticipation in the AAPOR Transparency Initiative, NCPP or the Roper Center archive continues to be a strong predictor of polling accuracy. Polling firms that get our AAPOR/NCPP/Roper check mark have had an Advanced Plus-Minus score of -0.4 since 2014,7 compared with a score of +0.8 for those that don’t have it.
All told, the evidence is ambiguous enough to be consistent with almost any case you’d like to make: either that the polls are about as accurate as they’ve always been, which isn’t to say that they’re perfect, or that there are real warning signs of trouble ahead, which isn’t to say the polls are useless. The answer may also depend on which polls you’re looking at. As we’ve found in the past, polls that employ more expensive methodologies, and abide by higher levels of disclosure and transparency, tend to be more accurate than those that don’t. It may be that the best polls are roughly as accurate as ever but that the worst polls are increasingly far off the mark.


May 31, 2016
Elections Podcast: Inviting A Third To The Party
Our elections podcast crew discusses whether an independent presidential candidate can shake things up in the general election. Plus, we look at the 15 states (or is it 10?) that Donald Trump says he’ll target this fall.
.@realDonaldTrump plans to focus on 15 states in the general election. https://t.co/nDT2mTDnk0—
Fox News (@FoxNews) May 29, 2016
p.s. We’re coming to California! We’ll be in San Francisco on June 23 and Los Angeles on June 25. More information here.
#GoodUseOfPolling or #BadUseOfPolling? @FiveThirtyEight @jodyavirgan @ClareMalone @ForecasterEnten @NateSilver538 pic.twitter.com/tMNwgm6Ggk
— David Chernicoff (@chernithings) May 28, 2016
You can stream or download the full episode above. You can also find us by searching “fivethirtyeight” in your favorite podcast app, or subscribe using the RSS feed. Check out all our other shows.
If you’re a fan of the elections podcast, leave us a rating and review on iTunes, which helps other people discover the show. Have a comment, want to suggest something for “good polling vs. bad polling” or want to ask a question? Get in touch by email, on Twitter or in the comments.

Of Course Trump Can Win
In this week’s politics chat, we check in on some surprising/crazy/totally normal general election polls. The transcript below has been lightly edited.
micah (Micah Cohen, politics editor): Let’s talk general election polls. We’re a little over five months from Election Day, and polls show a close race between Donald Trump and Hillary Clinton. Today’s question: What should a sophisticated political observer make of these polls? To set us up, Harry, give us a rundown of the latest polling, national and state. Where do things stand?
harry (Harry Enten, senior political writer): National polls show Clinton with a slight advantage. Doing an average of all the polls since Trump vanquished Ted Cruz and John Kasich a little over a month ago finds Clinton ahead by about 2 percentage points. State-level polling is a bit odder: We’ve seen surveys showing Clinton close in Arizona (which has gone Democratic in just one presidential election since 1952) and Trump close in New Jersey (which hasn’t gone Republican since 1988). Most of the polls in the traditional swing states are close. Clinton holds a slight lead, roughly 3 percentage points, in Ohio. Same thing in Florida. Clinton leads by about 5 percentage points in Pennsylvania. (That’s all according to the HuffPost Pollster aggregates.)
micah: That state polling is weird. What gives?
harry: For one thing, it shows that we can’t be sure how the map will look. That is, the swing states in 2016 may not be the same as they were in 2012. We have a completely new pair of candidates (i.e., there’s no incumbent president running for re-election). Also, a lot of these states have only one or two polls, so we don’t have a lot of data.
natesilver (Nate Silver, editor in chief): I’m not ready to accept yet that we’ll have a whole new map this time around. There will probably be some differences, yes. But my prior is that we’ll still have mostly the same swing states as last time, and I haven’t seen persuasive enough evidence yet to convince me otherwise. Here’s why: These polls are showing huge, enormous numbers of undecided voters. In that Monmouth poll of New Jersey, for instance, it’s Clinton 38 percent and Trump 34 percent, leaving 28 percent undecided, voting third party or saying they’ll sit out the general election. The Monmouth poll is a bit of an extreme case, but there are plenty of polls that are like, Clinton 43 percent, Trump 41 percent, undecided/other 16 percent, which is still a huge number.
micah: Is that unusual?
natesilver: It’s unusual, yes. By comparison, in 2012, we were seeing numbers more like Obama 47 percent, Romney 45 percent at a comparable point in the campaign.
But my point is that with all these undecided voters, it makes the state-by-state numbers a little flatter right now, if that makes sense.
I’d guess that if you looked at the makeup of the undecided voters in New Jersey, they’d look like they’ll probably wind up being Clinton supporters. And if you look at them in Arizona or Utah or one of the states where Trump has looked surprisingly vulnerable, they’d look like they’ll eventually be Trump supporters.
harry: That’s what Monmouth University’s Patrick Murray pointed out in his news release. And keep in mind, a poll can be accurate at this time even if it doesn’t end up being predictive.
micah: But is the fact that those voters are undecided now meaningful? (Even if they look like Trump voters in Arizona and Clinton voters in New Jersey.)
harry: More undecided voters now gives credence to the idea that this year may be good for third-party candidates (see Johnson, Gary). I made this argument two weeks ago.
natesilver: Sure, and one thing the pollsters are going to have to decide soon is whether to include Johnson in their surveys.
harry: I’m of the belief that pollsters should at least offer Johnson as an option to some respondents. Otherwise pollsters are putting their thumb on the scale, in my opinion. Johnson has more electoral experience than Trump does. Why isn’t he serious?
natesilver: I agree. Some pollsters don’t like to include third-party candidates because, for a variety of reasons, polls sometimes overstate their numbers. But it’s not a pollster’s job, in my view, to take that choice away from the voter when they’ll have it on the ballot. They can always ask the question both ways, too — with Johnson and without.
harry: This poll by Monmouth did exactly that.
micah: Isn’t the unusually high number of undecided voters, in addition to being a good sign for Johnson, also a sign that the map could change more than usual?
harry: If more undecideds is good for a third party, then that third-party candidate may pull different support from different candidates in different places. Perhaps Johnson pulls more Republicans in Arizona, which gives Clinton a chance there. Perhaps Johnson pulls more upscale liberals in the southeast Philadelphia suburbs in Pennsylvania, who might otherwise vote for Clinton. That could potentially change the map. We don’t know.
natesilver: I’d say it’s a sign that there’s a lot of uncertainty in the outcome. In general, the more undecideds you have, the larger the error in the polling.
harry: That’s at least part of the reason that primaries have larger polling errors than general elections. There are often many more undecided voters.
natesilver: I still think, though, that we’re not really at the starting line yet. One candidate has wrapped up the nomination, and the other one hasn’t.
harry: Yes, we’ve seen some attempts to try to estimate what the Trump vs. Clinton race will look like once Bernie Sanders concedes the Democratic primary. Most of those give Clinton extra support as at least some Sanders supporters move to her.
natesilver: I guess I’m getting sort of annoyed with almost all the discussion of general election polls I’m reading. Granted, it doesn’t take much to annoy me, especially on the Tuesday after a three-day weekend.
micah: Wait, what’s annoying?
natesilver: On the one hand, you have people (mostly Democratic-leaning commentators) trying to nitpick individual polls. That’s generally an unhealthy exercise, and it usually involves a lot of cherry-picking. And the trend is clear that Trump has gained significantly on Clinton.
On the other hand, you have people treating the recent polls as though they’re the new normal, the baseline case for the general election, when we don’t really know that yet. It’s not certain by any means — but I’d say it’s probable that Clinton will gain ground when/if Sanders concedes. The third-party stuff is another thing that’s still in the process of working itself out.
On the third hand, I’ve seen a lot of pieces lately framed around the notion of “why Trump could win.” And a lot of those pieces are smart and well-argued when you get past the headline. But the premise slightly annoys me because I don’t see a lot of people saying Trump can’t win. So they’re sort of arguing against a straw man. I mean, of course Trump could win. There are only two major-party candidates, both of them are really unpopular, the “fundamentals” point toward a close election, the polls have tightened, random news events could intervene, and Trump is a candidate who has defied a lot of precedent. Of course he could win. But what are the odds?
micah: I don’t know … I was surprised by how quickly and easily Trump consolidated the GOP vote, and I think that fact is feeding a lot of the “wow, he could win this” sentiment.
natesilver: Sure, which is why it’s appropriate to say that his odds have gone up, as they have at betting markets.
micah: What’s been the swing in betting markets?
natesilver: Trump has closed from being a 3:1 underdog to a 2:1 underdog, roughly speaking.
harry: Right.
micah: That’s a pretty big change. Well, not that big, I guess.
natesilver: If I say his chances have increased from 25 percent to 33 percent, that doesn’t sound so big.
micah: Yeah.
harry: And don’t be shocked if Trump’s odds fall again once Clinton clinches the nomination and her polling goes up.
Listen to the latest episode of the FiveThirtyEight elections podcast.
https://serve.castfire.com/s:5L8r1/audio/2767474/fivethirtyeightelections_2016-05-31-164514.64k.mp3?ad_params=zones%3DPreroll%2CPreroll2%2CMidroll%2CMidroll2%2CMidroll3%2CMidroll4%2CMidroll5%2CMidroll6%2CPostroll%2CPostroll2%7Cstation_id%3D4278Subscribe: iTunes |Download |RSS |Videonatesilver: Anyway, I think the magnitude of the change is roughly appropriate. It was likely but not certain that Trump would consolidate the GOP base. So some of that should have been priced into his stock before, but he deserved a little bit of a boost for doing it (and doing it so quickly).
Likewise, it’s likely but not certain that Clinton will consolidate the Democratic base, and the market is clearly pricing that in. If she doesn’t do that, I suspect the market (and the polls) will drift toward showing a 50-50 race. If she does, she might be more like a 3:1 favorite again.
Obviously I’m thinking of this in a binary way when it isn’t quite like that — there are various degrees of base consolidation, and both Trump and Clinton have some work to do — but that’s the general idea.
micah: All right, to wrap us up: We’ve talked a lot about polls, but are there other indicators we should be watching?
harry: I’d keep an eye on the president’s approval rating, which is now greater than his disapproval rating. In 1988 when Michael Dukakis was beating George H.W. Bush, there was reason to think Bush still had a decent shot at winning because Ronald Reagan’s approval rating was rising. The incumbent president’s approval rating is not the be-all, end-all, but it’s important. I’d also look at the economy. Right now, job growth is going at a decent pace. Still, it’s not awesome. I think the economy points to a decently close race.
natesilver: I don’t look at approval ratings as a magic forecasting bullet by any means. But it’s sort of fascinating to me that Obama is gaining ground and has reasonably healthy (although by no means great) approval ratings at a time when the electorate is supposedly in this burn-it-all-to-hell mode.
harry: Maybe because the electorate really isn’t in burn-to-hell mode?
natesilver: Other than Trump, it’s been a fairly normal, predictable election cycle! Of course, that’s like saying “other than that, Mrs. Lincoln, how was the play?”

May 26, 2016
The System Isn’t ‘Rigged’ Against Sanders
A week ago, New York Daily News columnist and Bernie Sanders supporter Shaun King tweeted the following about the Democratic caucuses in Washington, which took place in late March:
Washington State has 7.2 million people. @BernieSanders won 71% of the votes. NONE of those votes count in the "popular vote totals".
— Shaun King (@ShaunKing) May 19, 2016
Whether King intended it or not, he implied that caucuses — which often require hours of participation and mean lower turnout — are representative of what would happen if a larger electorate had its say. Well, a funny thing happened in Washington on Tuesday: The state held a mail-in, beauty-contest primary — so voting was easy, but no delegates were at stake. (The Associated Press has declared Hillary Clinton the winner.) The results are still being finalized, but Clinton leads by about 6 percentage points with more than 700,000 votes counted. Sanders won the Washington caucuses, which had 230,000 participants, by 46 percentage points.
So, turnout was much higher in the Washington primary than in the caucuses, and Clinton did much better. Something similar happened in Nebraska, where Clinton lost the early March caucuses by 14 percentage points and won the early May primary, in which no delegates were awarded, by 7 points.
Nebraska and Washington are part of a pattern. As Sanders fans claim that the Democratic primary system is rigged against their candidate and that Sanders wins when turnout is higher, they fail to point out that Sanders has benefited tremendously from low-turnout caucuses. Indeed, if all the caucuses were primaries, Clinton would be winning the Democratic nomination by an even wider margin than she is now.
Let’s start out with the real-world numbers. Here are the delegate and vote totals by contest, including caucuses and primaries, so far:
POPULAR VOTE (THOUSANDS)PLEDGED DELEGATESSTATECAUCUSCLOSEDWINNERCLINTONSANDERSCLINTONSANDERSIowa✓Clinton+085852321N.H.Sanders+2295152915Nevada✓✓Clinton+544402015South CarolinaClinton+47272963914AlabamaClinton+5930976449Am. Samoa✓Clinton+4342ArkansasClinton+36146662210GeorgiaClinton+435462167329MassachusettsClinton+16075904645OklahomaSanders+101391741721TennesseeClinton+342461214423TexasClinton+3293647714775VermontSanders+7218116016VirginiaClinton+295052766233Colorado✓✓Sanders+1950732541Minnesota✓Sanders+23781263146Louisiana✓Clinton+48222723714Nebraska✓✓Sanders+1414191015Kansas✓✓Sanders+3513261023Maine✓✓Sanders+291630817MichiganSanders+15825996367MississippiClinton+6618738315N. Marianas✓✓Clinton+2042Florida✓Clinton+311,10156914173IllinoisClinton+21,0409997977MissouriClinton+03123113635North CarolinaClinton+146234676047OhioClinton+136975358162Dems abroadSanders+38112449Arizona✓Clinton+152621934233Utah✓Sanders+591560627Idaho✓Sanders+57519518Hawaii✓Sanders+401024817Washington✓Sanders+46621672774Alaska✓✓Sanders+5928313WisconsinSanders+144345703848Wyoming✓✓Sanders+113477New York✓Clinton+161,134820139108Pennsylvania✓Clinton+1292272210683Rhode IslandSanders+1253671113Connecticut✓Clinton+51701522827Delaware✓Clinton+215637129Maryland✓Clinton+295733106134IndianaSanders+53033353944Guam✓✓Clinton+191143West VirginiaSanders+16861231118Kentucky✓Clinton+02132112827Oregon✓Sanders+132643472635TotalClinton+1213,46310,5441,7711,499Democratic votes and delegates based on actual resultsPopular vote in Iowa, Nevada, Maine, Washington and Wyoming is estimated based on overall turnout.
Sources: Dave Leip’s Atlas of U.S. Presidential Elections, The Green Papers, U.S. Elections Project
Counting only caucuses, Sanders has won 63 percent of the vote, 64 percent of the delegates and 11 of the 16 contests. In doing so, he has earned 341 elected delegates, compared with Clinton’s 195 delegates, for a margin of 146 delegates. These caucuses have had approximately1 1.1 million participants. As a point of comparison, turnout in the caucuses has been only about 13 percent of the total number of votes President Obama got in the 2012 presidential election in these states.2
Sanders has done far worse in the states that have held primaries. Counting just primaries, including Tuesday’s in Washington,3 Sanders has won only 42 percent of the vote, 42 percent of delegates and 10 of the 34 statewide contests.4 Clinton earned 1,576 elected delegates, compared with Sanders’s 1,158, for a margin of 418. The turnout in these contests has been far higher than in the caucuses, with a little more than 24 million votes cast. That’s about 49 percent of the total number of votes Obama got in the 2012 election in these states.5
Now, it is fair to point out that the caucuses have taken place in states that are demographically different than the primary states. Caucus states in 2016 are overwhelmingly white and overwhelmingly rural compared with primary states. Still, these differences don’t come close to explaining the differences in results between the caucuses and primaries so far. We can look to Nebraska and Washington as two examples of the disparity. Of course, one could argue that because no delegates were up for grabs in those states’ primaries, the campaigns didn’t really compete for residents’ votes and therefore those contests aren’t representative of what a truly competitive primary would look like there. Fortunately, because the vote in the Democratic primary has largely broken down along demographic lines, we can use statistical models to approximate what would happen if states that held caucuses had held primaries instead.
At various times, we’ve tried using demographics to model the vote in the Democratic nomination contest so far. The model considers each 2016 contest and controls for (i) the black and Hispanic share of the Democratic vote in that state in the 2008 general election, (ii) whether that primary or caucus is “open” to independent voters unaffiliated with a political party, and (iii) the margin in national primary polls at the time the contest is held. This model estimates that holding caucuses instead of primaries is a massive advantage for Sanders. In fact, Clinton would do about 20 to 25 percentage points better relative to Sanders if a state changed from a caucus to a primary, the model estimates.
Here’s how we project each caucus would have gone if a primary had been held instead:6
POPULAR VOTE (THOUSANDS)PLEDGED DELEGATESSTATECLOSEDWINNERCLINTONSANDERSCLINTONSANDERSIowaClinton+243011822717Nevada✓Clinton+291851012312Am. SamoaClinton+604151Colorado✓Clinton+63312953531MinnesotaClinton+14023943938Nebraska✓Clinton+779701312Kansas✓Sanders+12911161518Maine✓Sanders+5921021213N. Marianas✓Clinton+393142UtahSanders+39521201023IdahoSanders+373372716HawaiiSanders+1763881015WashingtonClinton+64714185348Alaska✓Sanders+401740511Wyoming✓Clinton+13191586Guam✓Clinton+4210452Current primary statesClinton+1413,0649,8611,5761,158TotalClinton+1215,21611,8801,8471,423Projected Democratic results if caucus states had held primariesSanders fans have claimed that because caucuses have lower turnout the current national caucus and primary vote underrates how well Sanders is doing. In fact, the opposite is true. When we switch all caucuses over to primaries, Sanders actually does worse. Clinton’s lead in the popular vote would grow from 2.9 to 3.3 million votes. Moreover, her edge in elected delegates would expand significantly.7 Instead of her current lead of 272 elected delegates, Clinton would be ahead by 424.8 Some states that were won by Sanders in caucuses, including Colorado and Minnesota, would be won by Clinton in primaries, according to our calculations.
In fact, counting the 537 superdelegates The Associated Press currently gives Clinton, she would likely have 2,384 total delegates if every state had held a primary. That’s one more than necessary to clinch the nomination.
But what would happen if every state held a primary that was open to independent voters? Independent voters, after all, have been among Sanders’s strongest groups, and Sanders supporters have consistently cited closed contests as evidence the game is rigged. We can rerun the same regression as above but estimate what would happen if all the primaries are open to unaffiliated voters.
POPULAR VOTE (THOUSANDS)PLEDGED DELEGATESSTATEWINNERCLINTONSANDERSCLINTONSANDERSIowaClinton+243011822717NevadaClinton+181881302114Am. SamoaClinton+604151ColoradoSanders+63313733135MinnesotaClinton+14023943938LouisianaClinton+392401003615NebraskaSanders+579881213KansasSanders+23901441320MaineSanders+16911271015N. MarianasClinton+303242FloridaClinton+201,15976012985ArizonaClinton+42672483936UtahSanders+39521201023IdahoSanders+373372716HawaiiSanders+1763881015WashingtonClinton+64714185348AlaskaSanders+501648412WyomingClinton+2191977New YorkClinton+41,1461,049129118PennsylvaniaClinton+09159079594ConnecticutSanders+61762002629DelawareClinton+958491110MarylandClinton+185813995639GuamClinton+3111652KentuckySanders+102052562431OregonSanders+252514182338Current open primary statesClinton+128,1466,429956715TotalClinton+815,29813,0241,7821,488Projected results if every state had held an open primaryAn “open” primary allows the participation of voters not registered with either major political party.
Clinton’s margin in the national popular vote shrinks to about 8 percentage points (from 12). That’s because opening a primary to independent voters shrinks Clinton’s margin in a state by about 10 percentage points on average, according to the model. Sanders would also project to win Connecticut and Kentucky, which he lost in the real world when they held closed primaries.
Still, this wouldn’t make all that much difference. Just 11 states9 held closed primaries, so the national vote is mostly reflective of a process open to unaffiliated voters. Indeed, Clinton has won 14 primaries10 open to independent voters, while Sanders has won nine.
In fact, if all states held primaries open to independents — instead of closed primaries, or caucuses of any kind — Clinton might have a larger lead in elected delegates than she does now. The model indicates that Clinton would have a lead of 294 elected delegates, compared with the 272 she holds now. That’s not a huge difference, but it means that Clinton has been hurt at least as much by caucuses as Sanders has been hurt by closed primaries.
Listen to the latest episode of the FiveThirtyEight elections podcast.
https://serve.castfire.com/s:5L8r1/audio/2763840/fivethirtyeightelections_2016-05-26-111040.64k.mp3?ad_params=zones%3DPreroll%2CPreroll2%2CMidroll%2CMidroll2%2CMidroll3%2CMidroll4%2CMidroll5%2CMidroll6%2CPostroll%2CPostroll2%7Cstation_id%3D4278Subscribe: iTunes |Download |RSS |VideoWhat would happen if the primary system conformed to each candidate’s best-case scenario? (All closed primaries for Clinton and all caucuses open to independent voters for Sanders.) If every state held a closed primary, Clinton would beat Sanders by 19 percentage points and have a 654 elected delegate advantage, we estimate. If, however, each state held an open caucus, Sanders would beat Clinton by 22 percentage points nationwide and have a 496 elected delegate lead. Of course, neither of those scenarios would happen.
Realistically, if you throw everything together, the math suggests that Sanders doesn’t have much to complain about. If the Democratic nomination were open to as many Democrats as possible — through closed primaries — Clinton would be dominating Sanders. And if the nomination were open to as many voters as possible — through open primaries — she’d still be winning.

May 24, 2016
What The Rev. Wright Controversy Tells Us About The Media And Voters
In this week’s politics chat, we revisit a seminal moment from the 2008 Democratic primary. The transcript below has been lightly edited.
micah (Micah Cohen, politics editor): Welcome, everyone! Today, we’re going to use the short documentary we published about the 2008 Obama campaign and the controversy over his former pastor, the Rev. Jeremiah Wright, as a jumping-off point to talk about race, politics and how the media covers “scandals.” Here’s the documentary (we’ll also have a special FiveThirtyEight elections podcast documentary on this topic later this week):
But let’s start with this question: As the documentary makes clear, Obama’s support in Democratic primary polls didn’t really budge after video of the more inflammatory segments from Wright’s sermons blew up into a media firestorm. We don’t know, however, if that’s because voters never were going to ding Obama or if Obama’s “A More Perfect Union” speech on Wright’s comments and race in the U.S. generally (which came just five days after ABC News first aired snippets from Wright’s sermons on March 13) reassured them. Do you all have suspicions one way or the other?
Also, a special welcome to Mike Fletcher, our new colleague from The Undefeated! Welcome, Mike!
farai (Farai Chideya, senior writer): Hi, Mike!
mikefletcher (Mike Fletcher, senior writer at The Undefeated): Hello! Great to be here. On your question, I have to think it was a little of both. People probably thought what they thought, but to some on the fence, I bet Obama’s thoughtful and even-handed speech was reassuring.
harry (Harry Enten, senior political writer): This is the funny thing about studying events in real time — it’s difficult to disentangle one thing from another. For instance, John McCain had his largest lead of the campaign against Obama right around the time of the controversy, but was that because of Wright or because McCain clinched the nomination around the same time? I honestly don’t know.
farai: I also think we in the media sometimes think we’re more influential than we are. Not everyone watches wall-to-wall politics coverage. And network news ratings have been declining for years. So although this was a huge firestorm in the media, I also wonder how deeply it saturated the electorate.
natesilver (Nate Silver, editor in chief): It’s hard to tell because there wasn’t all that long a period between when the Wright tapes came out and when Obama gave his speech. But my hunch is that voters — at least Democratic voters — didn’t care about the story as much as the media did. It was at a fairly late stage of the primary when voters already had a lot of information about Obama, so the marginal impact of new information was relatively low. To the extent it might have rekindled stereotypes about Obama or reminded voters about his race — well, those voters were already voting for Hillary Clinton anyway.
mikefletcher: You got that right, Farai. I think it becomes noise for most people. But for those who had suspicions about Obama, thinking somehow he was more radical than he appeared, this “scandal” had the makings of something significant.
And to Nate’s point, most of those people probably were not going to vote for Obama anyway, not if they were suspicious.
harry: To Farai’s point, a CBS News poll taken during the controversy found that 28 percent had heard a lot about the Rev. Wright’s statements. That compares to 23 percent who had heard nothing at all about it. Most had heard some, not much or nothing at all.
farai: I have to point out, of course, the irony that during the 2008 race, Obama was being asked to refute being a Muslim at the same time that he also had to refute the words of his pastor of 20 years. Voters are not always consistent.
mikefletcher: To say the least … one thing we can’t overlook, though, is that the Obama campaign took this very seriously. Going back to their dis-invitation of Rev. Wright from Obama’s announcement ceremony, they were worried that voters would not know how to process black liberation theology.
farai: There’s also a part of the Obama narrative where, as a multi-racial man raised both in the U.S. and abroad, he arguably got racial cred by marrying a woman from the South Side of Chicago and also by going to a traditionally black church. Wright’s church was not just a place of worship but, as so many black churches are, a place where people convene to talk business and politics.
natesilver: In some sense, though, I wonder if voters had gotten to know Obama well enough by the time this really blew up that they knew Rev. Wright didn’t speak for him. Obama referred to Wright as “an old uncle” on a couple of occasions and that may have resonated with people. They weren’t so naive or literal-minded as to think, “Oh, Obama’s a closet radical, and this proves it.” The people who felt that way weren’t voting for Obama in the first place.
harry: Right. The majority of voters had an opinion of Obama by this point in the campaign. CBS News found that 68 percent of registered voters could form an opinion of Obama by late February 2008 (and that poll specifically gave respondents the option of answering “undecided” or that they don’t have an opinion). Among Democrats, it was 74 percent. That’s pretty high for a first-term senator from Illinois.
micah: Yeah, voters aren’t stupid. But that also gets us to another point: Even if the Wright controversy didn’t have much of an effect on the Democratic primary horse race, it did tell us something about how Obama, the media and voters would respond to the first black president, right?
natesilver: It showed us a little bit about how Obama stayed cool under pressure instead of wetting the bed.
mikefletcher: As to what that episode foretold about how the nation would see the first black president, I think there is an extra layer of skepticism in how people see him, which led him — early on, particularly — to be very cautious on the issue of race.
farai: I agree, Mike. I also think of this quote attributed to Martin Luther King Jr.: “It is appalling that the most segregated hour of Christian America is eleven o’clock on Sunday morning.” One of the things that happened in this instance is that the Wright controversy exposed the very different cultural codes in which people speak. And looking past the “More Perfect Union” speech, we saw the country again separate into coded language and recriminations.
micah: So that’s interesting … the response to Wright was an early sign that there would be a not insignificant group of Americans who would traffic in these race-freighted “controversies” regarding Obama, right?
Farai, you mentioned the Muslim accusations, but there was also the flag pin kerfuffle and all the “proud of my country” craziness with Michelle Obama.
You can draw a line from a lot of criticisms of Obama, then and now, to his race, and that was becoming more and more clear in the spring and summer of 2008.
farai: First off, there has never been a moment in American history when race didn’t matter … just more and less contentious moments. Second, it’s worth contextualizing the controversies about Barack and Michelle Obama by also noting that Obama had to convince the black political establishment of his bona fides early in the 2008 race — early Congressional Black Caucus member endorsements went to Clinton, for instance. But nonetheless, once Obama was elected, there was a period of racial detente, followed by a backlash. A 2010 Gallup poll found 13 percent of Americans said they were greatly worried about race relations; today that figure is 35 percent.
mikefletcher: No doubt. Interestingly, it seems that having a black man in the Oval Office made many people freer with their sense of grievance. And the recriminations flow from there. Studies have found that with Obama as president more issues — things like health care reform — have become “racialized.”
natesilver: Let me bring up one point, just because I think it tends to get lost. You can argue that the handling of the Wright controversy was pretty important to superdelegates. They came to Obama’s side over the course of the campaign and — although he also won more pledged delegates — allowed him to avoid what could have been an incredibly fractious convention in Denver. If the superdelegates had the sense that Obama was a closet radical or was unelectable because of his association with Wright, they could have caused problems.
The general theme, I suppose, is that the Wright controversy may have mattered more to elites — the media and superdelegates — than to rank-and-file voters.
harry: Well, I think that’s why the story of the Wright controversy really wasn’t just a March story. It lasted all the way to early May and the Indiana and North Carolina primaries. Once Obama won North Carolina by a wide margin and came close in Indiana, superdelegates concluded that Obama wasn’t electoral poison.
mikefletcher: I have a hard time imagining Obama winning — in both the primary and general — if he had not cut ties with Rev. Wright. And that had to be painful for him. But can you imagine how that issue would have been distorted over time? I think it would have eventually trickled to the masses.
micah: So let’s talk a little bit more about how the media handled the Wright story. One thing that was interesting to me in going back through the coverage was that the media covered the Wright story mainly through the lens of the horse race — that this endangered Obama’s chances of winning — but as we’ve said, that’s not really right. But where does that leave us? Should this have been a one-day story? Not a story at all? Or should it have been covered differently?
natesilver: To situate the story a bit: The Wright tapes became a big story at a time when (i) the primary calendar was significantly slowing down and there was a long lull before the next key contest, in Pennsylvania, and (ii) Obama upsetting the Clinton juggernaut was becoming a less exciting story for the media than the possibility of a Clinton comeback. So I think one can always be skeptical of the timing and what metastasizes into a bigger controversy and what does not. This wasn’t the first time voters had heard of Rev. Wright either, by the way.
farai: One thing that’s not covered in the documentary is that the Wright story continued, in part because of Wright himself, who continued to take the spotlight. He made an appearance at the National Press Club. Jelani Cobb, who now writes for the New Yorker, wrote this in a 2008 blog post: “In the wake of his press club appearance you heard disparate rumblings that are growing into a chorus of condemnation. The difference is that these jeers are now coming from black people.” So that also mitigated, for Obama, the idea that he had betrayed his pastor.
mikefletcher: And let’s face it, the clips of Rev. Wright’s most inflammatory sermons played into a fear narrative. If the question of whether or not Obama wore a flag pin was news, this was certainly going to be a running story. In a perfect world, it would have been presented in the context of black church traditions, but …
farai: Between the Wright controversy hitting ABC News and the “More Perfect Union” speech and Wright defending himself in venues like the National Press Club, Obama had to constantly reassure black, white and other voters that he was a sort of racial Switzerland — neutral. That was hard to pull off and arguably a testament to his oratory skills and campaign.
harry: What’s interesting here that gets lost now and may get lost to a younger generation is that this election was a pretty big freaking deal. Obama was clearly leading in the elected delegate count (as the documentary shows). He was going to be the Democratic nominee for president at a time when the incumbent Republican president was deeply unpopular. Obama, therefore, was not only likely to be the first non-white major party nominee, but he also had a very good shot at the presidency. And then here comes a story that plays in to the worst fears of a certain segment of white voters, who saw Wright as radical on race and thought maybe he could be offering advice to the next president. The fact that voters saw through that and trusted Obama was a turning point that I’m not sure would have been accomplished 15 years earlier, when a majority of Americans still didn’t believe in interracial marriage.
micah: But this also gets at how the media’s preferred frames — the horse race and “scandal” — miss so much (we’re guilty of this too). You could do an interesting story on Wright, on the black church and on race in American politics in 2008. But that’s not the story (most of) the media told.
natesilver: That’s often the case — the media is interested in scandal and gossip and in some ways is a lot more frivolous than the voting public.

May 23, 2016
Elections Podcast: The General Election Polls Tighten
Guest host Micah Cohen and the elections podcast crew discuss the latest general-election polls, which show the race tightening between Hillary Clinton and Donald Trump, and the growing tension between Bernie Sanders and the Democratic National Committee. Plus, what to make of the Washington Post poll about the DC football team’s
May 19, 2016
The Hidden Importance Of The Sanders Voter
Donald Trump has gained on Hillary Clinton in recent national polls after becoming the presumptive GOP nominee this month. But Trump may also be helped by the ongoing primary battle between Hillary Clinton and Bernie Sanders. Although Clinton’s substantial lead in pledged delegates (and larger lead in overall delegates) makes her the all-but-certain Democratic nominee, her lack of support from Sanders voters is harming her general election numbers.
According to the most recent YouGov poll, 61 percent of Sanders voters have an unfavorable view of Clinton, against just 38 percent with a favorable one. YouGov has been tracking these numbers for several months,1 and they’ve gradually gotten worse for Clinton:
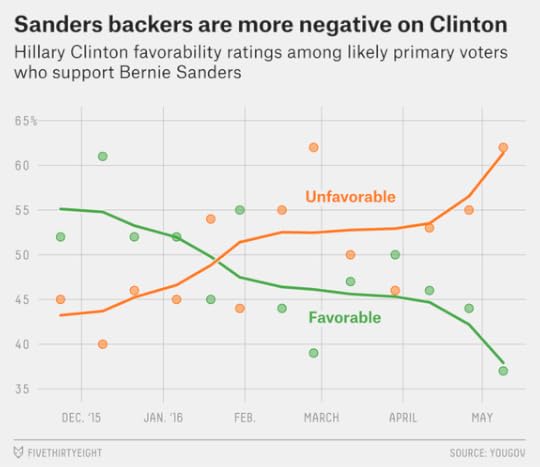
The good news for Clinton is that she has the opportunity to gain ground among Sanders voters if and when she officially wraps up the nomination, just as Trump did among Republicans. Although many Sanders supporters will start the general election campaign with a negative view of Clinton, they aren’t necessarily eager to vote for Trump. In the YouGov poll, just 55 percent of Sanders supporters said they’d vote for Clinton over Trump in November. However, only 15 percent said they’d vote for Trump. That leaves 30 percent of Sanders voters who say they are undecided, would vote for a third-party candidate or would sit out the election.
There’s a key twist, though, in tracking how Sanders voters are affecting Clinton’s general election prospects. Unless you break out the numbers for Sanders voters specifically, as YouGov does, you may miss their importance.
That’s because a lot of Sanders voters don’t identify as Democrats. Exit polls have been conducted in 27 primary and caucus states so far, and Clinton has won among voters who identify as Democrats in all but Vermont, New Hampshire and Wisconsin (where she tied Sanders). But she’s won self-identified independents only in Alabama, Georgia and Mississippi. (I keep using that term “self-identified” because the exit poll asks voters how they “usually think of” themselves — Democrat, Republican or independent. A voter’s self-identification may differ from her party registration, and some states do not have party registration at all.)
STATEMARGIN AMONG DEMOCRATSMARGIN AMONG INDEPENDENTSINDEPENDENT SHARE OF DEMOCRATIC ELECTORATEAlabama+73Clinton+8Clinton20%Arkansas+58Clinton+19Sanders24Connecticut+21Clinton+51Sanders20Florida+42Clinton+13Sanders17Georgia+55Clinton+3Clinton20Illinois+15Clinton+39Sanders21Indiana+6Clinton+44Sanders22Iowa+17Clinton+43Sanders20Maryland+39Clinton+12Sanders17Massachusetts+20Clinton+33Sanders33Michigan+18Clinton+43Sanders27Mississippi+75Clinton+32Clinton13Missouri+11Clinton+34Sanders24Nevada+18Clinton+48Sanders18New Hampshire+4Sanders+48Sanders40New York+24Clinton+44Sanders14North Carolina+32Clinton+25Sanders27Ohio+29Clinton+33Sanders24Oklahoma+9Clinton+48Sanders27Pennsylvania+24Clinton+46Sanders15South Carolina+60Clinton+7Sanders16Tennessee+48Clinton+9Sanders23Texas+50Clinton+6Sanders26Vermont+64Sanders+84Sanders41Virginia+42Clinton+16Sanders22West Virginia+4Clinton+37Sanders34WisconsinTie+44Sanders27National+27Clinton+31Sanders24Clinton dominates among Democrats, Sanders among independentsSource: National Exit Polls
Overall throughout the primaries and caucuses, I estimate, Clinton is beating Sanders by 27 percentage points among self-identified Democrats but losing to Sanders by 31 points among voters who call themselves independents but voted in the Democratic primaries.2 This might be confusing because we usually think of independent voters as being moderate. Sanders voters, however, are definitely to the left of Clinton, but a lot of them don’t like to call themselves Democrats. (Sanders himself, of course, has repeatedly been elected to Congress as an independent and did not officially declare himself to be a Democrat until November.) As a result, about 40 percent of Sanders’s primary and caucus voters identify as independent, as Republican or with some party other than Democrats, according to my estimates.
Thus, citing Clinton’s reasonably strong general election numbers among self-identified Democrats — she had the support of 87 percent of Democrats in a recent NBC News/SurveyMonkey poll in her matchup against Trump, for instance, and 83 percent in a Fox News poll that showed her behind Trump nationally — may miss her problems among liberal-leaning, Sanders-voting independents. In the Fox News poll, only 30 percent of independents went for Clinton, and in the SurveyMonkey poll, just 36 percent did. But both surveys showed a large pool of undecided independents, potentially the Sanders voters that YouGov identified.
If Clinton wins over those voters, she’ll gain a few percentage points on Trump in national and swing state polls, and the race will potentially look more like it did in March and April, with Clinton having a fairly comfortable lead over Trump. If not, the general election could come down to the wire.

Nate Silver's Blog

- Nate Silver's profile
- 730 followers

