
Nate Silver's Blog, page 126
August 21, 2016
Election Update: National Polls Show The Race Tightening — But State Polls Don’t
Hillary Clinton moved into a clear polling lead over Donald Trump just after the Democratic convention, which ended on July 28. Pretty much ever since, the reporters and poll watchers that I follow have seemed eager to tell the next twist in the story. Would Trump’s numbers get even worse, possibly leading to the first double-digit victory for a Democratic presidential candidate since 1964? Or would Trump mount a comeback? As of last Tuesday, there wasn’t much evidence of an overall shift in the race. Trump was gaining ground in some polls but losing ground in a roughly equal number of them.
Since then, Trump has gotten some slightly better results, with national polls suggesting a race more in line with a 5- or 6-percentage-point lead for Clinton instead of the 7- or 8-point lead she had earlier in August. But state polls haven’t really followed suit and continue to show Clinton with some of her largest leads of the campaign. Trump received some decent numbers in Iowa and Nevada, but his polls in other swing states have been bad.
Overall, Trump has gained slightly in our forecasts: He’s up to a 15 percent chance of winning the Electoral College in our polls-only model, up from a low of 11 percent a week ago. And he’s at 25 percent in polls-plus, up from a low of 21 percent. But the evidence is conflicting enough that I don’t think we can rule out a larger swing toward Trump or, alternatively, that his position hasn’t improved at all.
Let’s start with those national polls. In the table below, I’ve listed every national poll that we’ve added to our database since Tuesday and how it compared to the previous poll from the same pollster, if there was one.1
MARGINDATEPOLLSTERNEW POLLPREVIOUSSHIFTAug. 18-20Morning ConsultClinton +3Clinton +6Trump +3Aug. 14-20USC Dornsife/LA TimesTrump +2Clinton +5Trump +7Aug. 14-18IpsosClinton +7Clinton +7—Aug. 11-17CVOTER InternationalClinton +4Clinton +4—Aug 15-16Rasmussen ReportsClinton +2Clinton +3Trump +1Aug. 14-16YouGovClinton +6Clinton +6—Aug. 9-16Pew ResearchClinton +4Clinton +9Trump +5Aug. 15Gravis MarketingClinton +4Clinton +5Trump +1Aug. 9-15Normington PettsClinton +8Aug. 8-14SurveyMonkeyClinton +6Clinton +6—Aug. 12-13Zogby AnalyticsClinton +2Clinton +3Trump +1AverageTrump +2Recent national polls show a slight shift toward TrumpA number of these polls show no change. But where there have been shifts, they’ve been toward Trump, particularly in the USC Dornsife/Los Angeles Times tracking poll, which now shows a 2-point lead for Trump after having Clinton modestly ahead before, and in Pew Research’s most recent poll, which has Clinton with a 4-point lead as compared with the 9-point lead Pew showed her with before the conventions.
You can, of course, pick apart the individual polls if you like. The USC/Los Angeles Times poll makes some unorthodox methodological choices; I happen to like some of these choices and dislike others, but overall, they produce a poll that’s significantly more Trump-leaning than other pollsters. And I’m not sure anyone should be crowing about Zogby Analytics polls, which have been highly inaccurate historically. But there are ways to adjust for these things, and they don’t obscure the fact that the trend in national polls has mostly been toward Trump.
State polls tell another story, however. Here’s every state poll we’ve added since Tuesday:2
MARGINSTATEDATEPOLLSTERNEW POLLPREVIOUSSHIFTOhioAug. 17-19YouGovClinton +6Clinton +4Clinton +2IowaAug. 17-19YouGovTieTrump +1Clinton +1Ga.Aug. 17Opinion SavvyTieTrump +3Clinton +3Nev.Aug. 15-17SuffolkClinton +2S.C.Aug. 15-17Gravis MarketingTrump +4N.C.Aug. 15-17Gravis MarketingTrump +1Ind.Aug. 13-16MonmouthTrump +11Colo.Aug. 9-16QuinnipiacClinton +8Trump +11Clinton +19Va.Aug. 9-16QuinnipiacClinton +11IowaAug. 9-16QuinnipiacClinton +2Fla.Aug. 12-15MonmouthClinton +9TexasAug. 12-14PPPTrump +6Va.Aug. 11-14Washington PostClinton +7Miss.Aug. 11MagellanTrump +13Mich.Aug. 9-10Mitchell ResearchClinton +11Clinton +6Clinton +5Mo.Aug. 8-9PPPTrump +3Trump +10Clinton +7AverageClinton +6State polls continue to show Clinton gainsAs I wrote earlier, Iowa and Nevada have been relative bright spots for Trump, with Clinton leading only narrowly even in post-convention surveys. But those states have only 6 electoral votes each, and Trump’s numbers are bad pretty much everywhere else. Since Tuesday, for instance, he’s gotten polls showing him down 6 points in Ohio, 9 points in Florida and 11 points in Virginia — and only tied with Clinton in Georgia. I suppose you can count polls showing Trump ahead by double-digits in Indiana and Mississippi as good news for him, since they’re states that could conceivably have gone to Clinton in a landslide. Then again, other polls this week showed competitive races in Missouri and Texas. Our model thinks that these polls are consistent with Clinton continuing to hold a lead in the mid- to high single digits: You probably wouldn’t get a set of results like these if she was up by only 5 percentage points nationally.
Moreover, these state polls show highly favorable trend lines for Clinton, where they’re available. Among the six polls that had previously surveyed the same state, Clinton gained ground in every one, with an average swing of 6 percentage points toward her. A caution: The average shift is inflated by a Quinnipiac poll of Colorado which found Clinton up 8 points; Quinnipiac had implausibly showed an 11-point lead for Trump when it surveyed the race in November. Even without that poll, however, Clinton’s average gain is 4 percentage points, still pretty good.
There are a couple of further nuances that explain some of the differences. Most of the recent national polls are daily or weekly tracking polls conducted online or via automated surveys, and these tracking polls have generally been a relatively friendly group for Trump. He hasn’t fared well recently in traditional telephone surveys, by contrast, with one or two exceptions like his not-so-bad result in the Pew Research poll. Also, looking at the trend lines doesn’t quite make for an apples-to-apples comparison, because most of the national polls have surveyed the race multiple times since the conventions, while the state polls haven’t. It’s plausible that Clinton is polling slightly off her post-convention peak, as the national polls suggest, but ahead of where she was for most of the pre-convention period, as the state polls suggest.
Still, our model perceives an increasing conflict between state and national polls. Polls-only calculates a national polling average, which has Clinton up by 6.2 percentage points, down from a peak of 8.0 percentage points on Aug. 15. But it also infers an estimate of the popular vote from state polls, and that continues to have Clinton ahead by 7 to 8 points. The 1- or 2-point gap between these estimates doesn’t matter much for now, since Clinton is comfortably ahead either way. But it could become pertinent if the race tightens; it was pertinent in 2012, when state polls continuously (and correctly, it turned out) showed President Obama in better shape than national polls did.
I’m not going to get too much more into the weeds for now. The past week was pretty light for polling and sometimes these differences resolve themselves as you accumulate more data. Maybe this week, we’ll get a couple of national polls showing Clinton 11 points ahead, but others showing her only tied with Trump in Pennsylvania and Wisconsin, or something.
In terms of interpreting our forecasts, though, you should know that our models mostly rely on state polls to estimate the level of the race, whereas they lean heavily on input from national polls to estimate the trend. Thus, polls-only has Clinton ahead of Trump by about 7 percentage points nationally, a result more in line with the most recent state polls than with the most recent national polls. But it also detects a modest trend toward Trump, something the national polls show but the state polls don’t yet.


August 18, 2016
Trump Is Doubling Down On A Losing Strategy
One quirk of the American political system is that a candidate can win a primary with a much narrower slice of the electorate than he’d need to win a general election. Donald Trump claimed 45 percent of the vote in Republican primaries and caucuses this year, about 14 million votes. That’s a healthy total as these things go: the highest number of votes ever received by a Republican in the primaries. But Trump will need four or five times as many votes — perhaps 65 million — to win in November. His primary voters are just a drop in the bucket.
All presidential candidates face some version of this problem. But most make at least some effort to expand beyond their base and build a majority coalition. Trump hasn’t — and he has his work cut out for him like no nominee in history. Trump’s decision this week to make Stephen Bannon of the combative, anti-establishment website Breitbart News his campaign’s chief executive suggests that he’s moving in the opposite direction.
In January, even as he stood atop Republican primary polls, Trump was exceptionally unpopular with general election voters. At that time, Trump had a 33 percent favorable rating and a 58 percent unfavorable rating with the general electorate. Today? His numbers are even worse. His favorability rating is just 32 percent, according to the HuffPost Pollster aggregate, while his unfavorable rating has risen to 65 percent.
Trump is helped by the fact that Hillary Clinton might be the second-most-unpopular nominee ever, after Trump. But still, remarkably few Americans are willing to commit to voting for Trump. In the table below, I’ve listed every poll from a 2012 swing state1 taken since the conventions. On average, Trump has just 37 percent of the vote in these polls (Clinton has 44 percent). That puts him on par with Barry Goldwater and George McGovern, who each got 38 percent of the vote in their respective landslide defeats of 1964 and 1972.
STATEPOLLSTERTRUMPCLINTONJOHNSONColoradoMarist College29%41%15%VirginiaMarist College314312New HampshireVox Populi Communications314111MichiganGlengariff Group32418New HampshireMassINC Polling Group32478MichiganEPIC-MRA32438MichiganMitchell Research33449ColoradoQuinnipiac University334116VirginiaQuinnipiac University344511WisconsinMarquette University34479OhioMarist College353912IowaMarist College353512PennsylvaniaFranklin & Marshall College36495PennsylvaniaMarist College36459FloridaMarist College36419North CarolinaMarist College36459New HampshireYouGov36455PennsylvaniaSusquehanna Polling & Research37467VirginiaYouGov37497IowaSuffolk University37366New HampshirePublic Policy Polling3750—IowaQuinnipiac University394112FloridaSuffolk University39434PennsylvaniaQuinnipiac University39487VirginiaThe Washington Post39469FloridaMonmouth University39486NevadaRasmussen Reports404110FloridaYouGov40455NevadaYouGov41434North CarolinaPublic Policy Polling41437PennsylvaniaPublic Policy Polling42454OhioQuinnipiac University42448FloridaQuinnipiac University43437FloridaPublic Policy Polling4346—FloridaOpinion Savvy44456North CarolinaSurveyUSA46426Average37448Trump is stuck in the 30s in swing state pollsTrump will probably finish with more than 37 percent by picking off some undecided and third-party voters.2 Still, with almost two-thirds of voters holding an unfavorable view of Trump, it’s not clear how many more people he can rally to his side without a big change in tone and message.
So it’s not surprising that Trump has undertaken a major shakeup of his campaign, hiring Bannon and promoting the pollster Kellyanne Conway. Campaign Chairman Paul Manafort has effectively been demoted. But rather than make a much-expected “pivot” toward general election voters — as Manafort had reportedly been pushing for — the new plan is to “let Trump be Trump,” doubling down on the strategies that Trump used to win the nomination, including an emphasis on nationalism, populism and “brutal fights with Clinton”:
Huge rallies. Gloves off. Brutal fights with Clinton. Heavy emphasis on nationalism and populism. That's the Bannon strategy.
— Robert Costa (@costareports) August 17, 2016
If you trust the polls, this seems like a fundamental strategic error. Trump is running worse than Mitt Romney among almost all demographic groups; white men without a college degree are the most prominent exception. But there aren’t enough of those men to form a majority or really even to come all that close.
How do we know that the rest of the electorate isn’t craving a Trumpier Trump? Because in contrast to the primaries, the general election has followed a fairly predictable course. Incidents that people expected to hurt Clinton’s polling numbers, such as the FBI’s repudiation of her use of a private email server as secretary of state, in fact hurt them. The same is true for Trump. Voters strongly disapproved of Trump’s criticism of Gonzalo Curiel, the judge in the Trump University lawsuit, and his later criticism of Khizr and Ghazala Kahn, the parents of a Muslim-American soldier killed in action, and these incidents were associated with declines for Trump in the polls. And voters continue to doubt whether Trump has a presidential temperament, a vulnerability the Clinton campaign has continuously exploited in advertisements and speeches.
What’s more, Trump already doubled down on Trumpism at the Republican convention, with a disorganized program and gloomy acceptance speech full of nationalist and populist themes. The result was a convention that left most voters with a worse impression of Trump and the Republican Party. Clinton went from having roughly a 3 percentage point lead just before the conventions to more like a 7 or 8 point lead just afterward, and her advantage has held roughly steady ever since. August is still too soon to declare any presidential campaign over. But Trump and his acolytes seem to be in profound denial about the narrowness of their appeal.

August 17, 2016
Usain Bolt Is Great — But How Can We Know If He’s The Greatest?
We’re on the ground in Rio covering the 2016 Summer Olympics. Check out all our coverage here.
Welcome to the latest episode of Hot Takedown, FiveThirtyEight’s sports podcast. On this week’s show (Aug. 16, 2016), FiveThirtyEight editor-in-chief Nate Silver joins us to talk about his Olympics viewing schedule and what would happen if the medal table were weighted toward the most popular sports. Then we talk to FiveThirtyEight’s Allison McCann, on location in Brazil, about the quarterfinal loss by the U.S. women’s national soccer team. Finally, we discuss Usain Bolt, who on Sunday won his third straight Olympic gold medal in the 100 meters. Is he already the greatest Olympian of all time? How can we quantify that anyway? Plus, a significant digit on the amount of money spent by English Premier League teams during the summer transfer window.
Links to what we discuss are here:
Nate Silver investigates which countries medal in the sports that people watch the most.Carl Bialik writes that according to FiveThirtyEight’s odds, the USWNT probably wasn’t going to win Olympic gold anyway.ESPN’s Stats & Information Group breaks down the numbers behind the U.S.’s loss to Sweden.Laura Wagner at Slate thinks the USWNT will be fine as long as it dumps goalkeeper Hope Solo.The New York Times uses a series of graphics to show how Bolt compares with 100-meter Olympic champions of the past.The Times breaks down how Bolt came from behind to win.Significant Digit: £794 million. That’s the amount of money spent by EPL teams in the 2016 summer transfer window, through the beginning of August. There are still two weeks to go before the window closes, and spending looks like it will break the EPL record of £870 million that was set last year.
Trump Still Has A Chance — Doesn’t He?
In this week’s politics chat, we try to present the upside case for Donald Trump. The transcript below has been lightly edited.
micah (Micah Cohen, politics editor): Lots of our election coverage of late (here, here, here and here, for example) has been about the presidential race settling into what seems like a new equilibrium: Hillary Clinton leading Donald Trump by about 7 or 8 percentage points nationally. She’s a clear favorite according to our models, with an 87 percent chance of winning according to polls-only and a 76 percent chance according to polls-plus. But that still leaves Donald Trump with a 13 percent or 24 percent chance of a comeback. So, today, let’s talk about the universes contained in those probabilities. Trump can still win, but how?
To start, though: He can still win, right?
harry (Harry Enten, senior political writer): Absolutely, but he’s a heavy underdog. I’m going to cover this more in a forthcoming piece, but Gerald Ford looked like a goner at this point in 1976. He still lost, but by only 2 percentage points. Of course, the problem with any of these historical comparisons is that Trump isn’t Ford. Then again, Trump isn’t like anyone.
natesilver (Nate Silver, editor in chief): Sure he can win. Just bring in a turnaround expert like Roger Ailes and everything will be fine.
clare.malone (Clare Malone, senior political writer): The “settling” narrative makes me very nervous, though. (On a number of fronts in life, but this presidential election specifically.) Part of me has been traumatized into believing that anything we decide as narrative for a period of three weeks or so will be immediately upended.
micah: So the models peg the chances of things being upended in Trump’s favor somewhat differently — why is polls-plus more bullish on Trump than polls-only?
natesilver: Micah, you ought to know that as the politics editor!
micah: I’m asking on the reader’s behalf, Mr. Silver.
natesilver: Polls-plus assumes the race will tighten because an 8-point lead for Clinton is out of whack with “the fundamentals” (mostly, the economy). And it’s early enough that the polls have a fair bit of time to move.
Polls-only takes more of a what-you-see-is-what-you-get approach. An 8-point lead now projects to an 8-point win on Election Day, although with a lot of uncertainty on either side of that.
If Trump were a normal candidate, we’d be doubtful that the equilibrium of the race is really an 8-point Clinton lead.
micah: Why?
natesilver: Because usually both candidates are about equal in presidential races, so “the fundamentals” tend to prevail. I’d note, however, that this isn’t true in Senate races or gubernatorial races, which don’t particularly tend to tighten down the stretch run.
And in Senate and gubernatorial races, you have much wider variation in candidate quality.
harry: (Trump isn’t a good candidate.)
natesilver: It’s not like Todd Akin or Carl Paladino or Christine O’Donnell closed their races strongly.
harry: And I should note that Trump’s favorable rating is 31 percent per the Gallup tracker. That’s lower than at any point since the conventions.
micah: But I wanna talk about why the race could tighten!
clare.malone: As Nate alluded to above, Twitter is abuzz with the news that Roger Ailes is now advising Trump. People are basically asking how this might affect things — obviously, that’s only a single person, so I’m skeptical about how much impact Ailes will have, especially since Trump seems to ignore a lot of the professional advice he’s given.
harry: No matter how good a magician is, if the bunny in his or her hat is dead, the magician will stink. I don’t know if Ailes can do anything.
natesilver: You could argue that no person is singularly more responsible for Donald Trump, and the potential disaster he is for the Republican Party, than Roger Ailes. So it would be fitting, in some ways.
micah: But couldn’t Ailes help get Trump to behave? Or, forget Ailes — what if Trump starts acting like a normal candidate? I don’t think there’s really any chance of this happening, but if it did, couldn’t the race shift to be more in line with the fundamentals and tighten? How many Americans haven’t even tuned into the election yet? [Editor’s note: After we concluded this chat, news broke that Trump was reshuffling his campaign staff further, reportedly elevating more aggressively minded people who don’t want him to temper his style. So, yeah, it seems unlikely that Trump will start acting like a traditional candidate.]
natesilver: The problem is that Ailes, like Trump, exists in a bubble where they confuse the sentiments of 35 percent of America for the country as a whole.
harry: Could Trump change? I doubt it. But put Trump aside for a second. We have seen presidential candidates gain 7 or 8 percentage points. What got me in trouble in the primary was ignoring the polls. Or more specifically, seeing in the polls what I thought they should say. The polls right now have Clinton as a clear favorite. Yet past elections indicate that a Clinton win isn’t a foregone conclusion. So I’ll trust that for now.
clare.malone: Let’s play a party game — if Trump were “Acting Normal” where do we think the race would be?
micah: If he had been acting normal all along? Or started now?
clare.malone: Not “Trump is a normal candidate all along” — this takes into account his erratic history.
micah: I think Trump would be doing a little worse than where the polling was after the GOP convention — maybe down 2 to 3 points. Trump edged into a tie with Clinton before the Democratic convention; that’s probably a good barometer of where things might be if Trump started hitting all his marks perfectly from now until November. Clinton, it’s easy to forget, isn’t very popular.
natesilver: Meh, I’m not impressed by Trump’s post-convention lead. Walter freaking Mondale was ahead in at least one poll after his convention. Considering how many undecideds there were, Trump’s convention bounce was pretty feeble.
harry: I saw Mondale at the Democratic convention this year. Looked good.
micah: You’re missing my point, Nate.
natesilver: Maybe I think it’s a stupid point!!!!!!!!!!!
Asking “what if Trump were normal” is a nonsensical question.
clare.malone: No, no. It’s asking where he’d be if he hadn’t screwed up too much in the last month to six weeks — i.e., if the pivot to the general election had gone well.
natesilver: But what if the same characteristics that prevented him from pivoting are the same ones that allowed him to win the primary?
It’s a bit like asking, “What if Dennis Rodman had a good midrange jumper?” You have a freakazoid of a player, and it all sort of works, but under relatively narrow conditions. You can’t change that one thing without the whole package being different. If Dennis Rodman had a good midrange jumper, he wouldn’t be Dennis Rodman.
harry:
micah: Harry, has a presidential candidate ever come back from being down 7 to 8 points or more in mid-August?
harry: There are three ways to answer that, Micah. The first, most basic answer is “yes”: George H.W. Bush in 1988. The second answer is “no one has ever come back from being 7 to 8 points down this long after both conventions.” Not since the use of modern polling anyway. The third answer is that there have been cases in which the margin separating the candidates closed by more than 7 to 8 percentage points at this point after the conventions. It just so happened that one candidate was way ahead, so the leading candidate still won.
natesilver: Yeah, there have been a few races where there was a 6 to 8 point shift in the polls after the conventions. They didn’t happen to result in the candidate who was ahead losing, however.
micah: We’re not doing a very good job of being Trump optimists.
Is his only hope a Clinton scandal? That WikiLeaks has some incredibly damning something or other on Clinton?
clare.malone: People I have talked to in that world have kinda brought up scandal and/or external events like terrorist attacks as ways that Trump comes back in the final stretch. Which is … dark.
I think Wikileaks could be saving up something it thinks could shake things up in the final weeks. Or it could totally miscalculate and what it has won’t make a bigger splash than what’s already out there.
natesilver: To me, if you’re waiting for Trump to pivot as the mechanism for a comeback, you’re going to be waiting for an awfully long time. But it’s possible to imagine various sorts of events giving Clinton problems.
At the couple of points in the race where things looked pretty close, it wasn’t that Trump was popular but that Clinton had become almost as unpopular.
The third-party vote is a little bit of a risk factor also. Gary Johnson and Jill Stein seem to be drawing more support away from Clinton than from Trump.
harry: And that is still true since the conventions. I did some math in some spreadsheets: Clinton’s lead is larger in polls that don’t include Johnson or Stein.
micah: So maybe WikiLeaks drops something on Clinton and Johnson gets into the debates?
clare.malone: I think that’s definitely a scenario that could happen.
harry: Let me add a third one: Something could happen during the debates. Maybe Trump says something about Bill Clinton that Hillary Clinton wasn’t expecting? And it throws her off somehow into making a huge error?
micah: Can debates affect the race that much?
clare.malone: The debates certainly have the potential to bring up awkward questions — like about Juanita Broaddrick — but I have to think her team is prepping her for the very worst.
natesilver: Historically, the debates might move the race by 3 to 4 percentage points, and even that can be fleeting.
harry: Small sample size, people.
natesilver: Sure.
micah: BAM!
I think Clare’s right, though. I have to imagine Clinton is prepping for the worst.
natesilver: I suppose I wonder if the media isn’t itching to write the Trump comeback narrative, and how a minor misstep for Clinton could be magnified, sort of how it was for President Obama in 2012 at the first debate.
Now, of course, there are a lot of problems with that theory, such as the fact that (i) Trump has a habit of stepping on his own good fortune and (ii) Many people in the media are genuinely disdainful of Trump, so there seems to be less false balance than usual.
clare.malone: I think the only thing that in my mind could really throw Clinton to a disadvantage is a terrorist attack. God forbid that happens, but that’s the scenario I see as putting her most back on her heels.
Well, and maybe Wikileaks — like if something truly suspect comes out, since we all know she’s pretty terrible about answering email questions.
micah: I used to think that, Clare, but we’ve had some attacks that didn’t move the race that much.
clare.malone: Yeah, but it might depend on the nature or location of an attack.
micah: True.
So Clinton is up 8. Let’s say the debates go really well for Trump, whether because he does amazing in them or because the media wants to write the Trump comeback narrative. That shaves a couple of points off Clinton’s margin. Then WikiLeaks drops a bombshell. Suddenly Clinton is only up 2 or 3 percentage points.
harry: Right.
micah: And it’s October.
Couldn’t that drop compound on itself?
natesilver: The polls could be a bit off too. People got used to the pinpoint precision we had in 2004 or 2008. If Clinton’s +3 on the morning of the election, that could turn into Trump +1 … or Clinton +7.
I’ll argue pretty vehemently against people who think the polls are necessarily skewed against Trump. But they could be off in either direction, for sure.
harry: Right. The polling wasn’t so hot in 1996 or 2000. It was fine. But certainly room for an error if it’s a 2- or 3-percentage-point race.
natesilver: Or 1980, when Ronald Reagan was only narrowly ahead in the polls and won by a landslide.
clare.malone: I think people would expect polls to get better over time, though. But are you saying that since the nature of polling is more unsure these days, there is greater room for error? I.e., the whole “no one picks up a landline anymore” thing?
natesilver: Our model looks at polls from 1972 to 2012. And in general, the polls were better in the second half of that period than the first. But with response rates declining — and some of the fairly significant polling errors in other parts of the world — I’m not sure that’s going to continue.
clare.malone: Gotcha.
micah: But the polls do get more accurate as Election Day approaches, right? It’s just that even at the end, there’s still an error margin?
natesilver: They get more accurate, sure, but even on Election Day, there’s still an empirical margin of error that exceeds the theoretical one. And empirically, that error is higher when there are a lot of third-party and undecided voters.
micah: A few more things …
There are still a lot of undecided voters. I’ve heard some people say that undecideds tend to break toward the challenger. Technically, there’s no incumbent running, but Trump does seem like the challenger. Couldn’t that help Trump?
natesilver: The undecided rule is basically bullshit.
clare.malone: Nate is spitting fire today on all these scenarios!
harry: Forget that article. Just look at the last election. Obama was under 50 percent and then zoomed past it on Election Day.
natesilver: It doesn’t check out, empirically. I’d also note that it’s not like Trump is sitting there with a big batch of people who just need a little extra push to vote for him.
His favorable rating is only about 33 percent, on average. And about 37 percent of people are voting for him right now. Many of the remaining 63 percent have strongly negative views about Trump.
micah: How about this: A whole bunch of working-class white voters, who either rarely voted in the past or voted Democratic, will vote for Trump on Election Day.
Didn’t you talk to people like that on the trail, Clare?
clare.malone: I think the Trump people think they are going to get a whole bunch of working-class white Democrats to come out of the woodwork and vote for them, even if those people haven’t voted in a while. Homing in on those people, as I’ve written about, is something they’re really trying to strive for, likely in places like Ohio, Pennsylvania and Florida. But we’ve also seen that people in some of these traditional manufacturing areas don’t actually lean more toward Trump — I believe that was a finding of that big Trump Gallup survey as well.
harry: Yeah, there are things called polls. These polls talk to people.
natesilver: Micah, you’re making all the bad arguments for the Trump comeback.
micah: Are there good arguments I’m missing?
natesilver: The good argument is just that it’s only August, the polls have been volatile, Clinton’s numbers might still be a little inflated from her convention, and sometimes the polls aren’t as accurate anyway as they were from 2004 to 2012.
micah: Well, we covered all that.
natesilver: Right. But I think when you try to get into specific scenarios by which Trump might come back, they tend not to be very convincing.
So I’m arguing more for existential humility instead, I suppose. It’s entirely possible that Trump has no chance whatsoever. But we don’t know enough to know that in advance.
micah: Final thoughts?
harry: The bottom line is a candidate can close a margin of 7 to 8 percentage points in the polls from this point until the election. Usually, candidates don’t. Trump could, but then again, Trump is Trump and probably won’t.
natesilver: The tricky thing for Trump is that you can’t make those 7 or 8 points up in a day. Or a week. Or maybe not even a month. You can chip away at them a little bit and then hope to get lucky in the debates or because the polls were a little bit off to begin with.
But if Trump starts trying to throw Hail Marys in August, it could just make matters worse. And if the campaign thinks the polls are skewed and makes that Ailes-ish, Hannity-ish mistake of confusing the views of a vocal minority for those of the majority, they’re probably screwed.

August 16, 2016
Election Update: Clinton’s Lead Is Clear And Steady
Here are the eight most recently conducted national polls, according to our database:
DATEPOLLSTERCLINTON’S MARGINAug. 9-15USC Dornsife/LA Times+3.4Aug. 11-14Morning Consult+6.0Aug. 8-14SurveyMonkey+6.0Aug. 7-13UPI/CVOTER+3.5Aug. 7-11Ipsos+5.2Aug. 9-10Rasmussen Reports+3.0Aug. 9Gravis Marketing+5.0Aug. 6-9YouGov+6.0Average+4.8Most recent national pollsNote: As of 10 a.m. on Aug. 16.
These surveys have a few things in common. Other than Gravis Marketing, which doesn’t poll the race on a set schedule, they’re all daily or weekly tracking polls. Also, they were all conducted online, via automated calls (“robopolls”) or through some combination thereof; there are no traditional telephone polls in the bunch.
And they seem to tell a consistent story about where the race stands. All of them have Clinton up by about 5 percentage points, give or take a percentage point or two.1
That’s not bad for Clinton, but it might seem to suggest that her lead over Trump has abated. A week or so ago, we were seeing leads for Clinton in the mid- to high single digits, with occasional forays into the double digits. Overall, she seemed to be ahead by 7 to 8 percentage points.
So what’s changed? Is Clinton’s convention bounce finally wearing off? Actually, pretty much nothing has changed, according to these polls. Because while we were seeing our fair share of 8- and 10-point leads for Clinton, we generally weren’t seeing them from this group of pollsters, which are (with a couple of exceptions) a Trump-leaning bunch.
Instead, these polls have been steady, at least on average. The table below compares each poll’s most recent result to its previous edition,2 as well as to each poll’s long-term average (that is, to the average of every previous edition of the survey going back to November 2015). On average, the most recent edition of these surveys shows Clinton up by 4.8 percentage points. But the previous editions showed her up by an average of 4.5 percentage points, so there’s been essentially no change.
CLINTON’S MARGINDATEPOLLSTERCURRENTPREVIOUSLONG-TERM AVERAGEAug. 9-15USC Dornsife/LA Times+3.4+1.7-2.1Aug. 11-14Morning Consult+6.0+8.0+4.1Aug. 8-14SurveyMonkey+6.0+6.0+4.2Aug. 7-13UPI/CVOTER+3.5+7.3+1.0Aug. 7-11Ipsos+5.2+5.7+8.2Aug. 9-10Rasmussen Reports+3.0+4.0+0.2Aug. 9Gravis Marketing+5.0-2.0+1.0Aug. 6-9YouGov+6.0+5.0+3.2Average+4.8+4.5+2.5Recent national polls show a steady race, on averageIf you exclude Gravis Marketing, which hadn’t previously polled the race since the Democratic convention, Clinton’s lead has gone from 5.4 percentage points to 4.7 percentage points, also not a meaningful shift.
Comparing each poll’s most recent result to its long-term average is also instructive. Clinton’s current lead of 4.8 percentage points in these polls is more impressive given that they’ve had her ahead by only 2.4 percentage points on average over the course of the year. By comparison, Clinton’s average lead across all national polls dating back to Nov. 2015 has been about 5 percentage points. In other words, these polls have been a Trump-leaning group — they’ve had a pro-Trump house effect of 2 to 3 percentage points. So their showing of Clinton with a lead of about 5 percentage points is consistent with her being ahead by 7 to 8 points overall.
I’m going through this somewhat tedious explanation because it’s basically how FiveThirtyEight’s forecast models calculate their trend line adjustment, which works by comparing polls against previous editions of the same surveys. The idea here is simple. If Trump is gaining ground on Clinton overall, we ought to see him gaining ground in individual polls (including state polls, which are also used to calculate the trend line adjustment). But he isn’t gaining on Clinton, mostly. In polls that had previously surveyed the race since the conventions, Trump is up a point or so in some polls and down a point or so in others — the overall trend is about flat. And in polls that are taking a post-convention snapshot for the first time, Clinton is generally polling better than she did before the conventions. Thus, our polls-only model continues to show Clinton ahead by around 8 percentage points. And it gives her an 89 percent chance of winning, close to where she’s been over the past week.
Still, I’m not quite ready to declare that Clinton’s lead is completely convention bounce free and that we’ve reached a new equilibrium in the race. That’s because I’d like to see another round of high-quality, traditional telephone polls — for instance, the NBC News/Wall Street Journal poll or the ABC News/Washington Post poll. Those polls generally showed excellent results for Clinton just after the conventions, with a larger bounce than some of the tracking polls had. But none of them have surveyed the race twice since the conventions, to give us a sense for whether Clinton’s bounce is holding. This more conservative attitude is closer to the one our polls-plus model takes, which still assumes the race is more likely than not to tighten. It shows mildly brighter prospects for Trump, giving him a 22 percent chance of winning.

August 15, 2016
Can Clinton Attract Republicans And Still Keep Progressives?
In the weeks since the conventions, numerous Republican politicians and officials have voiced their support for Hillary Clinton. Recent polls suggest some Republican voters are following suit.
In this week’s podcast, FiveThirtyEight’s Farai Chideya takes the host chair to talk with the normal crew about what kind of Republicans are likely to support Clinton, whether she’ll shift positions in the effort to woo them, and if that could turn off already reluctant progressives.
The team also looks at the effects of Trump’s suggestion that the election could be rigged and digs into the most comprehensive poll yet on what attracts voters to Trump.
You can stream or download the full episode above. You can also find us by searching “fivethirtyeight” in your favorite podcast app, or subscribe using the RSS feed. Check out all our other shows.
If you’re a fan of the elections podcast, leave us a rating and review on iTunes, which helps other people discover the show. Have a comment, want to suggest something for “good polling vs. bad polling” or want to ask a question? Get in touch by email, on Twitter or in the comments.

Election Update: 10 Big Questions About The Election, Revisited
Want these election updates emailed to you right when they’re published? Sign up here.
There weren’t a lot of polls published over the weekend, but the ones we saw didn’t have a lot of good news for Donald Trump. Instead, Hillary Clinton maintains a national lead of about 8 percentage points, and Trump’s chances of winning the election are down to 11 percent in our polls-only model — his low point of the year — and 21 percent according to polls-plus.
Instead of focusing on the details, let’s zoom out and ask a few big-picture questions about where the election stands. When we asked these questions a month ago, before the party conventions, Clinton held a lead of 3 to 4 percentage points over Trump, but Trump seemed to have momentum. Now, the landscape is very different:
Who’s ahead in the polls right now?Clinton, by a lot. National polls that include third-party candidates have Clinton with an average of 44 to 45 percent of the vote, Trump at 36 to 37 percent, and Libertarian Gary Johnson at roughly 9 percent. State polls tell a broadly similar story. Trump’s low percentage of the vote is noteworthy: Every major-party nominee since 1928 has received at least 36.5 percent of the vote. (Democrat John W. Davis got just 28.8 percent in 1924.)
What’s the degree of uncertainty?Moderate-to-high, although decreasing. The polls are often highly volatile around the party conventions, but they come out of the conventions considerably more accurate than they were beforehand. The question is whether we’re far enough away from the conventions — which concluded on July 28 — that we can no longer attribute Clinton’s lead to some sort of “convention bounce.” There isn’t a hard-and-fast answer to this question, but for what it’s worth, the convention-bounce adjustment applied by our polls-plus model will begin wearing off this week. More importantly, we’re approaching the point where a Trump comeback would be relatively lacking in precedent.
But still, the number of undecided and third-party voters in the polls remains high, which has historically been an indicator of higher volatility. And the conventions concluded relatively early this year, so the comparison to post-convention polling from past years is somewhat imprecise.
What’s the short-term trend in the polls?There’s room to ask whether Clinton’s lead over Trump has peaked and begun to decline slightly, or whether it’s continuing to grow. The evidence is mixed: You can find polls like this one and this one, where Clinton is at or near her all-time high, but you can also find others like this one and this one, where she’s still doing well but is a bit down from her peak. Overall, our models see Clinton’s position as fairly steady, although it’s possible that Trump is continuing to lose ground to third-party candidates and to the undecided column.
What’s the medium-term trend in the polls?Clinton has unambiguously gained ground since the conventions, holding a lead of about 8 percentage points now as compared with 3 to 4 points just before the conventions began. There is, however, still some question about where the equilibrium in the race stands. Clinton held a mid-to-high single-digit lead over Trump for most of March, April and June — and now she has one again in August. But the election was apparently closer for much of May and July.
Which states shape up as most important?The swing states have sorted themselves into order. According to our polls-only model, Clinton has a lead of at least 9 percentage points in states collectively worth 273 electoral votes, including New Hampshire, Pennsylvania, Virginia, Colorado, Michigan and Wisconsin. Ohio, Florida, Iowa, Nevada and North Carolina are closer, by contrast.
This leads to a situation where no one state is overwhelmingly more important than any other. But still, Florida, Pennsylvania and Ohio hold the top spots according to our tipping-point index. A loss in Florida or Ohio would make Trump’s situation almost impossible. Clinton has a few winning maps without Pennsylvania, Florida and Ohio, but they’d require her to win at least one state that Barack Obama lost in 2012, most likely North Carolina.
Does one candidate appear to have an overall edge in the Electoral College, relative to his or her position in the popular vote?This is an academic question until and unless the race tightens substantially. And for the time being, an Electoral College landslide against Trump is at least as likely a prospect as the election coming down to the wire. But if the race does close, Trump is more likely to win the Electoral College while losing the popular vote than the other way around, according to our models. Still, this is a relatively narrow advantage and it has been diminishing as Clinton’s polling strengthens in states such as Pennsylvania.
How do the “fundamentals” look?In the absence of polls, we might look toward factors such as economic conditions to predict the election. They imply that the race ought to be competitive. A stronger economy generally helps the incumbent party’s candidate — in this case, Clinton. But the economic data has been mixed, with relatively strong job growth, a healthy stock market and low inflation on the one hand, but tepid income and GDP growth on the other hand. Still, you should be wary of economic determinism. “Fundamentals”-based models that don’t look at polls have a fairly bad track record, even in years that aren’t as crazy as this one.
How do FiveThirtyEight’s forecasts compare against prediction markets?Betting markets put Trump’s chances at around 20 percent, which is similar to our polls-plus forecast but more optimistic for Trump than polls-only. I’ll take a pass for now on the question of whether these markets are too optimistic or too pessimistic about Trump’s chances.
What would keep me up late at night if I were Clinton?At some point, complacency could become an issue, although it’s probably too early to worry about that. In the nearer term, I’d be worried that the race has been so volatile. Sure, things look good now. But conditions in May, and then again in July, produced a close race. Is there anything inherently preventing those conditions from arising again? I suppose I’d wonder about what Wikileaks has up its sleeve and what sort of geopolitical events could work in Trump’s favor.
What would keep me up late at night if I were Trump?I might not be sleeping at all. The tactics that helped me to win the primary don’t seem to be working in the general election. My position in the polls is deteriorating from middling to dire. Most acutely, I’d worry about getting cut off by the Republican National Committee or thrown under the bus by down-ballot Republican candidates who are rightly concerned about their own survival. If those things happen, I might not have the resources to win the election even if the debates and the news cycle turn in my favor in September and October.

August 12, 2016
What A Clinton Landslide Would Look Like
Want our latest forecasts/election analysis emailed to you right when they’re published? Sign up here.
We’re going to spend a lot of time over the next 87 days contemplating the possibility of a Donald Trump presidency. Trump is a significant underdog — he has a 13 percent chance of winning the election according to our polls-only model and a 23 percent chance according to polls-plus. But those probabilities aren’t that small. For comparison, you have a 17 percent chance of losing a “game” of Russian roulette.
But there’s another possibility staring us right in the face: A potential Hillary Clinton landslide. Our polls-only model projects Clinton to win the election by 7.7 percentage points, about the same margin by which Barack Obama beat John McCain in 2008. And it assigns a 35 percent chance to Clinton winning by double digits.
Our other model, polls-plus, is much more conservative about Clinton’s prospects. If this were an ordinary election, the smart money would be on the race tightening down the stretch run, and coming more into line with economic “fundamentals” that suggest the election ought to be close. Since this is how the polls-plus model “thinks,” it projects Clinton to win by around 4 points, about the margin by which Obama beat Mitt Romney in 2012 — a solid victory but a long way from a landslide.
But the theory behind “fundamentals” models is that economic conditions prevail because most other factors are fought to a draw. In a normal presidential election, both candidates raise essentially unlimited money and staff their campaigns with hundreds of experienced professionals. In a normal presidential election, both candidates are good representatives of their party’s traditional values and therefore unite almost all their party’s voters behind them. In a normal presidential election, both candidates have years of experience running for office and deftly pivot away from controversies to exploit their opponents’ weaknesses. In a normal presidential election, both candidates target a broad enough range of demographic groups to have a viable chance of reaching 51 percent of the vote. This may not be a normal presidential election because while most of those things are true for Clinton, it’s not clear that any of them apply to Trump.
A related theory is that contemporary presidential elections are bound to be relatively close because both parties have high floors on their support. Indeed, we’ve gone seven straight elections without a double-digit popular vote victory (the last one was Ronald Reagan’s in 1984), the longest such streak since 1876-1900.

As with other theories of this kind, however, there’s the risk of mistaking what’s happened in the recent past for some sort of iron law of politics. Historically, the U.S. has ebbed and flowed between periods of close presidential elections — such in the late 19th century or early 21st century — and eras in which there were plenty of lopsided ones (every election in the 1920s and 1930s was a blowout).
These patterns seem to have some relationship with partisanship, with highly partisan epochs tending to produce close elections by guaranteeing each party its fair share of support. Trump’s nomination, however, reflects profound disarray within the Republican Party. Furthermore, about 30 percent of Republican or Republican-leaning voters have an unfavorable view of Trump. How many of them will vote for Clinton is hard to say, but parties facing this much internal strife, such as Republicans in 1964 or Democrats in 1972 or 1980, have often suffered landslide losses.
Perhaps the strongest evidence for a potential landslide against Trump is in the state-by-state polling, which has shown him underperforming in any number of traditionally Republican states. It’s not just Georgia and Arizona, where polls have shown a fairly close race all year. At various points, polls have shown Clinton drawing within a few percentage points of Trump — and occasionally even leading him — in states such as Utah, South Carolina, Texas, Alaska, Kansas and even Mississippi.
Just how bad could it get? Let’s start by giving Clinton the 332 electoral votes that Obama won in 2012. That’s obviously not a safe assumption: The race could shift back toward Trump, and even if it doesn’t, Clinton could lose states such as Iowa or Nevada, where her polling has been middling even after her convention bounce. But as I said, we’re going to focus on Clinton’s upside case today.
So I’m going to list the states Romney won in order of how easy it is for Clinton to flip them, according to our polls-only model.1 The number in parentheses by each state represents the point at which the model estimates it would flip to Clinton, based on her lead in the national popular vote. For instance, South Carolina (+9.5) means that Clinton would be favored in South Carolina if she leads by at least 9.5 percentage points nationally, but not by less than that. These projections are based on where the model has each state projected currently, along with each state’s elasticity score, a measure of how responsive it is to changes in the national environment. Here goes:
North Carolina (+3.2): It wouldn’t be any surprise if Clinton carried North Carolina, which Obama narrowly won in 2008. But Obama lost North Carolina in 2012 despite winning by about 4 percentage points nationally. This year, it looks like Clinton would win North Carolina with a 3 percentage point national victory. In other words, North Carolina has drifted slightly bluer relative to the rest of the country and is closer to being a true tipping-point state this year.
Arizona (+7.1): Arizona and Georgia have been flickering between light blue and light red in our polls-only projection recently. That’s because the model figures each state would be a tossup with Clinton ahead by about 7 points nationally, and that’s where the forecast has been for the past few days. Arizona is the fourth-most-Hispanic state after New Mexico, Texas and California, although historically its Hispanic population has voted at relatively low rates. A strong Hispanic turnout, perhaps coupled with gains for Clinton among Mormon voters (about 6 percent of Arizona’s electorate), might swing the state to her.
Nebraska’s 2nd Congressional District (+7.1): Nebraska and Maine award one electoral vote to the winner of each congressional district. That came in handy for Obama in 2008, when he won Nebraska’s 2nd Congressional district, which consists of Omaha and most of its suburbs. District boundaries were redrawn after the 2010 Census to make them slightly tougher for Democrats, but Omaha’s highly-educated demographics — we estimate that 47 percent of voters in the district have a college degree, comparable to Virginia or Connecticut — could wind up being favorable to Clinton. There’s been no polling in the district yet, so its position on this list is based on the model’s guesses based on its demographics and voting history.
Georgia (+7.2): In some ways, Georgia might be more promising than Arizona for Democrats’ long-term future. It has more electoral votes — 16 to Arizona’s 11 — and could serve as part of a bloc of states (along with Virginia and North Carolina) that could eventually offset losses for Democrats in the Rust Belt. It’s easy enough to see how Georgia’s demographics are favorable for Clinton: It has a substantial black population, but also an increasingly well-educated white population, with lots of migration from the Midwest and the Northeast.
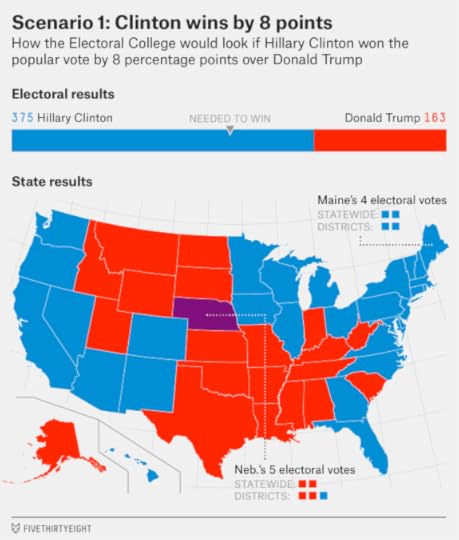
Let’s pause here to see what the map would look like if Clinton wins by 8 percentage points nationally — close to where her lead in the polls has been over the past week or so. This map you see below is worth 375 electoral votes, close to the 365 electoral votes Obama won in 2008 when he beat McCain by 7.3 percentage points. In fact, the map is identical to 2008 but for three changes: Georgia and Arizona turn blue, while Indiana (which surprisingly went for Obama in 2008) remains red:
But let’s say Clinton continues to build her lead, instead of Trump rebounding. Which dominoes might fall next?
South Carolina (+9.5): Public Policy Polling caused a big stir on Thursday when it published a poll showing Clinton down just 2 percentage points in South Carolina — but the result shouldn’t have been all that shocking. South Carolina was only a couple of points redder than Georgia in 2012 and 2008, so if Georgia has moved to being a tie, you’d expect South Carolina to follow just a half-step behind it. True, South Carolina doesn’t have a metropolis like Atlanta, but a relatively high percentage of white voters there have college degrees.
Missouri (+10.3): It’s surprising to see Missouri, once considered a bellwether state, so far down this list. Bill Clinton won it twice, and Obama came within 4,000 votes of winning it in 2008. But now we estimate that Hillary Clinton would need to win by about 10 points nationally to claim the state. Note, however, that the recent polling in Missouri has been mixed, with polls showing everything from a 10-point lead for Trump to a slight edge for Clinton.
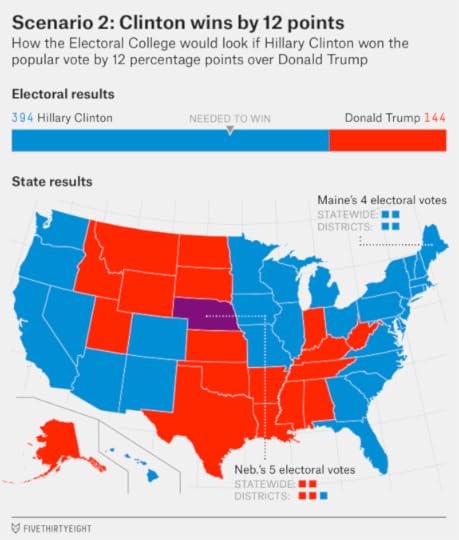
There’s something of a gap after South Carolina and Missouri before the next set of states. Thus, Trump might be able to hold Clinton below 400 electoral votes even if she won by 12 points nationally:
But after that, the floodgates would really open, with lots of traditionally red states in all parts of the country potentially turning toward Clinton:
Mississippi (+12.3): I’m skeptical about this one, since Mississippi presents something of a modelling challenge. You can see why it’s an attractive target for Democrats, in theory: It has the highest share of black voters in the country (after the District of Columbia). But in 2008, only 11 percent of Mississippi’s white population voted for Obama. Clinton trailed Trump by just 3 percentage points in the only poll of Mississippi, taken in March. In that poll, Clinton got 20 percent of the white vote. If she can replicate that on Election Day, the outcome could be close.
Indiana (+13.2): Obama’s win in Indiana in 2008 — one of just two times Democrats have won the state since 1940 — might be hard to duplicate. He benefited that year from investing in the ground game in a state that is usually ignored, and from Indiana’s connections with Chicago. Plus, Indiana Gov. Mike Pence is Trump’s running mate. Still, if Clinton stretches her national lead into the teens, Indiana could be competitive.
Texas (+13.8): Democrats have long talked about turning Texas blue — or at least purple — but the truth is they haven’t come anywhere close. Obama lost Texas by 12 points in 2008 despite his near-landslide margin nationally, for instance. But Clinton has a number of factors that could work in her favor. We estimate that about somewhere between 37 and 40 percent of Texas’s electorate will be Hispanic, black, Asian-American or Native American, depending on turnout. A high proportion of its white population has college degrees. And Trump has run afoul of locally popular politicians, such as Ted Cruz and George W. Bush. Previous polls of Texas had shown Trump with only a mid-single digit lead there, although a more recent survey had him up by 11.
Montana (+14.1): Obama also nearly won Montana in 2008, losing by just 2 percentage points. But Montana is historically an anti-establishment state, and Trump led Clinton in the only poll we can find — which, granted, was way back in November 2015 — by 21 percentage points. A winning scenario for Clinton would probably involve Libertarian Gary Johnson getting a substantial portion of the vote: Montana was Johnson’s second-best state, after New Mexico, in 2012.
Utah (+14.2): People are fascinated by Clinton’s prospects of winning in Utah, which went for Romney by 48 points in 2012. But it’s hard to say just how realistic those are. The polls-only model has Clinton just a couple of percentage points behind in the polling average in Utah, but its demographic model projects her to lose it by 16 points — a lot better than 2012, but not particularly close. As with Mississippi, therefore, the odds you assign to Clinton in Utah are highly sensitive to your choice of assumptions. She’s taking her chances seriously enough to make some efforts to campaign there, but is it a wild goose chase — like when Dick Cheney visited Hawaii in 2004 — or part of long-term plan to swing Mormons into the Democratic Party?
South Dakota (+14.9): Less excitingly, Clinton could win South Dakota in the event of a national rout, as the state seems to have become the slightly bluer of the two Dakotas after North Dakota’s oil boom. Perhaps South Dakota has a soft spot for Clinton, having voted for her in the Democratic primary in both 2008 and 2016, when Obama and Bernie Sanders won almost all the surrounding states.
Kansas (+15.6): Polls have had Kansas surprisingly close — with one survey in June even having Clinton ahead. One can squint and make an argument for it: Kansas is relatively well-educated, and Republican Gov. Sam Brownback is extremely unpopular. But note that Kansas polls badly overstated Republicans’ problems in 2014, when both Brownback and Sen. Pat Roberts won re-election.
Alaska (+15.7): I doubt that Alaskans have much affection for Clinton, but the state is idiosyncratic enough that I don’t really know what they think of Trump, who lost to Cruz in the state’s Republican caucuses. As in Montana, a Clinton win would probably depend on Johnson sucking up a lot of Trump’s vote. Clinton trailed by just 5 percentage points in the only poll of Alaska in January, which didn’t include Johnson as an option.
Nebraska’s 1st Congressional District (+15.8): As goes Omaha, so goes Lincoln? Here’s what the map might look like if Clinton won by 16 percentage points nationally, along with all the states we’ve mentioned so far:
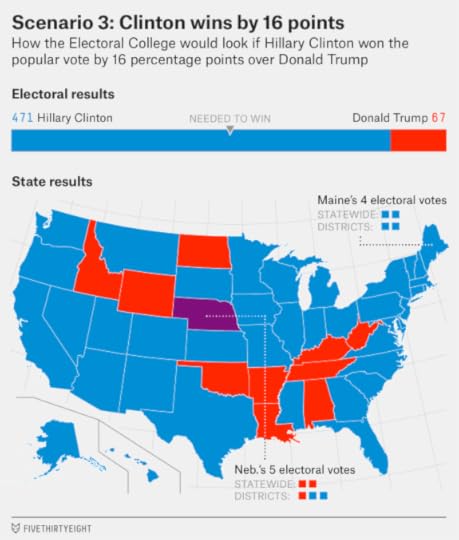
That would work out to 471 electoral votes, to 67 for Trump, which would be fairly typical for a win of that magnitude. Dwight D. Eisenhower won 457 electoral votes when beating Adlai Stevenson by 15 points in 1956, for example. And Franklin D. Roosevelt won 472 electoral votes in 1932, in an 18-point win against Herbert Hoover. Clinton would be a ways short of Ronald Reagan’s 525 electoral votes in 1984, however.
All right, let’s stop there. I’m trying to encourage you to keep an open mind. The way the polls-only model thinks about things, Clinton is ahead by 7 or 8 percentage points now, and the error in the forecast is symmetrical, meaning that she’s as likely to win by 14 or 16 points as she is to lose the popular vote to Trump. There have even been a couple of national polls that showed Clinton with a lead in the mid-teens. But my powers of imagination are limited. Other than losing North Dakota to go along with South Dakota, or perhaps the statewide electoral votes in Nebraska to go along with the congressional district ones, it’s hard for me to envision Trump doing any worse than this — unless he really does shoot someone on 5th Avenue.

August 10, 2016
Election Update: When One Poll Makes A Big Difference
Hillary Clinton’s chances of winning the presidential election declined by nearly 3 percentage points, to 85 percent, in FiveThirtyEight’s polls-only forecast on Wednesday. Similarly, they declined by 4 percentage points, to 75 percent, in our polls-plus forecast.
The Clinton camp doesn’t really have a lot to complain about: Her position in the polls (and in our forecasts) is much improved since the Democratic convention in late July. And she’s had strong polls this week in swing states such as Pennsylvania and Wisconsin. A Marquette University poll published on Wednesday gave her a 13-percentage-point lead over Donald Trump in Wisconsin. So why were her numbers down in our model, on a day where there wasn’t all that much polling?
It’s pretty much because of a single national poll conducted by Selzer & Company, on behalf of Bloomberg Politics, which gave Clinton a 4-point lead among likely voters. On the surface, that doesn’t seem all that bad for Clinton. Recent national polls have had Clinton ahead by around 7 or 8 percentage points. And we’ve had lots of national polls, so the average is pretty well established. One additional survey showing a result just a couple of points worse than the average shouldn’t be that big a deal, right?
So let me explain why this poll moved the needle, as far as FiveThirtyEight’s models are concerned. The short version: The trend line in the poll was awful for Clinton, since Selzer’s previous national polls had shown Clinton with leads of 12 percentage points in June and 18 (!) percentage points in March. For a more technical explanation, read on.
One of the most important features of our model is our trend-line adjustment. Basically, the model looks at trends within individual polls — for instance, that Clinton gained 3 percentage points in Quinnipiac’s latest poll of Ohio compared to its previous survey — in order to infer the overall trajectory of the race. This adjustment is then applied to the forecast in each state. Why wasn’t the model affected very much by recent polls showing Clinton up by 9 points in Pennsylvania, or by 13 points in Wisconsin? Because the model already figured she was doing well in these states, based on her improvement in national polls, and in polls of other states.
But, of course, the trend-line adjustment sometimes does get surprised. The most surprised it can get is by a very recent, high-quality poll that cuts against the prevailing direction of other surveys. The Selzer poll was one of those cases.
By “high quality,” I mostly mean a poll with a high pollster rating — which are based on a pollster’s past accuracy and methodology — since the trend line adjustment puts more weight on better-rated polls. Selzer & Company (which also conducts the prestigious Des Moines Register Poll) more than qualifies: It’s one of just six polling firms with an A-plus rating from FiveThirtyEight.
There’s another, more subtle dimension to this also, which is that Selzer hasn’t polled the general election very often this year. (Just the three national polls so far.) The trend-line adjustment is therefore designed to give a lot of weight to a Selzer poll whenever it weighs in. By contrast, it gives less weight to any given poll from a pollster that surveys the race frequently, such as by conducting a national tracking poll.1
The Selzer poll also cut against the prevailing direction of other surveys. Almost every poll over the past 10 days has shown Clinton gaining ground on Trump, or at least holding steady. This one showed a big decline for her — down from a 12-point lead in June to a 4-point lead now.2
You might raise a reasonable objection here: The 12-point lead that Selzer had for Clinton before — and certainly the 18-point lead it had for her in March — were outliers to begin with. Thus, Clinton’s decline was partly a matter of the poll reverting to the mean, instead of a true shift in the race.
This is probably true to some extent (and it’s one reason that Democrats shouldn’t worry about the poll all that much). But remember that this tends to cut in both directions. On Tuesday, for instance, Clinton benefited in the trend-line adjustment from the Quinnipiac poll that showed her going from 6 points back in Pennsylvania to 9 points ahead. Although Quinnipiac has generally had mediocre numbers for Clinton, that 6-point deficit in Pennsylvania had been especially out of line with other surveys. Thus, part of her gains in that poll were probably reversion to the mean also.
Over time, these instances tend to cancel out, and the model tends to be self-correcting. We’ll watch carefully over the next several days to see whether the latest Selzer poll is the start of a shift back to Trump, or an oddball case that the model soon works out of its system.

Which Countries Medal In The Sports That People Care About?
We’re on the ground in Rio covering the 2016 Summer Olympics. Check out all our coverage here.
Because the Summer Olympics occur during presidential election years, I have to pick my viewing opportunities carefully. I won’t always have the time or patience to watch much water polo or beach volleyball, sports that involve a lot of buildup — dozens of preliminary matches — all leading up to a gold-medal match that I’ll probably forget to watch anyway.3 Instead, I’m mostly interested in sports such as swimming and track and field, which provide plenty of bang for the buck, with somebody (probably an American) winning a medal pretty much every other time you look.
Not everyone agrees with this philosophy, though. Track and field and swimming are indeed very popular, ranking as the top two sports for Olympics TV viewership, followed by gymnastics in third. But soccer ranks fourth. It awards just two gold medals, one each for the men’s and women’s champions, while sailing awards 10. And yet — even if people don’t care as much about Olympic soccer as they do the World Cup or the Champions League — soccer has 15 times the Olympics TV audience that sailing does.
So, what if Olympics medals were awarded in proportion to how much people actually cared about each sport, as measured by its TV viewership? To reiterate, I’m talking about TV viewership during the Olympics, specifically. Tennis (as in: Wimbledon) is presumably the more popular spectator sport under ordinary circumstances, but in 2012, people actually spent more time watching table tennis (as in: pingpong) than tennis at the Olympics.
The data I’m citing here comes from the IOC’s International Federations Report, which listed the total number of TV viewer hours in each sport during the 2012 London Olympics. People around the world spent a collective 202 million hours watching Olympics fencing in 2012, for example. The list of the most popular sports is less U.S.-centric than you might think: Badminton, not very popular in the United States, gets a lot of TV viewers worldwide.
There are just a couple of complications. First, some Olympic federations cover more than one sport, as people usually define them. FINA, for example, governs swimming, diving, water polo and synchronized swimming4, and the IOC’s report aggregated their TV viewership together. I used data on London Olympics ticket revenues as a proxy for the relative popularity of these sports, in order to split the TV audiences accordingly.5 Second, golf and rugby are new to the Olympics this year, so I estimated their TV viewership using regression analysis.6
Otherwise, the analysis is pretty straightforward. I calculated a medal multiplier for each sport, such that the value of medals is proportional to the amount of time people spent watching it. Gymnastics, for instance, represented about 4.5 percent of the medals awarded in 2012, but around 9 percent of the TV viewership. It therefore needs a medal multiplier of 2 to bring things into proportion.7
SPORTVIEWER HOURS (MILLIONS)EVENTSMEDAL MULTIPLIERTrack and field2,300471.0Swimming1,509340.9Gymnastics1,442142.0Soccer1,300212.9Basketball80428.0Diving78481.9Beach volleyball78127.7Cycling564180.6Badminton56252.2Volleyball51925.1Table tennis46142.3Judo**443140.6Tennis37151.5Weightlifting320150.4Wrestling**318180.3Boxing**302130.5Handball26522.6Field hockey23322.3Shooting215150.3Fencing2... polo19421.9Equestrian18160.6Archery16240.8Rugby*14121.4Synchronized swimming11321.1Triathlon10021.0Golf*9420.9Rhythmic gymnastics9220.9Taekwondo**8880.2Sailing87100.2Trampoline6720.7Modern pentathlon3220.3What if medals were awarded in proportion to a sport’s popularity?* Golf and rugby are new Olympic sports for 2016. Viewership is estimated based on regression analysis.
** Boxing, judo, taekwondo and wrestling award two bronze medals in each event. As a result, they have a lower medal multiplier for bronze
medals: 0.3 for boxing and judo, 0.2 for wrestling and 0.1 for taekwondo.
Source: Olympic.org
Team sports almost invariably wind up with large medal multipliers, including soccer (12.9), basketball (8.0) and even water polo (1.9). Swimming (0.9) and track and field (1.0) hold their own; they’re very popular, but also medal-rich, so there isn’t much need to adjust their numbers one way or the other. Gymnastics gets a boost, though, as does diving (1.9). But many of the more obscure individual sports, such as shooting (0.4), sailing (0.2) and taekwondo (0.2), have low multipliers.
How would these adjustments have affected the 2012 Olympic standings? Among other things, they’d have helped the United States, which already led the way with 46 gold and 103 overall medals in London. A lot of those medals came in team sports, such as basketball, volleyball and (women’s) soccer, which have high medal multipliers. Thus, Team USA’s adjusted medal count is 78 golds and 142 medals overall, towering over the competition.
Related:Nate Silver's Blog

- Nate Silver's profile
- 730 followers

