
A User’s Guide To FiveThirtyEight’s 2016 General Election Forecast
We’ve just launched FiveThirtyEight’s 2016 general election forecast, which projects how the 538 Electoral College votes could break down in the presidential election. The forecast will be continually updated through Election Day on Nov. 8. Here’s a bullet-point-style look at how it was built.
What’s new in the model since 2012?Not that much! It’s mostly the same model as the one we used to successfully forecast the 2008 and 2012 elections.There’s no special variable for Republican Donald Trump or Democrat Hillary Clinton. They’re treated the same as any other candidates would be with the same polling numbers.We built procedures to handle Libertarian Gary Johnson and other third-party candidates.We double-checked lots of assumptions and code.We’re now showing different versions of the model: the polls-only and polls-plus forecasts, and the now-cast (what would happen in an election held today).Major themes and findingsThink probabilistically. Our probabilities are based on the historical accuracy of election polls since 1972. When we say a candidate has a 30 percent chance of winning despite being down in the polls, we’re not just covering our butts. Those estimates reflect the historical uncertainty in polling.State polls > national polls. All versions of our models gain more information from state polls than from national polls.Errors are correlated. But while the election is contested at the state level, the error is correlated from state to state. If a candidate beats his polls to win Ohio, there’s a good chance he’ll also do so in Pennsylvania.Be conservative early and aggressive late. Fluctuations in the polls in the summer are often statistical noise or short-term bounces. The model is trained to be conservative in reacting to them. Fluctuations late in the race are more meaningful, and the model will be more aggressive.Three versions of the modelPolls-plus: Combines polls with an economic index. Since the economic index implies that this election should be a tossup, it assumes the race will tighten somewhat.Polls-only: A simpler, what-you-see-is-what-you-get version of the model. It assumes current polls reflect the best forecast for November, although with a lot of uncertainty.Now-cast: A projection of what would happen in a hypothetical election held today. Much more aggressive than the other models.Differences between polls-plus and polls-onlyPolls-plus combines polls with an economic index; polls-only does not.Polls-plus will include a convention bounce adjustment; polls-only will not.Polls-plus starts by assuming that likely voter polls are better for Republicans; polls-only makes no such assumption. Both models revise this assumption as more data becomes available.Polls-plus subtracts points from third-party candidates early in the race, while polls-only does not.Both models employ a regression that is based on demographics and past voting history. But polls-only weights the regression less and places less emphasis on past voting history.Polls-only accounts for more uncertainty than polls-plus.Polls-plus and polls-only will tend to converge as the election approaches.Differences between polls-only and now-castThe now-cast is basically the polls-only model, except that we lie to our computer and tell it the election is today.As a result, the now-cast is very aggressive. It’s much more confident than polls-plus or polls-only; it weights recent polls more heavily and is more aggressive in calculating a trend line.There could be some big differences around the conventions. The polls-only and polls-plus models discount polls taken just after the conventions, whereas the now-cast will work to quickly capture the convention bounce.Four major stepsAll versions of the model proceed through four major steps:
Step 1: Collect, weight and average polls.Step 2: Adjust polls.Step 3: Combine polls with demographic and (in the case of polls-plus) economic data.Step 4: Account for uncertainty and simulate the election thousands of times.Step 1: Collect pollsAlmost all state and national polls are included. If you don’t see a poll, it’s for one of these reasons:
The poll is very new, and we haven’t had a chance to add it yet.The poll was conducted directly on behalf of one of the presidential campaigns or an affiliated PAC or super PAC.The pollster is on FiveThirtyEight’s banned pollster list (pollsters we think may be faking data or engaging in other blatantly unethical conduct).The poll is listed under a different name. (Tip: FiveThirtyEight generally lists polls by the name of the polling company, not the media sponsor. So look for “Selzer & Co.,” not “Bloomberg Politics.”)Which poll version do we use?Sometimes, there are multiple versions of a poll. For example, results are listed among both likely voters and registered voters.
We prioritize polls as follows: likely voters > registered voters > all adults.If there are versions with and without Gary Johnson, we use the version with Johnson.All other ambiguous cases are considered ties. Sometimes, for instance, a pollster will publish results showing two likely voter models instead of one. Our program will average any such instances together.Calculating a weighted averageWe calculate a weighted average in each state, where poll weights are based on three factors:
FiveThirtyEight’s pollster ratings, which are based on a firm’s track record and methodological standards.Sample size. A larger sample helps, but there are diminishing returns.Recency, which is less important early in the campaign and becomes more important later on.When a firm polls a state multiple times, the most recent poll gets more weight, but the older polls aren’t discarded entirely. The trend line adjustment (see Step 2) also helps to put more emphasis on recent data.Step 2: Adjust pollsThere are five adjustments, listed here in the order in which the model applies them. (The trend line and house effects adjustments are generally the most important ones.)
Likely voter adjustmentConvention bounce adjustment (in only the polls-plus model)Omitted third-party candidate adjustmentTrend line adjustmentHouse effects adjustmentLikely voter adjustmentPolls of registered voters and adults are adjusted to be equivalent to likely voter polls.The adjustment begins with a default setting but changes as the model collects data on polls that list both registered and likely voter numbers.Historically, Republicans gain slightly in likely voter polls — a net of 1 to 2 percentage points — compared with registered voter or adult polls. Therefore, in the polls-plus model, the default is that likely voter polls slightly favor Republicans. The polls-only and now-cast models ignore this historical precedent and use a default of zero.But so far this year, Trump isn’t gaining ground on Clinton in likely voter polls. In several polls, Clinton has done slightly better in the likely voter version, in fact. Thus, this adjustment doesn’t have much effect right now.Likely voter polls tend to show fewer undecided voters.Convention bounce adjustmentHistorically, parties receive large but fleeting bounces in the polls after their party convention. For instance, Walter Mondale led Ronald Reagan 48-46 in one poll conducted just after the Democratic National Convention in 1984!The bounces have been smaller in recent years, but candidates can still come out “hot” after their conventions (e.g., McCain/Palin in 2008).The polls-plus model applies a convention bounce adjustment, subtracting points from a candidate’s polls just after his or her convention.Polls-only and now-cast do not apply an adjustment.As another line of defense, both polls-plus and polls-only weight polls less if they’re conducted in the immediate aftermath of the convention (but now-cast weights them fully).Polls-plus assumes that a modern-day convention bounce is worth 3 to 4 percentage points. But because the conventions occur back-to-back this year, the bounces could obscure each other.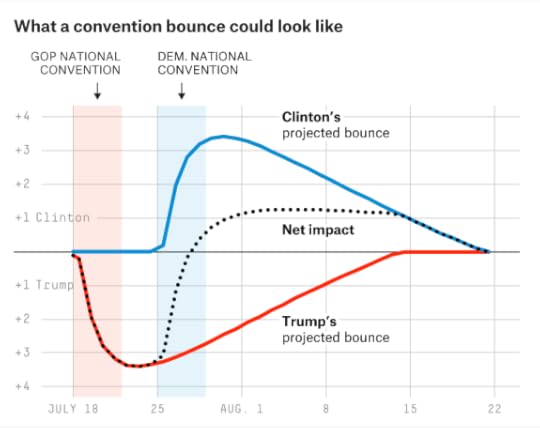 Omitted third-party adjustmentAlso known as the “missing Johnson adjustment.” Because our default is to use polls with Johnson, we adjust polls that don’t list him.The model estimates how much of Johnson’s support comes from the major-party candidates, instead of from undecided voters. (Answer: Relatively little support for Johnson is from undecided. Clinton and Trump both poll considerably lower in polls that include Johnson.)The adjustment assumes Johnson takes his support from Clinton and Trump equally.The adjustment differs in each state. It will take more points away from Clinton and Trump in states it perceives to be good for Johnson.Trend line adjustmentThe model detects movement in the polls by making comparisons between different editions of the same poll. For example, if Clinton is at 46 percent in the Quinnipiac poll of Florida in August and was at 43 percent in the same poll in July, that suggests she’s gained 3 percentage points. Likewise, if Trump’s at 41 percent in the Rasmussen national poll this week and he was at 40 percent last week, that suggests he’s gained 1 percentage point.The model runs this calculation for Clinton, Trump and Johnson separately. It’s possible for all candidates to gain (or lose) votes from undecided.By making an apples-to-apples comparison, this method removes a lot of noise.Next, the model takes these comparisons and draws a trend line from them using loess regression.Polls are adjusted based on this regression. For instance, if Trump led in a North Carolina poll by 1 percentage point in June, but the trend line shows him having gained 3 percentage points nationally since then, the model will treat the poll as showing him up by 4 percentage points. This calculation varies slightly from state to state based on a state’s elasticity score. More about this later.The question is how much smoothing to use in the trend line. Less smoothing = a more aggressive forecast.Empirically, using more smoothing early in the race and less smoothing late in the race works best. In other words, the trend line starts out being quite conservative and becomes more aggressive as Election Day approaches.House effects adjustmentHouse effects are persistent partisan “leans” in polls. For instance, Rasmussen Reports polls are typically Republican-leaning, relative to other polls.The model detects each polling firm’s house effect by comparing its polls to others of the same state.The model then subtracts a proportion of the house effect back out. The proportion depends on the number of polls each firm has conducted. For instance, say a pollster has a 3 percentage point Clinton-leaning house effect. The model might subtract only 1 point from Clinton if the firm has conducted only a few polls. But it might subtract 2.8 points if the firm has conducted dozens of polls, and the model had a very strong idea of its house effect.House effects are calculated separately for Clinton, Trump and Johnson. A pollster could have both a pro-Clinton and pro-Trump house effect if it tended to show few undecided voters, for instance.In calculating house effects, the model needs to determine what an average poll is, as a basis for adjusting the other polls. This average is weighted, based on each firm’s pollster rating. In other words, high-quality polls have more say in the house effects adjustment.Step 3: Combine polls with other dataThis is when we go from adjusting polls to actually forecasting what will happen in the Electoral College.We refine the forecasts by combining the polls with demographic and economic data.But there are a few technical steps first: Adjusting the third-party vote, allocating undecided voters and projecting the national popular vote.Adjusting the third-party voteHistorically, third-party candidates tend to underperform their early polls. Essentially, some third-party voters may really be undecided voters using the third-party candidate as a placeholder. (Note that third-party candidates do not necessarily underperform their late polls. This is more of a concern in the summer and early fall.)Therefore, early in the race, the polls-plus model will subtract some of the vote from the third-party candidate based on this pattern and reallocate it to undecided.The polls-only model and the now-cast do not do this. They leave the third-party vote as-is.Allocating undecided votersUndecided voters are split evenly between the major-party candidates. Empirically, an even split works better for presidential races than a proportional split.Late in the race, the third-party candidate will also get a share of undecideds.A small portion of the vote is also reserved for “other” candidates (e.g., Green Party candidate Jill Stein, etc.) in states where we expect four or more candidates to be on the ballot.Projecting the national popular voteIn all versions of the model, the national popular vote is held constant when combining polls with demographic data.For example, if Clinton is up by 5.1 percentage points nationally before the demographic regressions are applied, she’ll also be up 5.1 points after they’re applied.How do we project the national popular vote? There are two possible approaches: Top-down, using national polls, and bottom-up, estimating the national popular vote from state polls.The model uses a blend of both approaches but puts considerably more weight on the state polls strategy, which has been more accurate historically.In calculating the bottom-up estimate, the model controls for each state’s partisan voter index (PVI), a measure of how it voted in the past two presidential elections. Thus, it won’t be thrown off if we have lots of polling from blue states but little from red states, or vice versa.National polls versus state polls
To recap, the model mostly uses state polls. But national polls can influence the forecast in some subtle ways:
They’re helpful for calculating adjustments to the polls, especially the trend line adjustment and house effects adjustment.They’re used, in conjunction with the state polls, in estimating the national popular vote.Partisan voter index (PVI)We’ve been using the term “demographics” loosely. The most important factor in these regressions is not the demographics per se but instead the PVI — how a demographic group voted relative to the national average in the past two elections.Our PVI calculations are similar to those used by Cook Political Report, although we weight 2012 more heavily (75 percent) than 2008 (25 percent) instead of weighting them evenly.Our version of PVI also adjusts for home-state effects from the presidential and VP candidates. Historically, presidential candidates perform a net of 7 percentage points better in their home states. Because both Clinton and Trump are from New York, this effect cancels out this year! The VP candidate historically provides about a 2 percentage point boost to the ticket in his or her home state. We’ll add this to the model once the VPs are chosen.Calculating demographic regressionsInstead of using one regression model, we take three strategies, which range from more simple to complex, and blend them together. The reason for this is that the more complex methods (especially strategy 3) are subject to potential overfitting. Hedging the complicated methods with simpler methods produces a better result.
Strategy 1: Pure PVI. This works by taking the national popular vote estimate and adding a state’s PVI to it. For example, if Clinton’s up 4 percentage points nationally, and a state’s PVI is Democrat +5 percent, she’d be projected to win the state by 9 percentage points.Strategy 2: Regional regression. The adjusted polling average in each state is regressed on PVI and on dummy variables indicating which major region the state is in (Northeast, South, Midwest, West). Historically, this is the most effective approach. It can capture major changes in voting patterns from one election to the next, but doesn’t suffer from much overfitting. Regions are based on a combination of Census Bureau regions and political regions, as defined by FiveThirtyEight. Where they differ, a state is considered split between two regions. For example, Maryland is considered half Southern and half Northeastern by the model.Strategy 3: Demographic regression. We regress the adjusted polling average in each state on PVI and several other variables, mostly related to race and religion, that are pertinent in this year’s election. (This includes the percentages of voters who are black, Hispanic, Asian, non-Christian, evangelical Christian, Mormon and college graduates. It also includes an economic index for each state, showing change over the last 12 months.The regression employs a technique designed to remove spurious variables. Still, it’s vulnerable to some degree of overfitting.The polls-plus model uses a 30/50/20 blend of strategies 1, 2 and 3. That means the regional regression gets the most weight.Polls-only and now-cast do not use pure PVI, and instead use a 70/30 blend of strategies 2 and 3.So far, our regressions suggest that the electorate is slightly less polarized than in 2008 or 2012. Red states aren’t quite as red, and blue states aren’t quite as blue.Blending polls and regressionThe adjusted polling average in each state is combined with the regression. The regression estimate gets more weight early in the race and when there’s less polling. The regression gets 100 percent of the weight when there’s no polling in a state. The polling average can get as much as 95 percent of the weight late in the race in a state with abundant polling.Polls-only and now-cast give slightly less weight to the regression than polls-plus does.As a final step, the regression is recalibrated so that the overall national popular vote is unchanged. If a candidate gains ground in one state because of the regression, the model will necessarily have her lose ground in another.In other words, the purpose of the regression models is not to say the country’s demographics inherently favor Trump or Clinton. Instead, it’s to create a more realistic distribution of the projected vote across each state, especially in states with limited polling. We don’t want to have Clinton winning Kansas based on a single poll there, for instance, while she’s badly losing Nebraska.Calculating the economic indexIn the polls-plus model, the polls/regression blend is combined with an economic “fundamentals” index.Similar to how we calculated it in 2012, the economic index is based on the change in six frequently updated variables over the past year: jobs (nonfarm payrolls); manufacturing (industrial production); income (real personal income); spending (personal consumption expenditures); inflation (the consumer price index); and the stock market (S&P 500).The six variables are normalized to have the same mean and standard deviation then are averaged together, with each variable weighted equally. As of late June, the economy is a mixed bag. For example, income growth is slightly above-average (0.4 standard deviations above average), while industrial production has been slow (1.0 standard deviations below average). Overall, the economy is almost exactly average, relative to the past 50 years of data.The “fundamentals” forecastPolls-plus uses the economic index to calculate a “fundamentals” forecast, assuming that a better economy helps the incumbent party. For example, if the economic index was 0.5 standard deviations above average, it would have the incumbent party winning by 4 to 5 percentage points nationally.The fundamentals model also includes a variable to indicate whether an elected incumbent (such as President Obama in 2012) is running. Because there’s no elected incumbent this year, the model treats this factor as neutral.Therefore, because the economy is almost exactly average and because there’s no incumbent running, the fundamentals model has the race as a tossup.Blending polls and fundamentalsPolls-plus blends the fundamentals-based forecast with the weight assigned to fundamentals declining over time. Right now, 35 percent to 40 percent of the weight is assigned to fundamentals, but it will decline to zero by Election Day. (Highly technical note: Because fundamentals forecasts are subject to overfitting, the weight assigned to the fundamentals is constrained, based on a calculation derived from a 2014 paper by Lauderdale and Linzer.)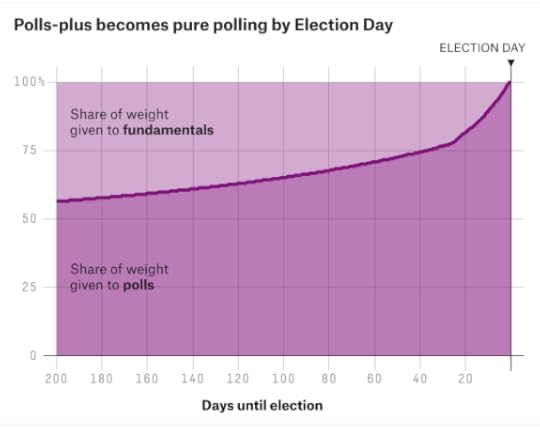 State elasticity scoresSuppose polls-plus assumes that the polls will move slightly toward Trump by Election Day — for instance, that he’ll go from trailing Clinton by 7 percentage points nationally to trailing her by 4 percentage points.Does that mean polls-plus just adds 3 points to Trump in every state? Not quite. Some states are more elastic or “swingy” than others. That is, they’re more sensitive to changes in the national trend.For example, New Hampshire is more “swingy,” because it has a relatively homogenous set of moderate, middle-income white voters.By contrast, Mississippi has relatively few swing voters. Instead, its vote is bifurcated between highly conservative whites and reliably Democratic African-Americans. It won’t change as much as the national polls do.States where one party is dominant (for instance, Massachusetts for Democrats or Utah for Republicans in a typical year) will also tend to swing less given changes in the national vote.Elasticity scores are calculated from individual-level voting records from the Cooperative Congressional Election Study (2012) and state-by-state exit polls (2008).Step 4: Simulate the electionThe final major step is to account for the uncertainty in the forecast and simulate the election.The uncertainty decreases as Election Day approaches.The error from state to state is correlated. If Trump significantly beats his polls in Ohio, he’ll probably do so in Pennsylvania also. Figuring out how to account for these correlations is tricky, but you shouldn’t put too much stock in models that don’t attempt to do so. They’ll underestimate the chances for the trailing candidate if they assume that states are independent from one another.Three types of error
Each simulation accounts for three potential types of error and uncertainty:
National error. The polls are systematically off throughout the country.Demographic and regional error. The polls are off in states that have demographic or geographic factors in common.State-specific error. The polls are off in a particular state, with no effect on other states.National errorIn each simulation, a random number is drawn to model national error. It’s applied to every state about equally, subject to that state’s elasticity score.The magnitude of the national error is based upon: The amount of time until the election (more time = more error); the number of undecided voters (more undecideds = more error); and the number of third-party voters (more third-party votes = more error).Because there’s a significant undecided and third-party vote, national uncertainty is higher than usual this year.Demographic and regional errorSome states’ outcomes are more correlated than others. For instance, if Trump beats his polls in Minnesota, he’ll probably also do so in Wisconsin. But that might not tell us much about Alabama.The model simulates this by randomly varying the vote among demographic groups and regions. In one simulation, for instance, it might have Trump beating his polls throughout the Northeast. Therefore, he wins Maine, New Hampshire and New Jersey. In another simulation, Clinton does especially well among Hispanics and wins both Arizona and Florida despite losing Ohio.The simulations are conducted from a file of more than 100,000 voters, built from the exit polls and CCES.The following characteristics are considered in the simulations: religion (Catholic, mainline Protestant, evangelical, Mormon, other, none); race (white, black, Hispanic, Asian, other); region (Northeast, South, Midwest, West); party (Democrat, Republican, independent); and education (college graduate or not).To get a better sense of how this works, here’s a correlation matrix drawn from recent simulations. You can see the high correlation between Wisconsin and Minnesota, for example.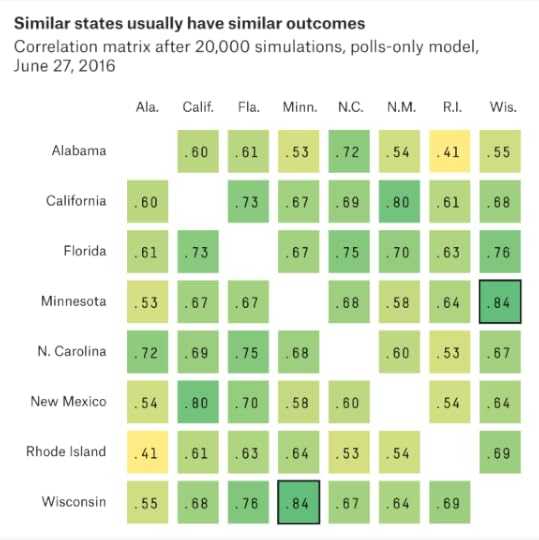 State-specific errorFinally, the model randomly adds additional error specific to one state at a time.A state has more state-specific error when it has fewer polls.It also has more error when polls and demographics disagree. If the regression models and the adjusted polling average show significantly different results — such as in a state like Utah, for instance — that contributes to uncertainty.And states have more state-specific error when they have smaller populations. Small states usually have more demographic idiosyncrasies than larger ones; that makes them harder to poll and harder to model based on patterns we see elsewhere in the country.Odds and ends
That’s basically it! But we’ll conclude with a few odds and ends:
We usually run at least 20,000 simulations for each version of our model each day. That’s a lot, but it still produces a small amount of sampling error. You shouldn’t worry too much when win probabilities change by less than a percentage point.We simulate the vote by congressional district in Maine and Nebraska, which award one electoral vote to the winner of each district and two electoral votes statewide. Where available, district-level polling is used in these forecasts.If no candidate receives a majority of electoral votes, the model assigns the election to Trump half the time (because Republicans are very likely to control a majority of congressional delegations if the election is close) and to the winner of the popular vote the other half of the time.Our distributions have fat tailsNational error, regional error and state-specific error are drawn from a probability distribution. Specifically, they’re drawn from a t-distribution (with 10 degrees of freedom).The t-distribution has fatter tails than a normal (bell curve) distribution. That means it assigns shorter odds to “extreme” outcomes. For example, if a normal distribution laid odds of 50-to-1 against an event, a t-distribution would have it more like 30-to-1 against. And if a normal distribution assigned odds of 1,000-to-1 against, the t-distribution would have it more like 180-to-1 against.The t-distribution is theoretically appropriate given the small sample size. The model is based on only 11 past elections (from 1972 through 2012). We don’t have enough data to really know how the tails behave: whether a candidate trailing by 15 points on Election Day has a 1, 0.1 or 0.01 percent chance of winning, for example. The t-distribution makes more conservative assumptions about this.Handling the third-party voteMost of the procedures I’ve described for Clinton and Trump are also applied for Johnson, but there are some exceptions.The regression-based estimates are simpler for Johnson. Instead of demographics, his vote is modeled based on his vote in 2012, the third-party vote from 1980 through 2008 (i.e., the Perot/Anderson vote), and a state’s PVI.There’s no demographic/regional error for Johnson, only national error and state-specific error. Recent third-party candidates have tended to rise or fall in all states together.The model uses a combination of a beta distribution and a t-distribution to model Johnson’s vote. That produces some funky, right-tailed distributions that look like this: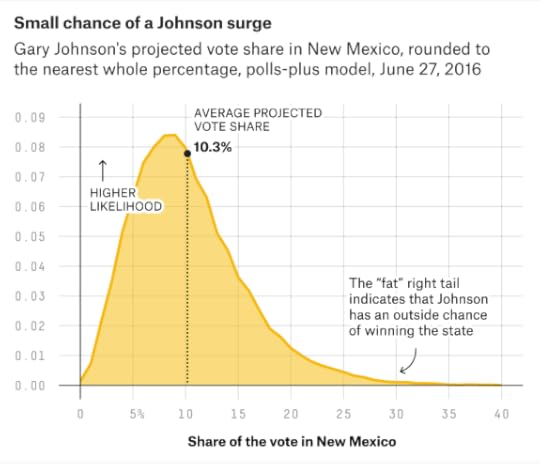 Third- and fourth-party ballot accessWe assume parties will have ballot access in any state where they’ve already secured ballot access, or where they had ballot access in 2012 and the ballot access deadline has not yet passed this year.As applied right now, these rules imply that Johnson will be on the ballot in all 50 states and Washington, D.C. We’ll revisit them if and when he misses ballot access deadlines.The rules also imply that there will be at least one fourth-party candidate (e.g., Stein) on the ballot in every state except Georgia, Indiana, Montana, North Carolina and Oklahoma.Errors and omissions?We try to avoid tinkering with the model once it’s published, but we’re always on the lookout for bugs, especially in the first week or two after the model is released.If there are any significant changes to the model, we’ll disclose them here.If you see something that looks wrong, drop us a line at polls@fivethirtyeight.com.


Nate Silver's Blog

- Nate Silver's profile
- 730 followers

