
Nate Silver's Blog, page 119
October 24, 2016
Election Update: Why Our Model Is More Bullish Than Others On Trump
As I wrote last week, Hillary Clinton is probably going to become the next president. But there’s an awful lot of room to debate what “probably” means.
FiveThirtyEight’s polls-only model puts Clinton’s chances at 85 percent, while our polls-plus model has her at 83 percent. Those odds have been pretty steady over the past week or two, although if you squint you can see the race tightening just the slightest bit, with Clinton’s popular vote lead at 6.2 percentage points as compared to 7.1 points a week earlier. Still, she wouldn’t seem to have a lot to complain about.
Other statistical models are yet more confident in Clinton, however, variously putting her chances at 92 percent to 99 percent. Maybe that doesn’t seem like a big difference, since people (wrongly) tend to perceive odds above 80 percent as sure things. But flip those numbers around, and instead of Clinton’s chances, consider Donald Trump’s. The New York Times’s Upshot model gives Trump an 8 percent chance of winning the election. Our models say a Trump presidency is about twice a likely as The Upshot does, putting his chances at 15 percent (polls-only) and 17 percent (polls-plus). And our models think Trump is about four times as likely to win the presidency as the Huffington Post Pollster model, which puts his chances at 4 percent.
So let me explain why our forecast is a bit more conservative than some of the others you might be seeing — and why you shouldn’t give up if you’re a Trump supporter, or assume you have it in the bag if you’re voting for Clinton. We’ve touched on each of these points before, but it’s nice to have them in one place. I’ll also show you what probability our model would give to Trump and Clinton if we changed some of these assumptions.
Assumption No. 1: The high number of undecided and third-party voters indicates greater uncertainty.Historically, there’s been a strong correlation between the number of undecided and third-party voters, and polling volatility. It also makes sense intuitively. You can think of an election as having two constraints: Candidates keep campaigning until they run out of time (Election Day), or until they run out of voters to persuade (undecideds). While the candidates are almost out of time this year, the number of undecideds is still fairly high (although it’s decreasing). In national polls, Clinton and Trump together have approximately 85 percent of the vote, while Mitt Romney and Barack Obama had about 95 percent of the vote at this time four years ago.
What if we changed this assumption? If we tweaked our model so that it only considered the number of days left until the election when calculating uncertainty, Trump’s chances would decline to 10 percent, while Clinton’s would rise to 90 percent. Most other models do not consider the number of undecided voters, so this factor explains some of the differences between FiveThirtyEight’s model and those that have Clinton’s win probability in the 90s.
Assumption No. 2: The FiveThirtyEight model is calibrated based on general elections since 1972.Why use 1972 as the starting point? It happens to make for a logical breakpoint because 1972 marked the start of the modern primary era, when nominees were chosen in a series of caucuses and primaries instead of by party elders.
But that’s not why we start at 1972. Instead, the reason is much simpler: That’s when we begin to see a significant number of state polls crop up in our database. Since our model is based on a combination of state and national polls, we can’t get a lot of utility out of years before that. On the flip side, since elections suffer from inherently small sample sizes (this is just the 12th election since 1972), we think it’s probably a mistake to throw any of the older data out.
What if we changed this assumption? If we calibrated the model based on presidential elections since 2000 only — which have featured largely accurate polling — Clinton’s chances would rise to 95 percent, and Trump’s would fall to 5 percent.
But we think that would probably be a mistake. It’s becoming more challenging to conduct polls as response rates decline. The polls’ performance in the most recent U.S. elections — the 2014 midterms and the 2016 presidential primaries — was middling. There have also been recent, significant polling errors in democracies elsewhere around the world, such as Israel and the United Kingdom. It may be naive to expect the pinpoint precision we saw in polls of presidential elections from 2000 through 2012 — a sample of just four elections — to represent the “new normal.” Going back to 1972 takes advantage of all the data we have, and includes years such as 1980 when there were significant late polling errors.
Assumption No. 3: The FiveThirtyEight model uses a t-distribution with “fat tails,” which gives a greater likelihood of rare events.I’ll go through this one quickly, because it makes relatively little difference. Instead of a normal distribution — what you might know as a bell curve — our model uses a student’s t-distribution instead. The t-distribution has fatter tails (think of them as big lips flaring out on the bell).
This mostly makes a difference for very low-probability events. For example, for an event that a normal distribution regarded as a 1-in-1,000 chance, our t-distribution would assign odds of 1-in-180 instead, making it about six times as likely. A t-distribution is appropriate in cases like presidential elections where you have small sample sizes.
What if we changed this assumption? It wouldn’t matter that much. If we used normal distributions instead of t-distributions, Clinton’s chances in polls-only would rise to 87 percent from 85 percent, while Trump’s would fall to 13 percent. This assumption will matter more if Clinton gains further ground; it would make it harder and harder for her to keep gaining in the forecast once she gets up into the mid- to high 90s.
Assumption No. 4: State outcomes are highly correlated with one another, so polling errors in one state are likely to be replicated in other, similar states.In 2012, Obama beat his polling by 2 or 3 percentage points in almost every swing state. The same was true in 1980 when Ronald Reagan won in a landslide — instead of the modest lead that polls showed a few days before the election — and claimed 489 electoral votes by winning almost every competitive state. You also frequently see this in midterms — Republicans beat their polling in almost every key Senate and gubernatorial race in 2014, for example.
Basically, this means that you shouldn’t count on states to behave independently of one another, especially if they’re demographically similar. If Clinton loses Pennsylvania despite having a big lead in the polls there, for instance, she might also have problems in Michigan, North Carolina and other swing states. What seems like an impregnable firewall in the Electoral College may begin to collapse.
What if we changed this assumption? If we assumed that states had the same overall error as in the FiveThirtyEight polls-only model but that the error in each state was independent, Clinton’s chances would be … 99.8 percent, and Trump’s chances just 0.2 percent. So assumptions about the correlation between states make a huge difference. Most other models also assume that state-by-state outcomes are correlated to some degree, but based on their probability distributions, FiveThirtyEight’s seem to be more emphatic about this assumption, accounting for both the possibility a significant national polling error and other types of correlations, such as between states in different regions.
As we say frequently, the greater uncertainty in the FiveThirtyEight forecast cuts both ways. So while we show a greater likelihood of a Trump win than most other models, we’d also assign a greater possibility to a Clinton landslide, in which she wins the election by double digits. But while the campaign is almost over, the suspense isn’t quite done.


October 23, 2016
Election Update: Trump May Depress Republican Turnout, Spelling Disaster For The GOP
Instead of a poll, let’s start today’s Election Update with some actual votes. According to the estimable Nevada journalist Jon Ralston, Democrats have a 20-percentage-point turnout edge so far based on early and absentee voting in Clark County (home to Las Vegas), Nevada. And they have a 10-point edge in Washoe County (home to Reno).
Nevada is one of a number of states where Democrats usually do better in early voting than in the vote overall, so this shouldn’t be taken to mean that Hillary Clinton and the Democratic U.S. Senate candidate in Nevada, Catherine Cortez Masto, are going to win their races by double digits. But Nevada is an interesting state, insofar as both Clinton and Donald Trump can find things to like about its demographic makeup: In Clinton’s case, the growing number of Hispanic and Asian-American voters bodes well for her; in Trump’s case, there’s the fact that only about one-third of Nevada’s white voters have college degrees, according to FiveThirtyEight’s estimates. Furthermore, Nevada has shown tight polling all year, with Clinton having only pulled ahead since the debates — surprising given that President Obama won Nevada by 7 percentage points in 2012 and that Clinton is beating Obama’s numbers in other Western states.
Those early-voting numbers, though, don’t look good for Trump. Democrats are matching their 2012 pace in Clark County, according to Ralston. And they’re beating it in Washoe County, a place where the demographics ought to be relatively Trump-friendly. If Clinton is pulling in her marginal voters and Trump isn’t getting his, things could go from bad to worse for the GOP.
One needs to be careful about drawing too many inferences from early-voting data. There are a lot of states to look at and a lot of ways to run the numbers, and we’ve seen smart analysts trick themselves into drawing conclusions that didn’t necessarily hold up well by Election Day. But it seems fair to say the data is mostly in line with the polls. Democrats are seeing very strong early-voting numbers in Virginia and reasonably encouraging ones in North Carolina, two states where Clinton has consistently outperformed Obama in polls. They also seem set to make gains in Arizona and Colorado, where the same is true. But Democratic numbers aren’t all that good in Iowa or Ohio, where Clinton has underperformed Obama in polls.
The problem for Trump is that taken as a whole, his polls aren’t very good — and, in fact, they may still be getting worse. An ABC News national poll released on Sunday morning — the first live-caller poll conducted fully after the final presidential debate — showed Clinton leading Trump 50 percent to 38 percent. Clinton’s 12-point lead in that poll is toward the high end of a broad range of results from recent national polls, with surveys showing everything from a 15-point Clinton lead to a 2-point Trump edge. But the ABC News poll is interesting given its recency and given why Clinton has pulled so far ahead in it — Republicans aren’t very happy with their candidate and may not turn out to vote:
The previous ABC/Post poll found a sharp 12-point decline in enthusiasm for Trump among his supporters, almost exclusively among those who’d preferred a different GOP nominee. Intended participation now has followed: The share of registered Republicans who are likely to vote is down 7 points since mid-October.
I’d urge a little bit of caution here, given that swings in enthusiasm can be transient and can sometimes exaggerate the underlying change in voter sentiment. Our polls-only forecast has Clinton up by about 7 percentage points instead of by double digits — and our polls-plus forecast would still bet on the race tightening slightly.
But you can easily see how the worst-case scenario is firmly on the table for Trump and Republican down-ballot candidates, where the bottom falls out from GOP turnout. Consider:
Trump is getting only about 80 percent of the Republican vote, whereas candidates typically finish at about 90 percent of their party’s vote or above.Furthermore, the Republicans missing from Trump’s column tend to be high-education, high-income voters, who typically also have a high propensity to vote.Voters are increasingly convinced that Clinton will win the election, and turnout can be lower in lopsided elections. (Although, this presents risks to both candidates: complacency on the part of Democrats, despondency on the part of Republicans.)Republicans and Trump have a substantial ground game deficit, with Clinton and Democrats holding a nearly 4-1 advantage in paid staffers.Trump’s rhetoric that the election is rigged could discourage turnout among his own voters.Trump’s base is relatively small, especially if he underperforms among college-educated Republicans.The nightmare scenario for the GOP is that high-information Republican voters, seeing Trump imploding and not necessarily having been happy with him as their nominee in the first place, feel free to cast a protest vote at the top of the ticket. Meanwhile, lower-information Republican voters don’t turn out at all, given that Trump’s rigging rhetoric could suppress their vote and that Republicans don’t have the field operation to pull them back in. That’s how you could get a Clinton landslide like the one the ABC News poll describes, along with a Democratic Senate and possibly even — although it’s a reach — a Democratic House.
That isn’t the only scenario in play, but it’s an increasing possibility. Overall, Clinton’s chances of winning the presidency are 87 percent according to our polls-only model and 85 percent according to polls-plus.

October 21, 2016
Election Update: There Are 4 Ways This Election Can End — And 3 Involve Clinton Winning
It’s tempting to say that voters have made up their minds and that the presidential vote is set. Hillary Clinton has a 6.6-percentage-point lead in the popular vote and an 87 percent chance of winning the Electoral College, according to our polls-only forecast. A week ago, those numbers were about the same: a 6.4-point lead and an 85 percent chance. In our polls-plus forecast, Clinton’s chances are 84 percent, up only slightly from 82 percent a week ago.
Furthermore, although we have only a handful of polls that postdate the third presidential debate, they don’t show much change so far. The only national poll conducted fully after the debate — from Morning Consult for Politico — shows Clinton up 6 percentage points, the same margin Morning Consult had in their previous poll. A couple of the national tracking polls have moved a bit — but the movement has been in different directions.
But it’s premature to assume that Clinton is locked into a 6- or 7-point win. It’s narrowly premature because there’s been only one full day of polling since the final debate, and that isn’t necessarily enough time to show any further shifts in the race. And it’s broadly premature because there’s still a lot of uncertainty in the outcome.
Wait — I hear you saying — didn’t you just tell me that there’s an 87 percent chance Clinton will win? That doesn’t sound like all that much uncertainty.
Well, it depends on your tolerance for risk, I suppose. Donald Trump’s chances in our model are about 1 in 7, and you’d expect a candidate with a 1-in-7 chance to win about one presidential election every 28 years. So while it would be a rare occurrence, we’re not quite in once-in-a-lifetime territory.
But mostly I mean that, while Clinton’s in a reasonably safe position, there’s quite a bit of doubt about her potential margin of victory, both in the popular vote and the Electoral College.
The charts below — which are based on 20,000 simulations from our model as of Friday afternoon — attempt to explain this by laying out four broad scenarios:
A Trump win, including cases where he loses the popular vote but wins the Electoral College.A narrow Clinton win, wherein she wins the Electoral College, but wins the popular vote by 3 percentage points or less. (Or wins the Electoral College and loses the popular vote.)A Clinton win in the “Obama zone,” wherein she wins the popular vote by 4 to 7 percentage points — the margins by which President Obama won the elections in 2012 and 2008, respectively. Clinton is all but certain to win the Electoral College if she wins the popular vote by this amount.Finally, a Clinton blowout, wherein she wins the popular vote by 8 points or more, which would almost certainly also yield a dominant performance in the Electoral College.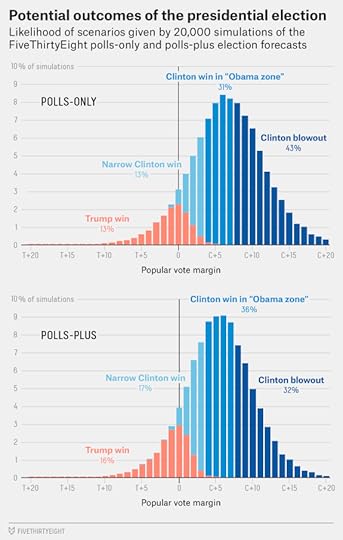
The polls-only forecast currently shows Clinton in the “Obama zone,” but it also has her with only about a 1-in-3 chance of ending up there. If Clinton gains any further ground on Trump, then we’re really into blowout territory, with Arizona potentially turning blue, perhaps along with more exotic options.
But the race could also tighten — or the polls could be overstating Clinton’s advantage. (Or both, in which case Clinton could still lose.) Maybe there’s something to the argument that the race has tended to ebb and flow between narrower and wider Clinton leads, and that Clinton’s been at a high-water mark recently. I’m not totally sure that I buy it because of Trump’s lack of discipline on the campaign trail and the short amount of time left. But our model says to be cautious because of the still-high number of undecided voters and the broad swing state map, and that uncertainty could cut in either direction.
The polls-plus model, in fact, still discounts Clinton’s lead slightly, expecting the race to tighten by a point or so. It has her squarely in the middle of the “Obama zone” instead of edging up against a landslide. It also uses a somewhat narrower probability distribution, since the extra information that polls-plus accounts for theoretically improves the forecast’s precision. So it has her with a 36 percent chance of an Obama-type win, a 32 percent chance of a blowout, and a 33 percent chance of having to sweat — either a close call or a loss.
The point is really just this: To say that Clinton has (roughly) an 85 percent chance of winning is not to say that she’s going to glide to victory 85 percent of the time. The 85 percent figure includes its share of close calls, along with a (larger) share of blowouts. It includes a few oddball scenarios, like Clinton winning the Electoral College while losing the popular vote. One benefit of having a 6- or 7-point lead is that a couple of things can go wrong — including somewhat inaccurate polling — and you can still win.

How Much Uncertainty Is Left About The Election?
FiveThirtyEight editor-in-chief Nate Silver and politics editor Micah Cohen talk about how much we still don’t know about the state of the presidential race in the latest installment of “Model Talk” from our Elections podcast. Hillary Clinton is likely to win, but there’s still a lot we don’t know. In Utah, for example, independent candidate Evan McMullin’s chances of winning have risen to 14 percent, according to our polls-only model (and 25 percent in our nowcast). Nate also answers listener questions about how the forecast model works, including who actually enters new polls.
You can listen to the episode by clicking the “play” button above or by downloading it in iTunes, the ESPN App or your favorite podcast platform. If you are new to podcasts, learn how to listen.
The FiveThirtyEight Elections podcast publishes Monday evenings, with occasional special episodes throughout the week. Help new listeners discover the show by leaving us a rating and review on iTunes. Have a comment, question or suggestion for “good polling vs. bad polling”? Get in touch by email, on Twitter or in the comments.

October 20, 2016
Election Update: ‘Likely Voters’ Aren’t Helping Trump Much
FiveThirtyEight’s highest traffic often comes on the day just after major events, like debates or key presidential primaries. Everyone wants to know how those events are going to move the polls. We’re sometimes happy to speculate about that, when we think the answer is obvious enough. But the problem is that there usually isn’t any data that soon, since the polls will take a few days to register any effects.
In fact, it’s rare to see pollsters release results at all in the first day or two after a debate. So you usually end up with a weird mix of polls. The daily tracking polls don’t stop publishing, but they’re an outlier-y set of polls this year that usually aren’t worth getting too worked up about. Someone decided to publish a Tennessee poll today? Hey, that’s cool, I guess. About the only number of any real consequence on Thursday was a Suffolk University poll that showed a tied race in Ohio — not a bad result for Donald Trump, except that he’d been up 3 percentage points in Suffolk’s previous poll of the state.
Therefore, our forecast is largely unchanged, with Hillary Clinton having an 87 percent chance of winning the presidency according to our polls-only model, and 84 percent according to polls plus. To repeat: None of the polls yet reflect any potential effects from the third presidential debate on Wednesday, so our forecast doesn’t account for the debate either.
So let’s use today’s Election Update as an excuse to talk about something else: the effect that likely-voter models are having on the polls. Every pollster has its own method for determining who’s a likely voter, although I generally think of likely-voter models as falling into two categories: “soft” likely-voter screens that simply ask voters whether they’re likely to vote, and “hard” likely-voter screens like the one that Gallup employed that use a longer battery of questions, including past voting history. I won’t go into too much more detail on methodology here, but there’s a great primer on likely-voter models at the old Mystery Pollster site if you’re into that kind of thing.
Typically, likely-voter models help Republican candidates, since their voters are older, whiter and have higher socioeconomic status, all of which correlate with higher turnout. (Although, note that the latter variable may not hold with Trump because his support has collapsed with college-educated voters.) But the effect varies from election to election. In the 2010 midterms, there was a severe difference between likely-voter and registered-voter polls, with likely-voter polls being a net of about 6 percentage points better for Republicans. And the likely-voter polls basically turned out to be right: Republicans had a great year, underperforming their polls in a couple of close Senate races but winning even more House seats than expected.
The difference between likely-voter and registered-voter polls tends to be smaller in presidential election years. In fact, it probably should be fairly small since most registered voters — somewhere north of 80 percent, according to the Current Population Survey — turn out to vote. In 2008 — a year of profound Democratic enthusiasm behind Barack Obama — there was almost no difference between registered- and likely-voter polls. In 2012, there was a gap, with Mitt Romney gaining a net of about 2 points in likely-voter surveys. Given that likely-voter polls underestimated Obama’s performance in the end, however, perhaps that was too much.
This year, there also isn’t much of a gap. We keep diligent track of polls like this one that release both registered- and likely-voter numbers, since they’re used to calibrate the likely-voter adjustment that our models use. So here’s a summary of every such poll we’ve found. In the table, the “weight” column indicates how much influence the pollster has on the likely-voter adjustment, which is a function of the number of polls it has conducted and its pollster rating.
POLLSTERSTATESWEIGHTCLINTON GAINTRUMP GAINNET TRUMP GAINMonmouth UniversityUS6.82+2.5+3.6+1.1Marist CollegeVarious6.00+0.8+2.0+1.2IpsosUS5.66+1.0+1.6+0.7ABC News/Washington PostUS, VA5.40+2.4+3.4+0.9Fox NewsUS, various4.88+1.4+2.3+0.9CNN/Opinion Research Corp.US, various4.34+0.7+2.5+1.8Marquette UniversityWI4.12+3.5+2.9-0.5NBC News/Wall Street JournalUS2.48+1.0+0.5-0.5Public Religion Research InstituteUS2.43+0.4+2.8+2.4GQR/American ViewpointCA2.22-2.0+2.5+4.5Franklin & Marshall CollegeCO, PA2.11+2.6+2.7+0.1AP-GfKUS1.79+3.0+2.0-1.0Morning ConsultUS1.77+2.0+2.6+0.6CBS News/New York TimesUS1.52+1.0+3.0+2.0Echelon InsightsUS1.42+2.7+2.7+0.0SurveyMonkeyUS, CA1.29+1.2+1.0-0.2YouGovMA1.07+3.0+1.0-2.0University of Mary WashingtonVA1.00+2.0+4.0+2.0Utah Valley UniversityUS0.98+1.9-0.9-2.8U. of Massachusetts LowellNH0.87+2.0+3.0+1.0TargetSmart/William & MaryOH0.85+0.0+0.0+0.0Texas LyceumTX0.81+3.0+9.0+6.0Middle Tennessee State U.TN0.77+6.0+4.0-2.0Elway ResearchWA0.76+2.0+0.0-2.0Weighted average+1.7+2.5+0.8Likely-voter models don’t help Trump muchSource: FiveThirtyEight election forecast
A couple of things to point out here. First, while we usually talk about a likely-voter screen as helping the Republican — or, occasionally, as helping the Democrat — technically speaking they usually help both major-party candidates, as both gain votes from the undecided column (and sometimes from third-party candidates). It’s just that the Republican usually gains a little more.
That’s true this year also, but the difference is minor. Trump gains a net of 2.5 percentage points in likely-voter polls, as compared with registered-voter polls. But Clinton gains 1.7 points. So the net gain for Trump is only 0.8 points.
And second, there’s actually quite a bit of agreement among pollsters about the likely- vs. registered-voter gap this year, at least when you look at each firm’s polling in the aggregate. Most show somewhere between a 1-point gap favoring Clinton and a 2-point gap favoring Trump. Individual polls can sometimes show larger gaps, especially if a pollster is using “hard,” Gallup-style likely-voter screens. (Those “hard” screens can sometimes introduce artificial volatility into a poll.) But taken as a whole, the consensus is that there’s at most a modest advantage for Trump in the likely-voter electorate, somewhat less than a Republican candidate would typically receive.
That makes a certain amount of sense. Trump voters may be more enthusiastic, although the data has been a bit mixed on that, and voter enthusiasm can vary with events on the campaign trail. And his voters are certainly older and whiter than Clinton’s. But Trump’s reliance on voters without college degrees — especially men without college degrees — could disadvantage him because they turn out at lesser rates.
Then there’s Trump’s lack of a turnout operation, which may or may not be reflected in polls. If Clinton’s campaign is more successful at persuading low-propensity voters to go to the polls, those voters may make it through the “soft” likely-voter screens but may be incorrectly screened out by “hard” screens that rely on past voting history. The effect of Clinton’s ground game on the polls — and the eventual outcome — is one of the big unanswered questions about the race, but presents some further downside risk for Trump.


Clinton Probably Finished Off Trump Last Night
I’m not sure I need to tell you this, but Hillary Clinton is probably going to be the next president. It’s just a question of what “probably” means.
Clinton went into the final presidential debate on Wednesday with a lead of about 7 percentage points over Donald Trump. And according to the only two scientific polls we’ve seen, voters thought that Clinton won the debate. Occasionally, the initial reaction to a debate can differ from the way it’s perceived days later. But in this case, the morning headlines, which focused overwhelmingly on Trump’s refusal to say whether he’ll accept the election results, are potentially worse for Trump than the debate itself. In YouGov’s poll of debate watchers, 68 percent of voters said they think the candidates should pledge to accept the results of the election.
There are less than three weeks left in the campaign, and there are no more guaranteed opportunities for Trump or Clinton to command a huge public audience, as they do at the conventions and the debates (although, they’ll get plenty of attention, of course). Millions of people have already voted. Trump has had a significant advertising deficit, and an even more significant deficit in terms of his turnout operation. He’ll probably spend a significant chunk of the remaining news cycles quarreling over his contention that the election is rigged, and with the numerous women who have accused him of sexual assault. He doesn’t have an obvious — or even a not-so-obvious — path to the presidency.
So we’re left to argue about the probability of an unforeseen event, or a significant polling error. It’s perhaps significant that almost no matter what news has occurred, and there’s been a lot of it — terrorist attacks, mass shootings, foreign crises, her email scandal, the Wikileaks dump, her Sept. 11 health scare — Clinton has almost always led Trump in the polls, although there have certainly been times when the election was close. What if her State Department emails are sitting on one of Julian Assange’s servers? That would be interesting, I suppose. But there are also October (or November) surprises that could work against Trump: more accusations from women, more damaging videotapes, further leaking of his tax records.
The other possibility is a massive polling failure. There aren’t really any direct precedents for a candidate coming back from this far down to win an American presidential election, although you can make a few loose analogies. Harry Truman’s comeback over Thomas Dewey in 1948 almost works as a comparison, but Truman wasn’t coming from as far behind as Trump is, and there was much less polling in 1948. Ronald Reagan had a significant late surge against Jimmy Carter in 1980, but he was ahead beforehand — and the surge came in large part because of a debate that occurred just one week before the election, whose impact was too late to be fully reflected in the polls. If Trump was going to have a Reaganesque surge, in other words, it probably would have started with a commanding performance in last night’s debate — and not another loss.
Brexit? Even that comparison doesn’t really work. The final polls showed a toss-up between the United Kingdom leaving the European Union or remaining in it, and “leave” eventually won by 4 points. If the polls were biased against Trump by that much in this election, he’d still lose, by a margin approximating the one by which Mitt Romney lost to President Obama four years ago. The primaries? They’re a reminder that one ought to be humble when making predictions. But the polls pegged Trump just fine — in fact, slightly overestimating his performance in many early states such as Iowa.
That’s not to say that a polling miss is impossible. Our polls-only model still gives Trump a 14 percent chance and our polls-plus forecast a 17 percent chance, although that’s before accounting for any impact of last night’s debate or some of the other circumstances I’ve described. Presidential elections are rare events, rare enough that we don’t really know what the tail ends of the probability distribution look like, and it’s prudent to make somewhat conservative assumptions under those conditions. It’s possible, also, that the polls are significantly underestimating Clinton rather than Trump — perhaps a combination of Trump’s lack of a ground game and his voters’ feeling despondent because he says the election is rigged will yield a double-digit loss.
If Clinton wins by a clear margin, it will help to resolve a longstanding debate among political scientists and historians, since it will suggest that campaigns and candidates do matter and that elections aren’t always determined by economic conditions, which would predict a much closer outcome than the one we’re likely to see. Furthermore, Clinton’s win will have come by rather conventional means. Her big surges in the polls came following the conventions and the debates. She got the largest convention bounce of any candidate since at least 2000, and she won the debates by a clearer margin than any previous candidate in the six elections in which there were three debates that CNN polled.
MARGIN IN POST-DEBATE POLLSDEBATE WINNERYEAR1ST DEBATE2ND DEBATE3RD DEBATETOTALClinton (vs. Trump)2016+35+23+13+71Obama (vs. McCain)2008+13+24+27+64Clinton (vs. Bush)1992+14+42+0+56Kerry (vs. Bush)2004+16+2+13+31Romney (vs. Obama)2012+42-7-8+27Bush (vs. Gore)2000-7+13-2+4Clinton was the most dominant debater to dateElections without three debates (or without post-debate polls for all three debates) are not shown.
Source: CNN, USA Today/Gallup Polls
There was nothing flashy about Clinton’s performance at either the convention or the debates. She was just prepared, steady and tactically smart — such as goading Trump into feuds with the family of Khizr Khan, or Alicia Machado. Trump might seem like an easy opponent to take down, and he certainly hasn’t helped himself. But as Trump himself would probably point out, 16 Republicans failed to do so. We won’t know for sure for another 19 days, but Clinton may have finished him off last night.
VIDEO: Trump goes all in on “rigged election” charge

October 18, 2016
Election Update: Clinton’s Texas Opportunity (And Her Texas Problem)
Another day, another traditionally Republican state that Donald Trump could shockingly manage to lose. Yesterday, I wrote about Utah, where Trump’s weakness with Mormon voters could throw the state to Hillary Clinton or to independent candidate Evan McMullin. Today, we turn to Texas, where two new polls show a tight race: A University of Houston poll has Trump up just 3 percentage points there, while SurveyMonkey puts Trump’s lead at 2 points.
Trump will probably win Texas. Earlier polls had shown a close-ish race there, but with a Trump lead in the high single digits. And as a hedge against the polls, our forecast still assigns a little bit of weight to our regression-based analysis, which is based on demographics and voting history. Thus, our model still has Trump ahead by 5 or 6 percentage points in Texas, and puts Clinton’s chances of an upset at 17 percent.
But to put that in perspective, Texas is closer than Pennsylvania right now (where Clinton leads by 7 to 8 points). And Clinton is more likely to win Texas than Trump is to win the election, at least according to the polls-only model, which puts Trump’s overall chances at 12 percent.
As in Utah, demographics play a role in Trump’s struggles in Texas. The state’s white population is well-educated, and includes some workers who have moved from other parts of the country to take advantage of the state’s burgeoning economy. (College-educated whites have turned away from Trump.) Texas also used to have its share of Republican-leaning Latinos — George W. Bush won almost half of the Latino vote there in 2004 — another group that Trump has turned off. Meanwhile, only 43 percent of Texas’ population consists of non-Hispanic whites, down from 52 percent in 2000. However, because 11 percent of Texas’ population consists of non-citizens — many of them recent immigrants from Mexico — its electorate is whiter than its population overall.
But Texas isn’t some sort of outlier. Instead, it typifies the national trend. Compared with Mitt Romney, Trump is underperforming more in red states than in purple states or blue states. And Trump’s vote has fallen off more in the South than in other parts of the country.
In 2012, President Obama lost the South (as defined by the Census Bureau) by 7 percentage points. This year — according to our polls-only projections as of mid-afternoon on Tuesday — Clinton is losing the South to Trump by only 1 point. So the South has swung toward Democrats by a net of 6 points, turning Virginia from a tipping-point state into one that Clinton is all but certain to win, flipping North Carolina (probably) from red back to blue, and making states such as Texas and Georgia competitive at times. Clinton has also made significant gains relative to Obama in the West, where she’s outperforming him by 4 to 5 percentage points. But her numbers are only a point or two better than Obama’s in the Midwest — and are worse in some Midwestern states such as Iowa. And she’s actually underperforming Obama, slightly, in the Northeast.
2012 RESULT2016 PROJECTIONCHANGECensus Bureau regionNortheastObama _+18.9Clinton _+16.9R_+2.0SouthRomney __+7.1Trump __+1.2D_+5.9MidwestObama __+3.1Clinton __+4.4D_+1.3WestObama _+10.7Clinton _+15.1D_+4.4Type of state in 2012BlueObama _+22.0Clinton _+21.5R_+0.5SwingObama __+4.1Clinton __+6.0D_+1.9RedRomney _+16.9Trump __+8.5D_+8.4Southern states and red states show biggest swing toward ClintonSwing states include Colorado, Florida, Iowa, Michigan, Minnesota, Nevada, New Hampshire, North Carolina, Ohio, Pennsylvania, Virginia and Wisconsin. Red states include every state redder than North Carolina in 2012; blue states include every state bluer than Michigan. Results in each group of states are weighted based on 2016 turnout projections, which reflect population growth since 2012.
Meanwhile, most of Clinton’s gains relative to Obama have come in red states. Obama won the 12 states that were generally defined as swing states in 2012 — Colorado, Florida, Iowa, Michigan, Minnesota, Nevada, New Hampshire, North Carolina, Ohio, Pennsylvania, Virginia and Wisconsin — by an aggregate of 4 percentage points (weighted based on their turnout). Clinton is leading in these states by 6 points. That’s a comfortable-enough margin, but her gains have been smaller in swing states than in the popular vote overall. (Clinton is winning the popular vote by about 7 points in our forecast, while Obama’s margin over Romney was slightly less than 4 points.) That’s because of Clinton’s disproportionate gains — or maybe we should say Trump’s disproportionate losses — in red states. Trump is winning red states by only 8 or 9 percentage points, while Romney won them by 17 points, yielding opportunities for Clinton to catch him in states ranging from Texas to Alaska.
There’s just one somewhat negative aspect of this for Clinton, one which we’ve pointed out before. The gains in red states could yield an inefficient distribution of the popular vote for her, in terms of its impact on the Electoral College. Texas and Utah alone are responsible for shifting the national popular vote by a net of about 1 percentage point toward Clinton, relative to Obama’s performance in 2012. So while the upside for Clinton is potentially turning some very red states blue if she maintains her current position in the polls, there could be a penalty if the race tightens again and Clinton loses a lot of states by a narrow margin.

Should Clinton Play For An Electoral College Landslide?
In this week’s politics chat, we debate Hillary Clinton’s Electoral College strategy. The transcript below has been lightly edited.
micah (Micah Cohen, politics editor): Welcome, all. For your consideration: Should Hillary Clinton, now leading Donald Trump by about 7 percentage points, concentrate on securing her “must-win” states or try to expand her map? This question is, reportedly, currently occupying the minds of Clinton campaign staffers. So which makes more sense: Try to put traditionally red states like Texas, Utah and Missouri in play? Or reinforce the firewall?
Let’s talk overall strategy and then dive into some of the states. But first, just so we’re all on the same page: Which states are in Clinton’s firewall?
harry (Harry Enten, senior political writer): Normally, we mean Colorado, Michigan, New Hampshire, Pennsylvania, Virginia and Wisconsin. If Clinton wins those, she could lose Florida, Iowa, Nevada, North Carolina and Ohio and still win the election.
natesilver (Nate Silver, editor in chief): The firewall doesn’t include Nevada, Florida and North Carolina. And you absolutely, positively want to target those three as backup options.
The question is what states you need beyond that.
micah: OK, so let’s talk in generalities to start — better to go big or play it safe?
harry: I guess the question is what’s the purpose of this campaign. If the purpose is to win, then you reinforce. If the purpose is to win big and embarrass Trump, then you go into these red states. The national tide determines most of this, so Clinton can’t win Arizona unless she’s winning big nationally (which she is currently).
natesilver: In general, I think you plan for what the swing states would look like in a tied race. In other words, what FiveThirtyEight calls the tipping-point states — those states closest to the national margin. So that means putting the extra dollar into Florida or Pennsylvania or North Carolina and not Arizona or Texas.
harry: I think I agree with Nate, but I know a lot of other folks who think this race is over and that she should go for the kill. Another consideration is expanding to other states to help down-ballot candidates.
natesilver: Obviously, I’m assuming that the goal is to maximize the chances of winning the Electoral College. Which probably should be the goal, I think?
micah: Hmmm … not sure I agree.
natesilver: Here’s the thing, though. If Clinton beats Trump by, say, 8 percentage points, is anyone really going to care if she’s won Arizona or Georgia?
harry: If you want to have a functioning government, you want to bring as many Democrats into Congress as you can. Expanding the map probably increases the chance of doing that.
micah: Yeah, I think this comes down to a question about governing.
clare.malone (Clare Malone, senior political writer): Oh, do we care about that here?
micah: Clare! Of course.
So, here’s my argument:
If she wins, Clinton is likely to enter office with one of the worst favorability ratings ever for a newly elected president (and her approval rating will likely follow). The more she can run up the score, the more Democrats she brings along and the more of a mandate she can claim, the more likely she’ll be able to enact her agenda. That’s all extra important this year — though it probably shouldn’t be — as a guard against the inevitable arguments we will hear that she “only won because she was running against Trump.”
clare.malone: Clinton’s campaign is naturally conservative, though. I think expanding the map has a lot of risks that they’re not necessarily inclined to take.
micah: Interesting … what are the risks?
clare.malone: Running yourself too thin in ad dollars, perhaps, in markets where you really need to come through? I dunno.
micah: I’m not sure how constrained their resources are, tbh.
harry: I think the Clinton folks don’t have a money problem. You could argue that by expanding the map, she’s forcing the Trump campaign to potentially spend money it doesn’t have in places it shouldn’t need to be spending it.
clare.malone: That’s fair. Maybe it’s more staff resources in the last month I’m thinking of. If you were going to really make an all-out, last-month effort in a state that’s not typically blue, wouldn’t you have to pluck some organizers from other states to head up volunteer efforts?
You can pull a lot of in-state volunteers, sure, but in the last month of a campaign, you might not be inclined to make outside hires so much as to move around internal staff resources.
This is speculation on my part. I’m not sure how they’re operating on the HR front.
natesilver: OK, but there’s sort of a bullshit sleight-of-hand that you’re pulling there, Micah. Clinton expanding her map isn’t the same thing as maximizing Democrats’ down-ballot gains.
micah: They’re correlated, no?
natesilver: They’re correlated, but you’re possibly confusing correlation for causation.
harry: I think what I’d be doing is upping the spending on those periphery states. That isn’t Texas, but it is Arizona. The states that are pinkish — where you could perhaps move a few points to the left.
natesilver: I mean, Arizona is on the verge of being a real swing state, so maybe it’s an exception. But we can talk about that later. In general, though, I think you ought to be conservative. And if down-ballot is the consideration — well, you really just ought to give a bunch of money to the down-ballot candidates, although helping them with your turnout operation could be a boost.
But it’s not like Clinton stumping for Jason Kander in Missouri would be all that helpful to him, because he’s more popular there than she is and running as sort of an anti-establishment candidate himself.
harry: I feel like Nate’s cracking to Micah’s argument here. I can see him cracking.
clare.malone: The idea of boosting Senate or even House races seems more interesting, I agree.
micah: Yeah, I think I’m winning this argument.
clare.malone: Wait. We’re talking about down-ballot races — that wasn’t exactly your argument.
micah: It was half of it. But what about the other half of my argument: the more mushy mandate thing?
harry: Seems good enough to me. Let’s not embarrass Nate anymore.
natesilver: So to return to my earlier point: What tangible difference does it make if Clinton wins nationally by 7 points and wins Arizona by a point, versus when she wins nationally by 7 points but loses Arizona by a point?
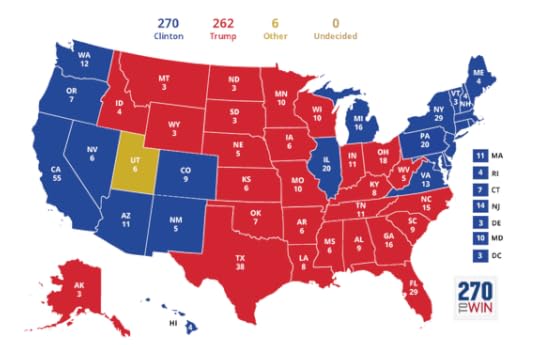
harry: People look to the map to understand how big the victory was. We have a winner-take-all system.
micah: Yeah, if the map everyone sees on Nov. 9 is covered in blue, doesn’t that make a difference?
clare.malone: I think it’s a reasonable goal for them to want to/try to win at least one unexpected state. A spot of blue in a sea of red can be a striking visual that people walk away with.
natesilver: So should they aim for states that are physically larger because they’re more impressive on the map?
clare.malone: Hah, yes.
natesilver: So Alaska then?
clare.malone: No.
natesilver: Or not Alaska because it gets shrunken down?
harry: Is this a Mercator problem? I don’t know maps.
clare.malone: Just that actually solidifying somewhere like Arizona would be a storyline, or winning Georgia — that would get talked about.
micah: Look how impressive this looks:
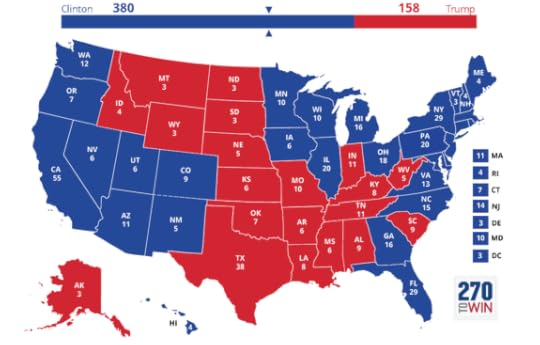
Compared to this:
clare.malone: But that seems overboard — to go the full monty as Micah laid out in that first map and try to win allllll those wishful-thinking states.
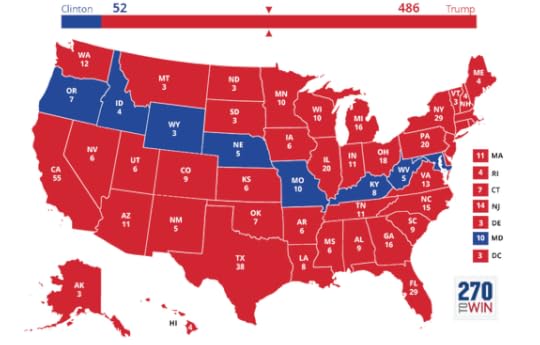
natesilver: Why not aim for other arbitrary goals like building a path of states that go from the Pacific to the Atlantic?
micah: That would be cool.
natesilver: You can do it with only 52 electoral votes!
clare.malone: All about that visual pop.
micah: :thumbsup:
clare.malone: Really cinch in the heartland.
micah: OK, so let’s take Clare’s more scaled-down strategy: Beyond the firewall, which state would you target?
clare.malone: Moi? I think Arizona and Georgia are the obvious ones to target this election — big minority communities in areas that are fairly concentrated that you could try to turn out. Just pour a lot of resources into GOTV in Maricopa County and Fulton County perhaps.
micah: That makes sense.
clare.malone: Plus, in Georgia’s case, the surrounding white, affluent Atlanta suburbs — Fayette County was one of the counties that we initially identified as a bellwether, which has swung much more Democratic since 2012.
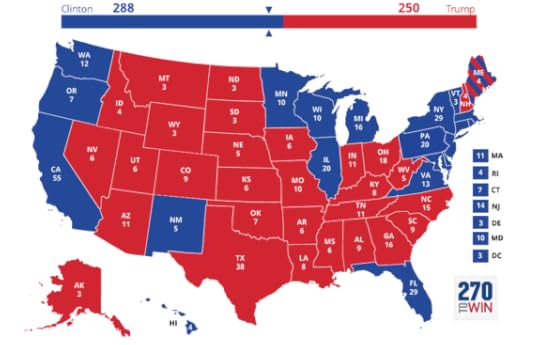
natesilver: Arizona is probably better than Georgia because its vote will be less correlated with the other Southern states. In other words, if Clinton wins Georgia, she’s almost certainly already won North Carolina and/or Florida, so it’s game over.
Whereas you could sort-of-kind-of imagine a Western surge/Midwestern collapse map that looks like this:
micah: Utah!
harry: We got a McMuffin sighting!
clare.malone: We are trolling for Utah clicks so hard these days. Trawling? I dunno.
harry: I did an interview with Utah NPR. They were very nice.
clare.malone: Of course they were.
micah: OK, so if we’re ranking Clinton’s “reach” states in terms of feasibility, seems like we’re going 1. Arizona, 2. Georgia … then what?
harry: Utah has got to be in there. Indiana, South Carolina and Missouri.
clare.malone: I’ll go with Missouri. Especially if she rides Kander coattails.
natesilver: A.L.A.S.K.A. I’m not sure why Alaska is close, and the polls there are kind of crap. But the polls there have it close.
harry: From A to U, a trip through Nate Silver’s swing state America.
natesilver: Clinton’s more likely to win Alaska than Utah, per our model.
harry: I’m betting against the model here.
micah: Blasphemy!
natesilver: You’d bet on Clinton winning Utah before Alaska? Or Trump losing Utah before Alaska? Because those aren’t the same thing.
clare.malone: That’s like an SAT word problem.
natesilver: I think our model might be underrating Evan McMullin’s chances in Utah, but probably not Clinton’s chances.
harry: OK, let’s play this game. I think the model has a lot of conflicting data coming in from Utah. And you know it’s much harder to poll a multi-candidate race. The recent polls from Utah have shown a very weird race, and “I have a feeling,” to quote the announcer who isn’t John Candy in “Rookie of the Year.”
micah: You have a feeling that what?
clare.malone: That Mitt Romney is going to win Utah out of left field. Write-in vote. Model didn’t see it coming.
harry: I have a feeling Utah is going to be a very close race. You have two polls in the past few weeks showing a tight three-way race. And when there is a three-way race, things can get WILD.
clare.malone: So much Utah talk. This chat is officially sponsored by Utah.
natesilver:

micah: Yeah, let’s leave Utah.
How about Texas?
harry: I’m very skeptical on Texas?
micah: Our model shows Trump up only 7 points in Kansas — closer than Utah and just a little more Trump-leaning than Texas.
harry: I think Trump will win Kansas and Texas, although the polls in Texas are getting close.
natesilver: Texas is probably a stretch this year. But there are universes where it becomes pretty important to Democrats in four, eight, 12 years.
clare.malone: Is the whole Texas aversion based on a political myth that’s been perpetuated, or is the Democratic ground operation really sparse as to inspire great doubt?
There was that group of Obama staffers a few years back that started some kind of “turn Texas blue” organization, but I feel like Wendy Davis’s failed gubernatorial bid in 2014 finished off a lot of hopes and dreams for a while on that front.
natesilver: Yeah, it’s a bit like New Jersey in terms of having been a tease for Republicans in the past.
But the combination of college-educated whites becoming more Democratic, with the growing Latino population, makes the state pretty interesting, based on the work we’ve done.
I’ll put it this way — if Texas becomes a red-leaning state instead of a solidly red state, it sort of becomes a problem in a way for Democrats. Because it has a huge number of votes, but it doesn’t help you in the Electoral College if you’re losing it by 3 points or 5 points. In that sense, it might be a good state to invest resources in to try to push it more to behaving like a true swing state.
harry: I’d actually point to Texas as a great example of how Republicans could do well even as the country continues to become more diverse. Yes, a lot of Latinos don’t vote in Texas, but look at how well Republicans have done among those who do. In the 2010 and 2014 exit polls (I know, I know, exit polls aren’t great at measuring minority groups), the Republican gubernatorial candidates got at least 38 percent of the Latino vote! That’s one of the secrets in Texas that explains why it stays red: Republicans don’t get crushed among Latinos.
clare.malone: George W. Bush always did pretty well with Latino voters in Texas, right? And he got a bigger proportion of the national Latino vote when he ran for president than any Republican had gotten previously.
harry: He did very well.
natesilver: But the move from a Bushian GOP to a Trumpian GOP could turn off a lot of those Texas Latino Republicans.
clare.malone: Oh yeah. That’s my whole analysis.
harry: It could partially explain why Texas is closer this year. (Trump’s poor numbers with college-educated whites also probably has something to do with it.)
micah: And what’s the deal with Kansas? Did Gov. Sam Brownback just ruin the GOP there?
natesilver: I think you mean … “What’s the matter with Kansas?”
clare.malone: I believe it’s “What’s the matter with Kansas.”
natesilver: AHAHAHA.
clare.malone: Jinx buy me a coke.
harry: I’m out. This chat has jumped the shark. (Side note: “Happy Days” went on for many seasons after that.)
natesilver: Kansas is actually a pretty well-educated state. And the local GOP is unpopular there.
harry: Yeah, and we saw how Republicans still kept all the statewide offices there in 2014.
natesilver: Yeah, and the polls sort of blew that race.
I think Clinton probably needs a 12-point win or something nationally for Kansas to be in play. There’s another concept here too, which is that some states are more uncertain than others despite not necessarily being closer.
We don’t have much polling in Kansas, so the model is less sure about it. There actually is quite a bit of decent polling in Texas, by contrast.
That’s also why, by the way, Minnesota keeps moving up in our tipping-point index. Nobody’s really been polling it for some reason.
micah: All right, so to put a bow on this: It seems like the consensus here is that Clinton should focus on her firewall states and maybe target one to two reach states? I’m the only one who thinks she should try to play everywhere?
clare.malone: You’re just a betting soul.
But, yes, three weeks out, in a wacky race, I think they can only afford to get so creative.
harry: I think the purpose is to win the damn election. Win it.
micah: The purpose of winning, though, is to enact policy. We’re three weeks out, and Clinton has a clear lead — they can afford to push the envelope. It might help on that policy front (though that’s a question we should dive into further: Do mandates matter?).
natesilver: It’s also a bit of a confidence trick. “Clinton playing in Arizona” is a good headline, especially if polls also show a close race there. So there’s some value in that. We also haven’t tapped into the question of diminishing marginal returns. Running your first ads in Texas might be more valuable than running your 1,000th ad in Pennsylvania, even if Texas is much less likely to be the tipping-point state. So there are some arguments.
Let’s keep in mind that when the race was tight in mid-September, the battleground state polls started to look really scary for Clinton. Colorado, in particular — a state they thought was in the bag — was polling as a tie in the public polls.
Maybe their private polling had them further ahead. But it should have been a wake-up call nonetheless.
harry: I hate wakeup calls. Just let me sleep.

October 17, 2016
Election Update: Clinton’s Big Lead Means A Steadier Forecast
A friend asked me the other day whether there’s anything preventing Hillary Clinton from rising further in our forecast, beyond what have generally been very good polls for her. Clinton’s chances are up a bit — she’s hit 88 percent in our polls-only forecast, up slightly from 86 percent on Friday and 83 percent a week ago. In the polls-plus forecast, Clinton’s chances are 85 percent, up from 80 percent a week earlier.
But there’s some truth to the notion that she’s encountering diminishing returns. And that’s for a simple reason: 88 percent and 85 percent are already fairly high probabilities. Our model is going to be stingy about assigning those last 10 or 15 percentage points of probability to Clinton as she moves from the steep, middle part of the probability distribution to the flatter part.
Before this turns into too much of a math lesson, a quick review of Monday’s polls. As has often been the case in recent days, they were a mix of catastrophic-seeming results for Trump, mixed in with others that showed a race that remains competitive.
On the not-so-bad side for Trump were a set of polls from CNN that showed him leading by 4 percentage points in Ohio, and trailing Clinton by 2 points in Nevada and 1 point in North Carolina. These polls weren’t great for Trump: None of these are must-win states for Clinton and she was winning two out of three of them despite that. Also, CNN’s polls have been somewhat Republican-leaning this year relative to the polling average. But CNN’s results were consistent with a race in which Trump is trailing by perhaps 3 to 4 points nationally and is still within striking distance.
By contrast, a trio of new national polls were fairly awful for Trump, with Monmouth University showing him trailing Clinton by 12 percentage points, CBS News putting him down by 9 points, and George Washington University — whose polls have historically been Republican-leaning — having him 8 points back. As I wrote earlier today, there were also new polls in Utah (yes, Utah) showing a competitive three-way race between Trump, Clinton and independent Evan McMullin. And another poll this afternoon showed Clinton with a narrow lead in Arizona.
Overall, the results are most consistent with a race in which Clinton leads by about 7 percentage points nationally. States in the Midwest and the Northeast for the most part look as they did in 2012, when President Obama beat Mitt Romney by just under 4 points nationally. But, in the West and in the South, where demographic shifts are unfavorable for Trump, Clinton is poised to have the best Democratic performance since at least 1996, if the polls are correct.
And Clinton is possibly still gaining on Trump. Some of Trump’s worst results came in the most recent polls; Monmouth’s national poll, for instance, was conducted Friday through Sunday, while the CNN state polls went into the field last Monday, before a number of women came forward to accuse Trump of sexual assault.
But even if Clinton continues to gain ground on Trump, her probability of winning the election won’t increase all that much. Below is a chart depicting Clinton’s lead in the popular vote and her probability of winning the popular vote on Nov. 8, according to our polls-only model:
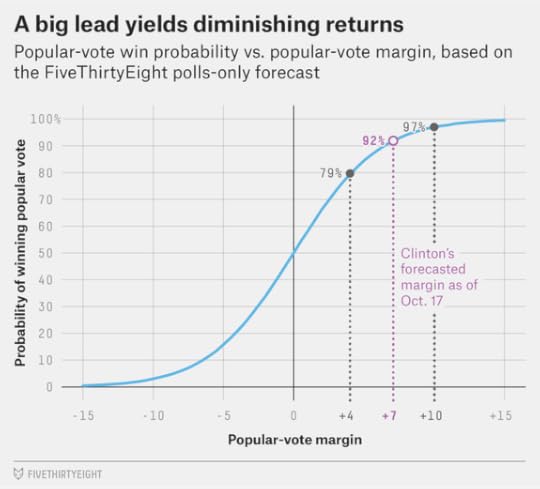
Given the uncertainty in the forecast, a 1-percentage-point lead for Clinton — about where she was at her lowest moments in mid-September — translates into only a 58 percent chance of winning the popular vote. After the first debate, Clinton emerged with a lead of about 4 points, giving her a 79 percent popular-vote win probability — a huge difference. Moving from a 4-point lead to the 7-point lead has also had a noticeable effect, with Clinton’s chances of winning the popular vote moving up to 92 percent.
But she’s now begun to reach the point of diminishing returns. Gaining another 3 points on Trump, to bring her to 10-point lead, would improve her chances of winning the popular vote to “only” 97 percent, for instance.
There are some other complications, of course. The Electoral College adds complexity to the outcome as compared with the popular vote. Also, the width of the probability distribution narrows as the election approaches, so Clinton will gain a little bit of ground each day just by holding steady as time runs off of Trump’s clock. And the distributions are sensitive to the number of undecided voters — more undecideds mean more uncertainty. Clinton currently leads Trump by a margin of about 46 percent to 39 percent in national polls. If each candidate were to gain 4 points, so that Clinton led Trump 50 to 43, our model would become yet more confident in her chances. So be on the lookout for national polls and polls of key swing states that show Clinton in the high 40s, or even above 50 percent. She’ll need more of those for her win probability to cross the 90 percent threshold.
As an aside, FiveThirtyEight’s forecast models use a t-distribution rather than the more common normal distribution. The t-distribution has wider and fatter tails and is appropriate in cases like presidential elections where you have smaller sample sizes. Since our model is trained based on only 11 elections (1972 through 2012), we can’t say all that confidently what the chance might be of, say, a 10-percentage-point polling error. The t-distribution makes more conservative assumptions about this than the normal distribution does. If Trump wins the election despite trailing by 10 points, do I think we’re going to get a lot of credit for having given him a 3 percent chance to do so, when everyone else had his chances at 0.3 percent or something instead? No, probably not — but we still think it’s the mathematically correct approach.
With Clinton having this large a lead, individual polls won’t swing the overall popular vote or Electoral College win probabilities quite as much, and so the model won’t be as jittery as it was a few weeks ago when the race was closer.

Nate Silver's Blog

- Nate Silver's profile
- 730 followers

