
Nate Silver's Blog, page 121
October 10, 2016
The Second Debate Probably Didn’t Help Trump, And He Needed Help
The second presidential debate on Sunday night was a strange one, with Donald Trump appearing to be on the brink of a meltdown in the first 20 to 30 minutes and then steadying himself the rest of the way. But here’s the bottom line: Based on post-debate polls, Hillary Clinton probably ended the night in a better place than she started it. And almost without question, she ended the weekend — counting the debate, the revelation on Friday of a 2005 tape in which Trump was recorded appearing to condone unwanted sexual contact against women, and the Republican reaction to the tape — in an improved position.
At times during the past two weeks, but particularly on Saturday afternoon as prominent Republicans were denouncing or unendorsing Trump one after another, it has seemed like Trump’s campaign is experiencing the political equivalent of a stock market crash. By that I mean: There’s some bad news that triggers the crash, and there’s also an element of panic and herd behavior, and it becomes hard to tell exactly which is which. At some point, the market usually finds its footing, as the stock has some fundamental value higher than zero. But it can be a long way down before it does.
At roughly the 20-minute mark of Sunday’s debate — about the point at which Trump said that he’d appoint a special prosecutor to investigate Clinton and that she’d “be in jail” if someone like him had been president — it seemed prudent to wonder whether Trump’s campaign was over. I don’t mean over in a literal sense (it would be almost impossible to replace Trump on the ballot). But over in the sense that we knew the outcome of the election for all intents and purposes, to a higher degree of confidence than FiveThirtyEight’s statistical models — which gave Clinton “only” about an 80 percent chance of winning heading into the debate — alone implied. (The polls — and therefore the models — have not yet had time to capture any effect from the Trump tape revelations.)
After all, the past two weeks have gone about as badly as possible for Trump. After having drawn the race to a fairly close position, Trump took one of the most lopsided defeats ever at the first debate in New York on Sept. 26. Then he engaged in a weeklong battle with a former Miss Universe, Alicia Machado, which the Clinton campaign gleefully egged on. Then the story broke that Trump had claimed losses of more than $900 million in 1995 and perhaps had not paid federal income taxes for 18 years.
But wait, there’s more! After a relatively effective vice presidential debate for Mike Pence earlier in the week — although it didn’t appear to have helped Trump in the polling — The Washington Post dropped its story about the tape Friday afternoon. By Saturday, Republican defections were getting bad enough that Trump was fending off rumors that Pence would quit the race. And then Trump began his Sunday evening at a makeshift press conference that featured three women who have accused Bill Clinton of sexual harassment or sexual assault and a fourth woman who was raped by a man Hillary Clinton represented at trial in 1975. The Bill Clinton sex story might be of interest to Drudge Report readers and parts of Trump’s base, but most Americans are tired of hearing about it, at least in an election in which Bill Clinton isn’t running for office. And then in the first 20 minutes of the debate, Trump brought up the Bill Clinton accusations again and threatened to imprison Hillary Clinton, without showing any of the contrition that Republican leaders were calling for.
But Trump made it through the rest of the debate with a relatively good performance — or at least, so I thought. He was oftentimes meandering but fairly measured, and he was effective at pressing Clinton on Obamacare and her email server, for instance. The key term, however, is “relatively.” I’ve covered enough debates to know that other than in the really obvious cases, it can be hard to judge how voters will perceive a performance. So you grasp on to what you can find: prediction markets, which began to show Trump rebounding about halfway through the debate; real-time reaction from focus groups; and the sentiment of other journalists.
This inevitably introduces the possibility of groupthink and various other biases, such as judging a candidate’s performance relative “to expectations” (i.e., relative to the media’s expectations, not the voters’ expectations) instead of in any absolute sense. Once expectations were lowered to the point that we in the media were speculating about whether Trump’s own running mate might drop out, any half-decent performance was bound to look good.
It’s not clear that voters judge debates in the same way, however. A CNN poll of debate watchers found that even though most voters thought Trump exceeded expectations, 57 percent of them nevertheless declared Clinton the winner, compared with 34 percent for Trump. A YouGov poll of debate watchers showed a much closer outcome, but with Clinton also winning, 47 percent to 42 percent.
These instant-reaction polls actually do have a correlation with post-debate horse-race polls: The candidate who wins the former usually gains in the latter. Perhaps Clinton’s win was modest enough that this will be an exception, especially given that the sentiments of pundits and television commentators (which sometimes matter as much as the debate itself) were all over the map.
So suppose that we call the debate a draw. Suppose, furthermore that the tape the Post published didn’t damage Trump. Instead, let’s say the polls look about the same a week from now as they do today, with Clinton holding a 5 or 6 percentage point lead. Maybe Clinton’s numbers were a little inflated after the first debate and Trump has even gained a point or two, somehow.
That’s still a fairly awful position for Trump with time running out, undecided voters getting off the sidelines, early voting already taking place in many states and little or no ground game to help provide a strong finishing kick. There’s the third debate, but without an extremely strong performance in that one, Trump is probably left hoping for an “October surprise” or a big polling error (not impossible, but it would have to be larger than the 4-point margin by which Brexit polls missed).
Or, obviously, things could get worse for Trump. And some “October surprises” — such as further leaks of tax returns or embarrassing comments caught on tape — could work against him. (They also wouldn’t be that surprising.) His attempt to make an issue of Bill Clinton’s past, which his campaign seems determined to pursue, could also backfire.
In the end, your assessment of Trump’s chances comes down to the same consideration as with a falling stock: How sound are the fundamentals? Is Trump the equivalent of a beleaguered blue-chip that still has lots of hard assets? In Trump’s case, the most valuable asset is probably possession of the Republican Party ballot line, which theoretically ought to be worth something given the circumstances of the race. Or was the whole business a sort of confidence trick, which was bound to implode once people began to lose faith in it?
VIDEO: Did Trump get back on track in the second debate?


October 9, 2016
A Late-Night Podcast To Recap A Very Strange Second Debate
After the second debate between Hillary Clinton and Donald Trump, the FiveThirtyEight Elections podcast crew gathered in our offices to talk about what went down and what to make of this moment in American politics. For more, check out our live blog from the debate. And here’s video of our podcast taping:
We have a live show in New York City on Oct. 24. Tickets are still available here.
You can listen to the episode by clicking the “play” button above or by downloading it in iTunes, the ESPN App or your favorite podcast platform. If you are new to podcasts, learn how to listen.
The FiveThirtyEight Elections podcast publishes Monday evenings, with occasional special episodes throughout the week. Help new listeners discover the show by leaving us a rating and review on iTunes. Have a comment, question or suggestion for “good polling vs. bad polling”? Get in touch by email, on Twitter or in the comments.

A Late Night Podcast To Recap A Very Strange Second Debate
After the second debate between Hillary Clinton and Donald Trump, the elections podcast crew gathered in the FiveThirtyEight offices to talk about what went down and what to make of this moment in American politics. For more, check out the live blog we ran during the debate. And here’s video of our podcast taping:
We have a live show in New York City on Oct 24. Tickets are still available here.
You can listen to the episode by clicking the “play” button above or by downloading it in iTunes, the ESPN App or your favorite podcast platform. If you are new to podcasts, learn how to listen.
The FiveThirtyEight Elections podcast publishes Monday evenings, with occasional special episodes throughout the week. Help new listeners discover the show by leaving us a rating and review on iTunes. Have a comment, question or suggestion for “good polling vs. bad polling"? Get in touch by email, on Twitter or in the comments.
October 8, 2016
The Bottom Could Fall Out For Trump
Let’s not naively insist on taking a wait-and-see approach regarding the events of the past 24 hours. The revelation of a tape from 2005 in which Donald Trump was caught making a number of lewd comments about women, and seemed to condone unwanted sexual contact toward women, is bad news for Trump. (#Analysis.) It’s not going to help Trump to become president in a country in which 53 percent of voters are women.
The story has broken through the news cycle in a big way. Since Friday afternoon, Google searches for Trump are somewhere around four times as high as their already-insanely-high levels — in line with the sort of spike that usually occurs around a debate.
But if we knew on Friday night that this would be a big story, it’s become an even bigger story throughout the day today (Saturday) as dozens of GOP elected officials have either repudiated Trump, or unendorsed him, or called for him to resign his position at the top of the ticket. Trump had unusually low levels of support from these “party elites” to begin with, but we’d usually seen only a few prominent Republicans repudiate him at a time after past controversies. Now, the floodgates have opened, and the whole party is fleeing him. We’ve never seen anything like this in a modern American election campaign. Republicans in 1996 may have given up on Bob Dole to concentrate on saving the Congress, but they weren’t calling for Dole to drop out 30 days before the election.
My view of this general election — both how the FiveThirtyEight forecast models see the race and how I see it personally — is that it’s characterized by high volatility and high uncertainty. Those two things go together, although they’re not quite the same.
By volatility, I mean that the polls have been relatively responsive to news events. At various occasions, Hillary Clinton has been ahead by as few as 1 or 2 percentage points over Trump, or by as much as 8 to 10 points. The fluctuations are a lot larger than what we saw in 2012:
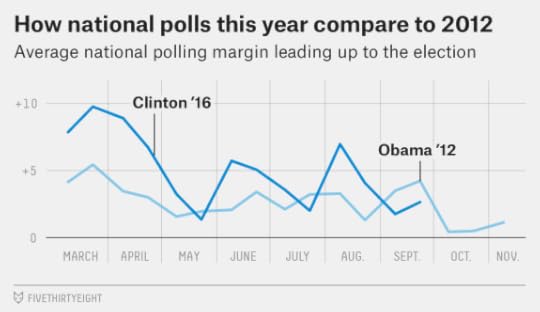
Importantly these fluctuations are not “noise,” in any meaningful sense of that term. They’re real. They’re evident in dozens or hundreds of polls. They correspond to important news events and reflect voters either changing their minds or their enthusiasm to vote. They’re also not that unusual. The volatility in the polls in 2016 is pretty average by historical standards, in fact.
But this is not a relatively newsless campaign like 2012, which was full of overhyped “game changers” that didn’t move the polls. Instead, there’s been a lot of news in 2016 — almost too much to comprehend or consume at once. That can make it hard for stories to metastasize. But when a story has broken through to dominate the news cycle, it usually has moved the polls in the direction that people expected. Trump’s feuds with Judge Gonzalo Curiel and the family of the American soldier Humayun Khan corresponded with periods when he declined in the polls. The first debate has turned into a disaster for Trump in a way that was fairly predictable based on instant-reaction polls. Trump’s convention was a mess, whereas Clinton’s was conventionally effective, and she got a much larger convention bounce. However, Clinton was hurt by her email scandal resurfacing as a major storyline in July. And she declined in the polls after her “basket of deplorables” comments and Sept. 11 health scare.
So, to a first approximation, we’d expect the Trump tape to hurt him in the polls, particularly in light of the many GOP officials abandoning him.
Many of those Republican defections are strategic rather than sincere, of course. If the news had broken when Trump was 5 or 6 percentage points ahead of Clinton instead of 5 or 6 points behind her, we probably wouldn’t see quite so coordinated and forceful a reaction. But the timing of this is just about as bad as possible for Trump. Even before the “hot mic” tape, there were reports that GOP elected officials might abandon Trump if he had a poor second debate. That makes sense, given that the Senate is still close to a toss-up and hasn’t made a definitive break in either direction. With one month left until the election, there’s perhaps just enough time for vulnerable Republican candidates to convince themselves that they’re better off abandoning Trump than sticking by him.
Furthermore, the story comes in advance of the second presidential debate on Sunday and is likely to color both the substance of the debate and the reaction to it. And especially given that Trump had reportedly done little debate prep to begin with, it could lead to him going into the event off-balance. Maybe the debate will turn out OK for Trump. He’s certainly done a good job of — and I throw up a little bit in my mouth every time I use this phrase — lowering expectations. But given his perilous position in the polls, an OK debate wouldn’t be enough for Trump. He needs at least a good debate, and maybe a very good debate, since it represents one of his last and best opportunities to turn the race around.
Now for the uncertainty part. As I said above, “this will probably hurt Trump” is a much better prior than “we don’t know what effect this will have.” But for now, I’m only willing to make a prediction about the direction (bad for Trump) — we’ll wait for the polls to measure the magnitude.
Perhaps the most relevant piece of context, however, is that Trump was extremely unpopular to begin with. In our national polling average, he’s varied between having 36 percent of the vote and 41 percent and was at about 40 percent heading into the weekend. That’s awfully low for our modern, highly partisan era, in which all major-party nominees since 2000 have received at least 46 percent of the vote. Clinton isn’t doing great either, but at about 45 percent in national polls, she’s closer to the normal range.
True, both candidates also figure to pick up some undecided or third-party support and finish higher than their current raw numbers — but put a pin in that thought for a moment.
On the one hand, the fact that Trump’s support was so low to begin with could presumably mitigate the damage to him. If you’re only getting 40 percent of the vote, the voters you do have are probably pretty committed to you — and Trump has some passionate supporters.
On the other hand, the fact that Trump has only 40 percent of the vote means that the downside for him is awfully far down. What if he doesn’t win over any undecideds, and 40 percent turns out to be more of a ceiling than a floor? Trump’s unfavorable rating was approaching 60 percent even before the “hot mic” tape surfaced, which means he was already running into a headwind in terms of picking up additional support. Furthermore, he’s targeted a narrow slice of the electorate instead of a majority coalition. He doesn’t have much of a ground game to turn out his marginal voters, and, especially if he’s losing in the polls, they could decide that it just isn’t worth the time to vote.
If Trump gets stuck at 40 percent of the vote, you could wind up with an outcome like Clinton 51 percent, Trump 40 percent, Gary Johnson 7 percent, Jill Stein and others 2 percent, or something of that nature. That is, a double-digit win for Clinton, which could potentially yield somewhere around 400 votes for her in the Electoral College, and make states as exotic as Texas and Alaska competitive.
That outcome might seem far-fetched. But in an election with high uncertainty, it shouldn’t be. Even before the “hot mic” tape, our model gave Clinton a 5 to 6 percentage point lead, and the error in the forecast is roughly symmetric. The polls could move by 5 or 6 points toward Trump, giving him a narrow win, or — equally likely, per our model — they could move by 5 or 6 points toward Clinton, giving her a double-digit margin. To put it another way, a Clinton landslide is no more far-fetched than a Trump victory — and given the events of the past 24 hours, probably less so.

Our Live Elections Podcast Reacts To Donald Trump’s Lewd Comments
Hours before our planned live podcast taping in Chicago on Friday, The Washington Post unearthed a 2005 tape of Donald Trump making lewd and sexist comments on the set of a soap opera. Our podcast crew reacted to the revelations in real time, discussing what the comments say about Donald Trump and what effect the recording may have on the race. Plus, we previewed the second presidential debate, on Sunday night, and how undecided voters will decide between Trump and Hillary Clinton over the coming month.

Join us Sunday night as we live blog the debate, and record a reaction podcast (with live video!) after it’s over.
We have one more live show, in New York City, on October 24th. Tickets are available here.
Below is a partial transcript of the conversation. It has been lightly edited for clarity.
Clare: Someone asked me “why is this more repugnant than any other thing he said.” And I guess it’s not on the sliding scale of racism, but I think there’s something about the personal [nature] of the violence that he’s using in his words… he’s talking about something that he would do to a woman.
Jody: I want to talk about the political fallout, but let’s attend to the awfulness of these comments first. Nate, does this feel like we should be saying “of course he’s this way, we’ve known this [about him]” or is this somehow at another level?
Nate: I mean, on the one hand I’m not surprised that Donald Trump said these things. But they are awful things to say. It’s repugnant. And a lot of things he’s said and done are repugnant. It’s pretty rare that you have one person who embodies so many of these repugnant characteristics. And that he’s one of the two major party nominees for president.
Harry: It’s not the language that he uses that I find so offensive, it’s the actions which he is describing. He is basically saying that it’s OK to sexually assault somebody. That’s not OK.
Also, although I may sound like it at times, I am not of Donald Trump’s age. But my father was. And my father, at times, I would say, was not a creepy old man, but a… sexy senior citizen. But I never once heard anything remotely close to these comments [from him]. Not once. And I think we’d be giving Trump a pass if we said that “men of a certain era” speak this way. If you’re a decent human being, it’s not something that you say.
Jody: And the fact that we have to say this at this point [in the election] is what’s baffling to me. So, to that point, [on the politics], Nate — where was all this stuff throughout the Republican primary?
Nate: This is one of the great mysteries. Obviously a lot of people, including us, were surprised that Trump had so much staying power. But it wasn’t like it happened all at once. He rose in the primaries in June and July [2015], you had reason to be skeptical until November or December… and this thing lasted until May. And it’s shocking how few real bombshells there were… that really dropped on him. It’s really hard to explain. But he’s a guy who hit .300 in AAA, and now he’s in the big leagues and he’s whiffing.
You can listen to the episode by clicking the “play” button above or by downloading it in iTunes, the ESPN App or your favorite podcast platform. If you are new to podcasts, learn how to listen.
The FiveThirtyEight Elections podcast publishes Monday evenings, with occasional special episodes throughout the week. Help new listeners discover the show by leaving us a rating and review on iTunes. Have a comment, question or suggestion for “good polling vs. bad polling"? Get in touch by email, on Twitter or in the comments.

October 7, 2016
Election Update: Are Trump’s Polls Getting Worse?
Donald Trump had drawn to within 1 or 2 percentage points of Hillary Clinton in the popular vote and into a near-tie in the Electoral College before last Monday’s presidential debate. But the debate almost immediately moved the polls in Clinton’s favor, putting her in a much more comfortable position. Now the question is whether Trump’s problems have grown worse since then.
As far as FiveThirtyEight’s forecast models are concerned, the answer is a pretty clear “yes.” In our polls-only model, Clinton’s chances were 55 percent before the debate and increased to 72 percent as of this Monday. But her odds have also grown significantly over the course of this week, to 80 percent now, which corresponds to a lead of 5 or 6 percentage point in the popular vote. Our polls-plus model has followed a similar but slightly more conservative trajectory, with Clinton’s probability increasing from 55 percent before the debate, to 68 percent on Monday, to 76 percent now.
The polls do not yet account for any fallout from the Washington Post’s explosive disclosure on Friday of a tape from 2005 in which Trump made a variety of lascivious comments about women, including bragging about being able to get away with groping women because he was “a star.”
Somewhat contrary to its reputation for being hyper-aggressive, even the polls-only model can sometimes take a few extra days to fully account for shifts in the race. So in circumstances like these, it can sometimes be useful to look at the FiveThirtyEight now-cast, which incorporates new polls very quickly at the cost of potentially picking up on noise and overshooting the mark. In fact, Clinton’s lead also continued to rise in the now-cast over the course of the week (although it shifted very slightly downward on Friday itself), and her popular-vote lead in the now-cast (6.1 percentage points) remains larger than in the polls-only model (5.3 percentage points). So if there’s been any reversal back toward Trump, it hasn’t really shown up in the polls yet, at least not on a consistent basis.

Sure, if you’re a Trump fan, you can find a few data points that look a little better for you. The latest Fox News national poll shows Clinton’s lead at only 2 points, for example, down from a 3-point lead just after the debate. A Suffolk poll of New Hampshire showed Trump’s deficit at only 2 points there. The perpetually Republican-leaning USC Dornsife/Los Angeles Times tracking poll continues to show Trump ahead. But this is not where the consensus of the evidence lies, and even Trump’s best polls aren’t all that good. In the two weeks before the debate, by contrast, about half of swing state polls showed Trump tied or ahead.
Therefore, our best guess is that news events since the debate, such as the reporting of leaked tax returns that showed Trump reporting a $916 million loss in 1995, have also hurt Trump. His taped remarks about women could too, of course, once the polls have time to reflect them.
We expect to see some further, high-quality polling come in over the weekend, in advance of Sunday night’s second presidential debate. So we’ll save our next big overview of the race for then. But Trump has dug a pretty big hole for himself, and he will probably enter Sunday night in a position where the debate alone will not be enough to undo all the damage.

October 5, 2016
Election Update: Maybe It’s Time For Ohio And Pennsylvania To Part Ways
Want these election updates emailed to you right when they’re published? Sign up here.
Hillary Clinton leads Donald Trump by 2 percentage points in Ohio, according to a new Monmouth University poll there. Not long ago, that would have qualified as a minor miracle for Clinton, who had trailed Trump by as much as 5 points in Ohio in a series of polls conducted in mid-September. But with her national position having improved considerably since the presidential debate, it’s not surprising. (Although, some people had already put Ohio firmly in Trump’s column.)
On the one hand, the poll shows yet another lead for Clinton in a swing state. She’s been ahead in all but one of 26 swing-state polls conducted since the debate — Quinnipiac’s poll of Ohio was the exception. The polls tell a largely consistent story: Clinton appears to lead by 4 to 5 percentage points nationally. (Clinton is a 76 percent favorite to win the Electoral College in our polls-only model and a 72 percent favorite in polls-plus, largely unchanged from Tuesday.) Furthermore, the lead comes in a state that Clinton doesn’t really need to win, but Trump very much does. Ohio isn’t part of Clinton’s easiest path to 270 electoral votes, nor is it one of her next-best alternatives, which include North Carolina and Florida. At times, Clinton has even seemed to treat Ohio as a third-tier option, campaigning there only enough to keep Trump on his toes. (Clinton visited Akron, Ohio, this week, her first stop in the state since Labor Day.)
On the other hand, the trend line in the Monmouth poll was negative for Clinton — she’d led by 4 percentage points in Monmouth’s August poll of Ohio. And it didn’t show her with much of a lead as compared to the strong numbers Monmouth has had for Clinton in other states. In particular, a Monmouth poll earlier this week put Clinton ahead by 10 points in Pennsylvania, making for an 8-point spread between Pennsylvania and Ohio. Quinnipiac showed a similarly wide 9-point spread in its recent polls, with Clinton up by 4 in Pennsylvania but down 5 in Ohio.
Is it really plausible that Ohio and Pennsylvania could be so far apart? Our polls-only forecast thinks the gaps states found by Monmouth and Quinnipiac is a little on the high side, and has Clinton up by about 5 points in Pennsylvania and roughly tied with Trump in Ohio, making for a 5-point spread.
But a gap in the mid-to-high single digits wouldn’t be all that unusual. As Kyle Kondik, the author of a recent book on Ohio’s electoral history, points out, Ohio has been 5 to 6 percentage points redder than Pennsylvania, on average, in elections since 1952. (Before 1952, Pennsylvania was Republican-leaning relative to the rest of the country; it voted for Herbert Hoover rather than Franklin D. Roosevelt in 1932, for example.) And the gap has varied in recent years. In 2000, there was almost an 8-point spread between the states, with Al Gore winning Pennsylvania by 4 points but losing Ohio by 4. Four years later, John Kerry actually did better in Ohio than he did nationwide.

The states also aren’t quite as demographically similar as you might think. I’ve often used Ohio and Pennsylvania as canonical examples of states that are correlated with one another, only with Ohio being slightly red-leaning and Pennsylvania being slightly blue-leaning. So I was surprised that our model’s analysis of demographic correlations doesn’t show Ohio and Pennsylvania to be all that much alike — no more so, really, than any two randomly-selected swing states.
What differences is the model seeing between Ohio and Pennsylvania? It makes these determinations by evaluating five sets of factors: race, religion, education, party identification and geographic region. For a deeper examination of what these factors look like on the ground, I’d recommend reading Kondik on Ohio or Brandon Finnigan on Pennsylvania. But we’ll do a high-level overview here.
OHIOPENNSYLVANIARaceWhite84%84%Black10%10%Hispanic2%3%Asian1%1%Other2%3%ReligionCatholic21%29%Mainline protestant16%17%Evangelical protestant35%27%MormonOther non-Christian27%26%Party identificationDemocratic35%41%Republican32%34%independent33%25%EducationCollege degree32%38%No college degree68%62%RegionCensus Bureau regionMidwestNortheastPolitical regionMidwestMidwest?Ohio vs. Pennsylvania: Tale of the political tapeSource: Cooperative Congressional Election Study, National and STate Exit Polls
Race: Pennsylvania and Ohio are highly similar along racial lines. There’s some dispute about exactly how white the American electorate is overall; the figures you see in the table above are principally based on the Cooperative Congressional Election Study, which shows a whiter electorate than other sources, such as exit polls. But by pretty much any measure, the share of white, non-Hispanic voters is higher in Ohio and Pennsylvania than in the country as a whole. And most of the minority voters in these states are black, rather than Hispanic or Asian.
Religion: After race, no category is more predictive of American voting behavior than religion. Pennsylvania and Ohio have some meaningful differences on that front, with Pennsylvania having substantially more Catholics but fewer evangelical Christians than Ohio.
Party identification: In Pennsylvania, voters specify a party when they register to vote, while in Ohio they do not. The data we use for the model is based on party identification rather than party registration. But this is nevertheless a reminder that Pennsylvania has a stronger tradition of partisanship — and particularly, Democratic partisanship — than Ohio does. Forty-one percent of voters in Pennsylvania identify as Democratic, 34 percent as Republican and just 25 percent as independent, according to our estimates. In Ohio, they’re about evenly divided between the three groups.
Education: This is becoming an increasingly important factor, as Trump is performing better than previous Republican candidates among white voters without a college degree but underperforming them among highly educated whites. We estimate that 38 percent of all voters in Pennsylvania have college degrees, which is close to the national average, as compared with 32 percent in Ohio, which puts it in the bottom quartile of states.
Geography: Our research has found that dividing the country into four major regions — Northeast, Midwest, South and West — performs surprisingly well as a strategy to understand changes in the vote as compared with more complex methods. But some states straddle the boundary between these regions, and Pennsylvania is one of these. The Census Bureau considers it to be part of the Northeast, and few people would disagree that Philadelphia and the Eastern third of the state belong there. But FiveThirtyEight’s quirky tradition has been to classify Pennsylvania as a Midwestern state politically, grouping it with other Rust Belt states like Ohio. Our model currently splits the difference between these, treating Pennsylvania as half Northeastern and half Midwestern. Ohio is fully Midwestern, by contrast.
This isn’t just a matter of semantics. The northeast corridor, with its various cultural and economic circumstances — high population density, high income inequality, high levels of cosmopolitanism — runs through Pennsylvania but not through Ohio. And Philadelphia, both the city proper and the metro area, is much more populous than any city in Ohio. This matters because Democrats are becoming an increasingly urban, coastal party. Thus, eastern Pennsylvania is becoming more Democratic while western Pennsylvania is becoming more Republican:

In Pennsylvania, these changes roughly offset each other. We currently project Clinton to win by 5.2 points there, similar to President Obama’s 5.4-point margin in 2012. But Ohio, like western Pennsylvania, is being pulled to the right with no northeast corridor to offset it. We have Clinton “winning” Ohio by just 0.3 points, less than Obama’s relatively solid, 3-point margin in 2012.
Whether we can extrapolate these trends into the future is hard to say. In the short run, they may also be mitigated or exacerbated by the campaigns’ strategies. Kerry’s campaign poured a lot of resources into Ohio, and it almost worked, whereas it’s possible to conceive of Clinton abandoning Ohio for other states like Pennsylvania and North Carolina if the race tightens again. But if Democrats continue to become more of a coastal, urban, cosmopolitan party, while Republicans become more Trumpian, Ohio will become redder and may shed its bellwether status before long.
CORRECTION (Oct. 6, 2:15 a.m.): An earlier version of this article incorrectly stated that John Kerry lost Pennsylvania in 2004. Kerry defeated George W. Bush there by 2.5 percentage points.

October 4, 2016
The Vice Presidential Debate Will Dominate One News Cycle, Max
The VP debate was a conventional affair between two conventional politicians — especially given what we’ve seen so far this election. After watching (and live blogging) the debate, our Elections podcast crew gathers to offer their late-night reactions. The team discusses the key moments, how Mike Pence tried to account for Donald Trump’s record, and whether this will have any effect on the polls. (It probably won’t,) Take a listen above, and be sure to visit the live blog for lots more analysis.
Reminder: We have a live show in New York City on Oct 24. Get your tickets now – they’re going fast!
You can listen to the episode by clicking the “play” button above or by downloading it in iTunes, the ESPN App or your favorite podcast platform. If you are new to podcasts, learn how to listen.
The FiveThirtyEight Elections podcast publishes Monday evenings, with occasional special episodes throughout the week. Help new listeners discover the show by leaving us a rating and review on iTunes. Have a comment, question or suggestion for “good polling vs. bad polling"? Get in touch by email, on Twitter or in the comments.

Election Update: North Carolina Is Becoming A Problem For Trump
Hillary Clinton continues to gain ground in our presidential forecast, as it becomes clearer that last week’s debate was a turning point in the race. In fact, the polls we added to our database on Tuesday may have been Donald Trump’s worst since the debate. They included surveys showing Clinton leading Trump by 9 percentage points and 10 points in Pennsylvania, by 6 points and 2 points in North Carolina, and by 3 points in Nevada.
These polls contribute to an impressive streak for Clinton, who has trailed in just one of 25 swing state polls conducted since the debate. Her chances of winning the election are up to 75 percent in our polls-only model, her best position since Aug. 30, and 71 percent in our polls-plus model. Those forecasts assume that Clinton currently leads Trump by slightly more than 4 percentage points nationally, which may be on the conservative side as Clinton’s lead has tended to grow as additional post-debate polls have been added to the model.
One particular area of concern for Trump is North Carolina, where the polls we added on Tuesday were the fourth and fifth since the debate to show Clinton ahead there. They also had favorable trend lines for Clinton, with SurveyUSA showing her with a 2-point lead rather than a 4-point deficit in their early August poll, and Elon University showing her up by 6, instead of down by 1 point in their mid-September poll.
North Carolina is not a state where you want to be trailing in the polls in October, hoping for a late comeback. That’s because it typically has high rates of early and absentee voting. In 2012, for example, about 60 percent of ballots in North Carolina were cast before Election Day. Absentee voting is already underway there, while in-person early voting begins on Oct. 20.
Our forecast models, which don’t make any specific assumptions about early voting, see North Carolina as being important for another reason. Namely, because of the state’s demographics, it acts as a potential hedge for Clinton in the event of a collapse in her support among white voters without college degrees, especially in the Midwest. That’s why our models show North Carolina as the fourth-most important state, ahead of more heralded ones such as Ohio and Colorado.
To back up for a moment, one of the most important features of a presidential forecast is how it handles correlations between states. Take a hypothetical example of an election between the candidates Kang and Kodos, in which Kang has 268 electoral votes locked up, Kodos has 263, and it all comes down to Rhode Island and Delaware. Kodos must win both Rhode Island and Delaware in order to be elected president. If Kodos’s chances are 50 percent in each state, then what are his chances overall?
The answer is … you can’t say yet, because I haven’t told you how Delaware and Rhode Island are correlated. There are three main possibilities:
If the vote in Rhode Island is completely independent from the vote in Delaware, Kodos needs to win the equivalent of two coin flips, and his chances are 25 percent.If they always vote together — as goes Rhode Island, so goes Delaware — Kodos will either win both states or lose both, and so his chances are 50 percent.And if they’re perfectly anticorrelated — Rhode Island hates Delaware’s guts, and always votes the opposite of Delaware just to prove the point — Kodos can’t win both states and his chances are zero.We’ve spent a lot of time exploring this question at FiveThirtyEight. And the empirical answer is closest to No. 2, with No. 1 being the runner-up. That is, the states are positively, but not perfectly, correlated with one another. This ought to be fairly intuitive. If on Nov. 8, you learn that Trump has won Wisconsin despite having been behind in the polls there, you should assume it’s more likely than not that Trump has beaten his polls elsewhere, but especially in states that are demographically similar to Wisconsin, such as Michigan and Minnesota.
That’s how FiveThirtyEight’s forecast models work. They assume that states are partly — in fact, mostly — correlated with one another. That’s part of the reason our electoral vote distributions look slightly clumpy, with groups of states varying together, and also have “fat tails,” which represent cases where there’s a massive polling miss and Clinton or Trump outperform their numbers almost everywhere:
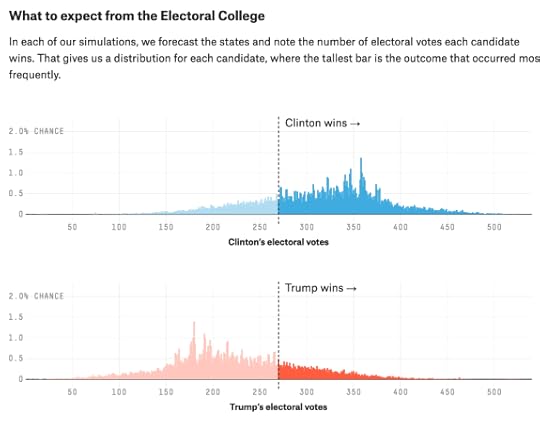
An important feature of this correlation is that it helps the trailing candidate’s chances. Say that by Election Day, Trump isn’t quite dead in the water, but Clinton has Pennsylvania, Colorado and most of her “firewall” states locked up. Trump has to win each of five remaining tossup states — New Hampshire, Florida, North Carolina, Nevada and Ohio — in order to become president, with 50 percent chances in each one.
This is just like the Kang and Kodos example. If you imagine these states as being five independent coin flips, Trump’s odds are really long — just 1 chance in 32 that all five coins come up heads for him. But if the coins are perfectly correlated with one another — maybe there’s some master coin that moves all five states together, and all he needs to do is for that one coin to come up heads — his odds are 1 in 2.
(Deep breath.) OK, back to North Carolina. As I just mentioned, correlation is a risk to Clinton because it allows Trump to win by the “master coin” scenario in which all of the swing states move in the same direction. So she would rather have a diverse group of swing states that are less correlated with one another and less likely to move together.
North Carolina serves that purpose, because it’s a little different than most of the other swing states. Its mix of voters — a combination of college-educated whites (and college students) in Charlotte and the Research Triangle, African-Americans, and often very conservative white evangelicals elsewhere in the state — is distinctive. All right, it fairly closely resembles Virginia and Georgia, although both are barely even swing states at the moment.. But it isn’t similar to Midwestern states such as Michigan and Wisconsin, which have a far higher proportion of white voters without a college degree. This is particularly true if you also consider religion: the noncollege whites in North Carolina tend to be evangelicals, whereas the Midwest has a lot of groups like middle-class white Catholics.
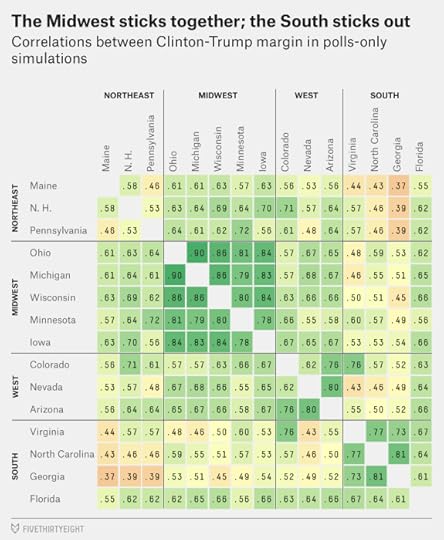
Our model needs to be more precise about this — so it infers the correlations between states by evaluating polls like this one that contain demographic information on more than 100,000 voters. Specifically, it evaluates religion, race, region, party and education; these are some of the major dividing lines in American presidential elections. The result is a correlation matrix that looks like this:
As you can see in the chart, the model assumes that all states’ outcomes are positively correlated. But some are much more correlated than others. In particular, the Midwestern swing states are liable to behave similarly to one another. There are other interesting correlations too — for example, Colorado and Virginia are highly correlated because of their education levels, while Arizona and Nevada are correlated based on their religious and racial makeup. But these don’t have much impact because those states don’t have as much electoral oomph as the five Midwestern states, which together have 60 electoral votes.
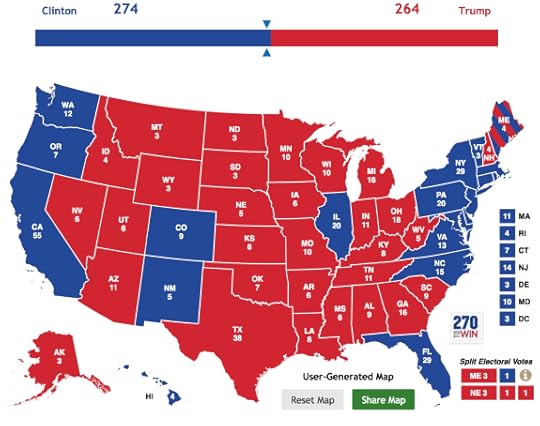
So say that Clinton winds up losing Michigan, for instance. If that happens, she probably can’t count on Ohio to save her, because Ohio is similar to Michigan but just a couple of points more Republican-leaning. It’s very unlikely that Clinton loses Michigan while winning Ohio, in fact. But it’s easy enough to imagine Clinton winning North Carolina while losing Michigan, resulting in maps like this one:
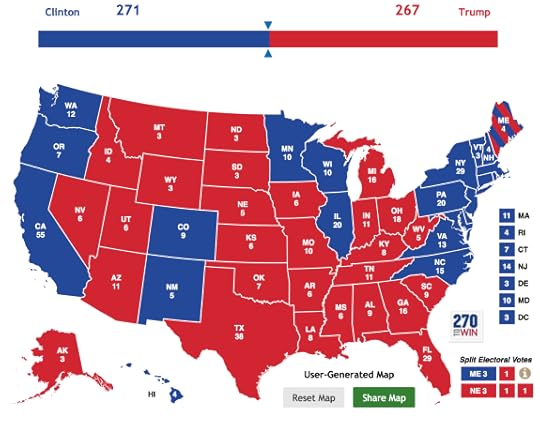
A more extreme case comes if Clinton wins both North Carolina and Florida. In that case, she could tolerate losing almost all of the Midwest, along with parts of the Northeast. Maps like these are probably a couple of election cycles away, but there’s some chance they could come into play this year:
It’s fun to consider which of these maps are plausible and which ones aren’t — and that’s basically what our model spends its time doing. The result of all those extra CPU cycles is that North Carolina turns out to be a bit more important than you might think — bad news for Trump given the recent polling there.

Election Update: North Carolina Is Becoming A Backstop For Clinton
Check out our live coverage of the Vice Presidential debate.
Hillary Clinton continues to gain ground in our presidential forecast, as it becomes clearer that last week’s debate was a turning point in the race. In fact, the polls we added to our database on Tuesday may have been Donald Trump’s worst since the debate. They included surveys showing Clinton leading Trump by 9 percentage points and 10 points in Pennsylvania, by 6 points and 2 points in North Carolina, and by 3 points in Nevada.
These polls contribute to an impressive streak for Clinton, who has trailed in just one of 25 swing state polls conducted since the debate. Her chances of winning the election are up to 75 percent in our polls-only model, her best position since Aug. 30, and 71 percent in our polls-plus model. Those forecasts assume that Clinton currently leads Trump by slightly more than 4 percentage points nationally, which may be on the conservative side as Clinton’s lead has tended to grow as additional post-debate polls have been added to the model.
One particular area of concern for Trump is North Carolina, where the polls we added on Tuesday were the fourth and fifth since the debate to show Clinton ahead there. They also had favorable trend lines for Clinton, with SurveyUSA showing her with a 2-point lead rather than a 4-point deficit in their early August poll, and Elon University showing her up by 6, instead of down by 1 point in their mid-September poll.
North Carolina is not a state where you want to be trailing in the polls in October, hoping for a late comeback. That’s because it typically has high rates of early and absentee voting. In 2012, for example, about 60 percent of ballots in North Carolina were cast before Election Day. Absentee voting is already underway there, while in-person early voting begins on Oct. 20.
Our forecast models, which don’t make any specific assumptions about early voting, see North Carolina as being important for another reason. Namely, because of the state’s demographics, it acts as a potential hedge for Clinton in the event of a collapse in her support among white voters without college degrees, especially in the Midwest. That’s why our models show North Carolina as the fourth-most important state, ahead of more heralded ones such as Ohio and Colorado.
To back up for a moment, one of the most important features of a presidential forecast is how it handles correlations between states. Take a hypothetical example of an election between the candidates Kang and Kodos, in which Kang has 268 electoral votes locked up, Kodos has 263, and it all comes down to Rhode Island and Delaware. Kodos must win both Rhode Island and Delaware in order to be elected president. If Kodos’s chances are 50 percent in each state, then what are his chances overall?
The answer is … you can’t say yet, because I haven’t told you how Delaware and Rhode Island are correlated. There are three main possibilities:
If the vote in Rhode Island is completely independent from the vote in Delaware, Kodos needs to win the equivalent of two coin flips, and his chances are 25 percent.If they always vote together — as goes Rhode Island, so goes Delaware — Kodos will either win both states or lose both, and so his chances are 50 percent.And if they’re perfectly anticorrelated — Rhode Island hates Delaware’s guts, and always votes the opposite of Delaware just to prove the point — Kodos can’t win both states and his chances are zero.We’ve spent a lot of time exploring this question at FiveThirtyEight. And the empirical answer is closest to No. 2, with No. 1 being the runner-up. That is, the states are positively, but not perfectly, correlated with one another. This ought to be fairly intuitive. If on Nov. 8, you learn that Trump has won Wisconsin despite having been behind in the polls there, you should assume it’s more likely than not that Trump has beaten his polls elsewhere, but especially in states that are demographically similar to Wisconsin, such as Michigan and Minnesota.
That’s how FiveThirtyEight’s forecast models work. They assume that states are partly — in fact, mostly — correlated with one another. That’s part of the reason our electoral vote distributions look slightly clumpy, with groups of states varying together, and also have “fat tails,” which represent cases where there’s a massive polling miss and Clinton or Trump outperform their numbers almost everywhere:
An important feature of this correlation is that it helps the trailing candidate’s chances. Say that by Election Day, Trump isn’t quite dead in the water, but Clinton has Pennsylvania, Colorado and most of her “firewall” states locked up. Trump has to win each of five remaining tossup states — New Hampshire, Florida, North Carolina, Nevada and Ohio — in order to become president, with 50 percent chances in each one.
This is just like the Kang and Kodos example. If you imagine these states as being five independent coin flips, Trump’s odds are really long — just 1 chance in 32 that all five coins come up heads for him. But if the coins are perfectly correlated with one another — maybe there’s some master coin that moves all five states together, and all he needs to do is for that one coin to come up heads — his odds are 1 in 2.
(Deep breath.) OK, back to North Carolina. As I just mentioned, correlation is a risk to Clinton because it allows Trump to win by the “master coin” scenario in which all of the swing states move in the same direction. So she would rather have a diverse group of swing states that are less correlated with one another and less likely to move together.
North Carolina serves that purpose, because it’s a little different than most of the other swing states. Its mix of voters — a combination of college-educated whites (and college students) in Charlotte and the Research Triangle, African-Americans, and often very conservative white evangelicals elsewhere in the state — is distinctive. All right, it fairly closely resembles Virginia and Georgia, although both are barely even swing states at the moment.. But it isn’t similar to Midwestern states such as Michigan and Wisconsin, which have a far higher proportion of white voters without a college degree. This is particularly true if you also consider religion: the noncollege whites in North Carolina tend to be evangelicals, whereas the Midwest has a lot of groups like middle-class white Catholics.
Our model needs to be more precise about this — so it infers the correlations between states by evaluating polls like this one that contain demographic information on more than 100,000 voters. Specifically, it evaluates religion, race, region, party and education; these are some of the major dividing lines in American presidential elections. The result is a correlation matrix that looks like this:
As you can see in the chart, the model assumes that all states’ outcomes are positively correlated. But some are much more correlated than others. In particular, the Midwestern swing states are liable to behave similarly to one another. There are other interesting correlations too — for example, Colorado and Virginia are highly correlated because of their education levels, while Arizona and Nevada are correlated based on their religious and racial makeup. But these don’t have much impact because those states don’t have as much electoral oomph as the five Midwestern states, which together have 60 electoral votes.
So say that Clinton winds up losing Michigan, for instance. If that happens, she probably can’t count on Ohio to save her, because Ohio is similar to Michigan but just a couple of points more Republican-leaning. It’s very unlikely that Clinton loses Michigan while winning Ohio, in fact. But it’s easy enough to imagine Clinton winning North Carolina while losing Michigan, resulting in maps like this one:
A more extreme case comes if Clinton wins both North Carolina and Florida. In that case, she could tolerate losing almost all of the Midwest, along with parts of the Northeast. Maps like these are probably a couple of election cycles away, but there’s some chance they could come into play this year:
It’s fun to consider which of these maps are plausible and which ones aren’t — and that’s basically what our model spends its time doing. The result of all those extra CPU cycles is that North Carolina turns out to be a bit more important than you might think — bad news for Trump given the recent polling there.
Nate Silver's Blog

- Nate Silver's profile
- 730 followers

