
Nate Silver's Blog, page 120
October 17, 2016
Voter Fraud Is Very Rare In American Elections
As Donald Trump has slumped in the polls, he has started to suggest that the election could be “rigged.” The FiveThirtyEight Elections podcast looks at how common voter fraud is in the United States and talks about the implications of Trump’s claims. The team also assesses what, if any, damage might come from WikiLeaks’ releases of Hillary Clinton campaign emails.
The podcast’s final live show before the election is on Oct. 24 in New York City.
Check back soon for a partial transcript of this week’s conversation.
You can listen to the episode by clicking the “play” button above or by downloading it in iTunes, the ESPN App or your favorite podcast platform. If you are new to podcasts, learn how to listen.
The FiveThirtyEight Elections podcast publishes Monday evenings, with occasional special episodes throughout the week. Help new listeners discover the show by leaving us a rating and review on iTunes. Have a comment, question or suggestion for “good polling vs. bad polling”? Get in touch by email, on Twitter or in the comments.


Here’s How We’re Forecasting The 4-Way Presidential Race In Utah
We’ve discovered that people are a little bit obsessed with the presidential race in Utah. An article that my colleague Benjamin Morris wrote last week about Evan McMullin, an independent candidate who is on the ballot there and competitive in recent polls, unexpectedly turned out to be one of the most popular features we’ve written this year at FiveThirtyEight. In this article, I’ll provide a more technical explanation of how our model is forecasting McMullin and why he has a relatively challenging path — and also, one important way in which our forecast might be underrating his chances.
This spring, I spent a lot of time analyzing third-party candidates and how their polls behave in presidential and U.S. Senate races. They’re tricky to forecast for a few reasons:
Polls tend to overstate the performance of third-party candidates early in the race — but not necessarily late in the race.Third-party candidates have asymmetric probability distributions — see, for example, the chart below for how our model forecasted Gary Johnson’s vote in New Mexico earlier this year. In our average simulation, Johnson’s projected vote share was about 10 percent of the vote. But that average was made up of a majority of cases in which he faded and received less than 10 percent, plus a handful where he broke out and won 25, 30, 35 percent of the vote or more.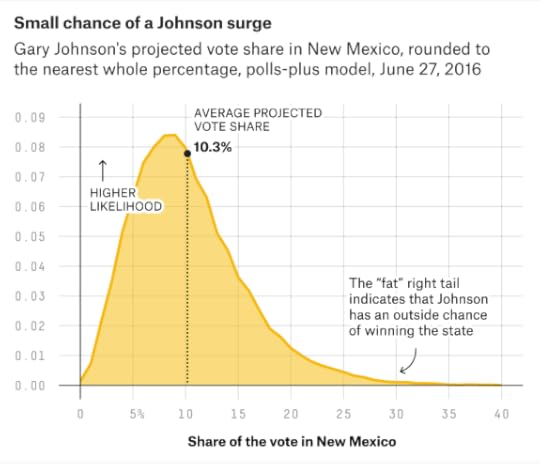 A third-party candidate’s polls can behave differently at different thresholds of the vote. A candidate polling in the low single digits — say, 2 or 3 percent — is often just a placeholder for “undecided” and their support can fade to close to zero by Election Day, especially in a competitive race. When a candidate is in the mid- to high single digits, conversely, or certainly in the double digits, their standing in polls is more likely to reflect genuine support.A more important threshold comes somewhere in the range of 25 percent of the vote. Third-party candidates above this range can plausibly win in a three- or four-way race, while candidates below it can only spoil the victory for someone else or serve as protest votes. That’s why you usually don’t see a lot of races with results like: the Republican 39 percent, the Democrat 37 percent, and the independent 24 percent. In a case like that, the independent wasn’t quite close enough to have a shot to win the race herself, but she also had enough support that her voters could easily have tipped the balance between the Democrat and the Republican.
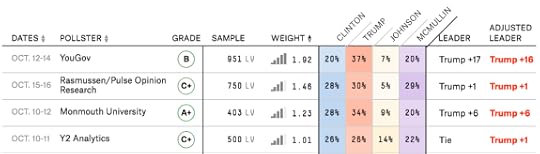
You’ll notice that McMullin, who has received between 20 and 29 percent of the vote in Utah in four recent polls, is close to the threshold I described above. That puts him on something of a precipice: He’s likely to either gain support or lose it instead of staying where he is right now.
What makes this tricky — and why the model probably underestimates McMullin’s chances — is that he’s a late arrival on the scene, having only qualified for the Utah ballot in August and having only started to attract significant attention recently. Typically in mid-October, if you saw an independent polling at 20-something percent, you’d assume he was on his way down after once having been more competitive. McMullin, however, has the potential to benefit from a feedback loop as more people hear about his candidacy and consider him to be a viable option. And it’s interesting that the most recent poll of the bunch, from Rasmussen Reports, gave McMullin his best number. Our model will respond aggressively if further polls find McMullin in the high 20s or low 30s instead of at 20 percent of the vote. You can already see some of the difference in that our now-cast, which weights recent polls more heavily and makes more sympathetic assumptions about third-party candidates, gives McMullin a considerably better chance than the polls-only and polls-plus models do.
McMullin presents some other modeling challenges. Unlike Johnson, who’s drawing support relatively evenly from the two major candidates (perhaps slightly more from Hillary Clinton, although that’s varied over time), McMullin is explicitly appealing to voters who would ordinarily vote Republican for president but who don’t like Donald Trump. Also unlike Johnson, who’s on the ballot everywhere, McMullin is only on the ballot in 11 states and is probably only a prospect to win in Utah, with its heavily Mormon population. (McMullin is Mormon, whereas Mormon voters have a lot of problems with Trump.) Idaho is another possibility, although its Mormon population is considerably smaller than Utah’s and there have been no recent polls there with McMullin on the ballot.
So here’s how we’re handling McMullin in our forecast:
We’re only forecasting McMullin in Utah for now. We’ll add additional states such as Idaho if and when McMullin becomes a factor in the polls there.In Utah, we’re only using polls that include McMullin — all other polls are weighted to zero.McMullin isn’t eligible for some of the fancier adjustments our model applies, such as the house effects adjustment, because there isn’t enough data to do anything all that complicated with him. However, the model puts more of a premium on recent polls when estimating McMullin’s vote, as a substitute for our regular trend line adjustment.Since third-party candidates are a significant contributor to polling error and polling volatility, the uncertainty in Utah is higher in the model because of McMullin’s presence.The model uses regression analysis — comparing how the other candidates’ vote shares vary with McMullin’s vote — to infer where McMullin is taking his votes from. Currently, it shows about 50 percent is coming from Trump, although with meaningful shares also from Clinton, Johnson and undecided.The model uses these correlations in its simulations. For instance, in simulations where McMullin does well, more of his gains come from Trump than from Clinton.As Morris mentioned, McMullin is eligible to be chosen president by the House of Representatives if he finishes in the top three in electoral votes (meaning that he wins Utah or some other state) and no candidate gets a majority of 270 electoral votes. Where these cases come up, the model gives McMullin the presidency 10 percent of the time. (The 10 percent figure is totally arbitrary, but it would be an unprecedented situation so I don’t know what better assumption to make.) While the polls-only model currently has McMullin winning Utah about 6 or 7 percent of the time, the overall parlay is rather unlikely and results in McMullin winning the presidency in only about 1 in every 5,000 simulations.Why isn’t McMullin’s probability higher? Well, for the time being he’s behind, at least based on the polling average. Polling geeks have focused on the Rasmussen Reports and Y2 Analytics poll that showed a close three-way race in Utah, but less on the YouGov and Monmouth polls that still had Trump ahead (way ahead in the case of YouGov’s poll). A simple average of the four recent polls yields a result of Trump 32 percent, Clinton 26 percent and McMullin 23 percent, putting McMullin within striking distance but also in third place with a 9-point deficit to make up in three weeks.
Another complication is that in cases where Trump is doing badly enough to lose Utah, he’s probably getting crushed by Clinton overall. Yes, the Mormon vote is especially important in Utah and is something of a unique factor. But there are also enough Mormons in Colorado, Nevada and Arizona to potentially swing the outcomes in those states. If Clinton’s winning Arizona — well, it’s probably a full-blown landslide and the election isn’t going to the House.
One could even argue that the whole Utah obsession is misplaced, given that various traditionally red states from Arizona to Alaska are more likely than Utah to end up in Clinton’s column, according to our model. Still, the mere fact that pollsters are thinking about Utah as a competitive state is remarkable. And I wouldn’t be surprised to see McMullin gain further ground in the next round of polling.

October 16, 2016
Election Update: Where The Race Stands With Three Weeks To Go
Breathe deeply. The election will be over in 23 days. Well, unless there’s a recount. Or unless one of the candidates refuses to accept the results of the election, provoking a Constitutional crisis and undermining the norms that have made the United States the world’s leading democracy for the past 240 years or so. Hey, how about those Cubs?
But seriously: Let’s try to gain some perspective by stepping back and asking our collection of 10 questions about where the election stands. (Previous editions of this exercise were conducted on July 15, Aug. 15, Sept. 6 and Sept. 25.)
1. Who’s ahead in the polls right now?Hillary Clinton has a significant lead, although there’s some question about the margin. For instance, one major national poll released on Sunday morning, from ABC News and the Washington Post, had Clinton ahead by 4 percentage points. Another, from NBC News and the Wall Street Journal, had Clinton up 11 points instead. Our forecast model falls in the middle and shows Clinton with a 6- or 7-point lead. That translates to an 86 percent chance for her to win the election according to our polls-only model, and an 83 percent chance per our polls-plus model.
2. What’s the degree of uncertainty?Let me approach this question in two ways. First, there’s uncertainty as our model attempts to define it. The most important factors in that calculation are the number of days until the election and the number of undecided and third-party voters. Obviously, we’re getting closer and closer to Election Day, with early voting already underway in many states. But the number of undecided voters remains fairly high (although it’s declined slightly). In national polls, about 85 percent of the vote is committed to Clinton or Trump, as compared with around 95 percent that was committed to President Obama and Mitt Romney at this point in the campaign four years ago. Those unpredictable undecided and third-party voters are why our models show both a better chance of a Trump victory than most of our competitors and a better chance of Clinton winning states like Texas.
And in a more qualitative sense: Well, this election is totally nuts, with Trump now implying that Clinton is on drugs and alleging that there’s an international conspiracy to rig the election against him. As my editor put it, everything is on the table in terms of how the final three weeks could go, ranging from Trump taking advantage of very low expectations before the third debate on Wednesday, to his giving up on the election to avoid taking responsibility for what will probably be an embarrassing defeat. Our model’s relatively cautious approach seems prudent under these conditions.
3. What’s the medium-term trend in the polls?By “medium-term trend,” I mean what’s been going on over the past few weeks in the polls. By short-term trend — see the next question — I mean what’s been happening in the past few days, which is usually harder to determine. The medium-term trend clearly favors Clinton. After polls in mid-September showed a very close race, with Trump trailing Clinton by only 1 to 2 percentage points nationally and almost catching up to her in the Electoral College, Clinton began to pull away following her performance in the first presidential debate on Sept. 26. And her lead has continued to grow from about 3 or 4 points just after the debate to more like 6 or 7 points now. The release of a video on Oct. 8, which showed Trump condoning sexual assault against women, has probably contributed to Trump’s increasing polling deficit.
4. What’s the short-term trend in the polls?There almost certainly hasn’t been a shift back toward Trump, but it’s hard to tell whether Clinton’s lead has stabilized or if she’s continuing to gain ground. That’s partly because the polls are having trouble keeping up with all the news. The recent NBC News/Wall Street Journal and ABC News/Washington Post polls, for instance, were conducted last Monday though Thursday, largely before a number of women came forward to accuse Trump of sexual assault.
5. Which states shape up as most important?The swing state map is broader than in 2012. Whereas by the end of that election, only a half-dozen states were really in doubt, there are 10 to 15 states that remain interesting this year. But Florida stands out according to our tipping-point index because winning it would all but clinch the election for Clinton. Without Florida or North Carolina in her column, conversely, Clinton would have to retreat to her “firewall” states, of which Pennsylvania, Colorado and New Hampshire are probably the most vulnerable
6. Does one candidate appear to have an overall edge in the Electoral College, relative to his or her position in the popular vote?Clinton’s been polling well across the board — in national polls, in swing state polls, in polls of red states and in polls of blue states — and the probability of a split between the Electoral College and the popular vote has been declining in our models. But if such a split were to occur, it would be more likely to favor Trump than Clinton, according to our forecast. That’s partly because Clinton has more to lose: When you’re the favorite, you want to avoid complications, and the Electoral College is a complication. For Trump to be competitive at this point, he’ll either have to make a last-minute comeback or the polls will have to be significantly off, and how that might play out in the swing states is somewhat unpredictable.
But, also, the gains Clinton has been making relative to Obama aren’t necessarily optimal for maximizing her Electoral College chances. She’s made states such as Texas and even Utah much more competitive, and one can even imagine their becoming swing states by 2024 or 2028. But for this year, Clinton will probably lose them, leading to a lot of wasted votes (statistically speaking).
7. How do the “ fundamentals ” look?The economy remains “meh” — that’s a technical term — with solid jobs reports but mixed figures otherwise. And an election between a generic Republican and a generic Democrat would probably be competitive. But as Trump runs an increasingly abnormal campaign and appeals to a narrow slice of the electorate, it’s becoming less likely that he can benefit from those relatively favorable conditions as a conventional Republican might.
One factor helping Clinton: Obama’s approval ratings are about as good as they’ve been all campaign. So while there are lots of undecided voters that don’t like either Clinton or Trump, they often have fairly warm views of the president, which might lead them to prefer Clinton’s continuity to Trump’s change.
8. How do FiveThirtyEight’s forecasts compare against prediction markets?Prediction markets put Trump’s chances at 15 percent, right in line with FiveThirtyEight’s forecasts. One could argue that this is too high, however, because betting markets should probably be pricing in some effect from the latest round of sexual assault accusations against Trump, whereas there hasn’t been enough time for the impact to really show up in the polls yet (and therefore in our forecasts).
9. What would keep me up late at night if I were Clinton?We’re getting to the point where a Clinton loss would require either an “October surprise” — maybe Wikileaks has something more damaging up its sleeve than what it’s shown so far, although even then it could be drowned out by all the news Trump is generating — or a significant polling error. On the prospects for a polling miss, let me state this carefully. It’s not that the arguments for why the polls could be underrating Trump’s support (e.g. the supposed presence of “shy Trump” voters) are all that strong. There are reasons to think the polls could be underrating Clinton’s support instead of Trump’s, in fact. But polls aren’t always as accurate as they were in the past few presidential elections, and given the large number of undecided voters, they could be off in either direction. A 6- or 7-point polling error is just on the outer fringe of what’s possible based on the historical record in U.S. elections.
With that said, it’s not the massive polling miss that would concern me if I were Clinton. Instead, I’d worry about what might happen if Trump was on a rising trajectory as Nov. 8 approaches, having cut my lead down to 3 or 4 percentage points, and then there was a more modest polling error on the order of what we saw in advance of Brexit, where the final polls were off by about 4 points. Polling errors of that magnitude are considerably more common than 6- or 7-point errors.
10. What would keep me up late at night if I were Trump?I’m not sure I can keep up the gag of pretending that Trump has some sort of rational inner monologue. So instead, I’ll think of this question as what would keep me up late at night if I were Kellyanne Conway, Trump’s campaign manager. And the answer is that the Trump campaign was never really set up to have a strong finishing kick. Trump has considerably less cash on hand than Clinton; he also has a much inferior ground game and is burning bridges with Republicans who could help him. And in the primaries, Trump consistently struggled with late-deciding voters, perhaps because he was such a polarizing candidate. So even if Trump catches a couple of breaks over the final weeks, he might not be poised to take advantage of them.

October 14, 2016
Election Update: Watch New Hampshire For Signs Of A Trump Comeback
Donald Trump hasn’t had a lot of good polling news lately. Very few swing-state polls have shown him with a lead since the first presidential debate, and those few leads have mostly been in states like Ohio and Iowa that aren’t part of Hillary Clinton’s path of least resistance to 270 electoral votes. To find good polls for Trump in states that could be part of Clinton’s firewall, you have to cherry-pick a bit — and you have to accept the fact that “good” in this context means trailing by a little instead of by a lot.
With that stipulated, some of Trump’s better numbers have come in New Hampshire. A MassINC poll released on Friday morning showed Trump trailing by only 3 percentage points there. And a Suffolk University poll last week — conducted before the release of the 2005 “Access Hollywood” videotape — had him down only 2 points in New Hampshire.
As I warned, that required a bit of cherry-picking. Several other polls of New Hampshire have been released since the first debate, and they have Clinton ahead by margins ranging from 6 to 11 percentage points — a safer margin than the MassINC or Suffolk polls show. New Hampshire is also one of the few swing states where Trump has spent more on advertising than Clinton — a deficit that the Clinton campaign could counteract if it feels as if the state is in jeopardy.
But as far as our model is concerned, the outcome in New Hampshire is more uncertain than in the other Clinton firewall states. Let me explain what I mean by that.
Trump’s chances of winning each state are determined both by how far ahead (or behind) Clinton is, and by how much uncertainty there is in the forecast. Compare Pennsylvania and New Hampshire, for example. Our polls-only model shows Trump as being ever-so-slightly closer to Clinton in Pennsylvania (where he trails her by 7.4 percentage points in our forecast) than in New Hampshire (7.6 points). But it gives Trump a somewhat higher chance of winning New Hampshire (17 percent) than Pennsylvania (11 percent).
STATEPROJECTED POP. VOTE MARGINTRUMP CHANCES OF WINNINGColoradoClinton +6.714.5%PennsylvaniaClinton +7.411.5New HampshireClinton +7.616.8MinnesotaClinton +7.812.1WisconsinClinton +7.911.2VirginiaClinton +8.29.2MichiganClinton +9.17.7Where can Trump break Clinton’s firewall?Data as of Oct. 14
Source: FiveThirtyEight polls-only forecast model
That’s because it assigns more uncertainty to the forecast in New Hampshire. In our model, uncertainty is determined by four major factors. First is the quantity — and quality — of polling in each state. In most swing states, there’s generally enough polling that this isn’t a major source of uncertainty, although some, like Iowa, Minnesota and Arizona, could use more data. There’s plenty of polling in New Hampshire, however, if not quite as much as in states like Pennsylvania or North Carolina.
The second factor is the disparity between polling and demographics in each state. Where these are misaligned — as in Nevada earlier in the year, where demographics and voting history implied that Clinton “should” have been ahead, but polls showed her trailing — there’s more uncertainty in the forecast. This isn’t really an issue in New Hampshire, however. Instead, the numbers are in pretty strong agreement there, as our adjusted polling average has Clinton ahead by 7.7 points, while our demographic forecast has her up 6.5 points.
But the third and fourth factors do contribute to uncertainty in New Hampshire. One of these is that New Hampshire is a small state; states with smaller populations have larger polling errors. Since 2000, for instance, the states with the largest average error in presidential polls, according to our pollster ratings database, are Hawaii, Delaware, Rhode Island, North Dakota, Wyoming, Alaska and Vermont, all of which have just three or four electoral votes. While there are some other factors to control for, the trend is pretty robust even once you account for them. I suspect it’s because smaller states have more homogenous demographics. In diverse states such as Pennsylvania or North Carolina, voting is fairly predictable along demographic lines, and pollsters can correct a lot of sampling problems by using demographic weighting. That’s less true in states such as New Hampshire, Hawaii or Utah, which are more demographically idiosyncratic. If you don’t do a good job of capturing the Mormon vote in Utah, for example, your poll or forecast is going to be way off.
The final factor is that New Hampshire is more “elastic” than other swing states. By elastic — the way I’m using the the term is borrowed from economics — I mean that it tends to swing more with the national trends. Specifically, New Hampshire has an elasticity score of 1.19, which means that for every point that the national polls move, we’d expect New Hampshire to move by 1.19 points in the same direction. Thus, if there’s a 5-point shift back toward Trump nationally, we’d expect New Hampshire to swing by slightly more than that, by around 6 points instead.
STATEELASTICITY SCORENew Hampshire1.19Maine1.15Colorado1.06Iowa1.06Minnesota1.05Wisconsin1.04Arizona1.02Michigan1.01Nevada1.00Ohio1.00Florida0.99Virginia0.97Pennsylvania0.96North Carolina0.93Georgia0.89Which swing states swing the most?These elasticity scores are calculated based on detailed assessments of each state’s demographics from the 2012 Cooperative Congressional Election Study and the 2008 exit poll. And they get at some of the same concepts that I mentioned above. In Pennsylvania or North Carolina — relatively inelastic swing states — voters are highly bifurcated along racial, religious and other demographic boundary lines. Pennsylvania and North Carolina happen to be swing states because the number of Democratic-leaning groups is roughly the same as the number of Republican-leaning groups in each one. But they don’t actually have all that many swing voters. They tend to be states where turning out your base is more important than persuasion.
In New Hampshire, by contrast, there really are a lot of swing voters. In particular, there are lots of middle-class and upper-middle-class white voters who aren’t highly religious and don’t belong to one of the major parties. Those voters are often torn in their presidential vote in this and in other elections.
So while Clinton would be highly likely to win New Hampshire in an election held today, the question is what happens if Trump makes some type of comeback. If he does, we’d expect New Hampshire to move more with the national tide, while Pennsylvania would be more resistant. But Trump could limit Clinton to a 269-269 Electoral College tie if he wins New Hampshire while losing the other Clinton firewall states, with the tie potentially to be broken by the 2nd Congressional Districts of Maine and Nebraska — or failing that, by the House of Representatives.
Sure, some of these scenarios can get obscure. If Clinton wins Florida or North Carolina — or loses Pennsylvania — New Hampshire’s four electoral votes will look measly in comparison. But according to our voter power index, New Hampshirites have the most influential votes in the country in both the presidential and the contest for control of the U.S. Senate.
Overall, Clinton’s chances of winning the election are 86 percent in our polls-only forecast and 82 percent in polls-plus, little changed from recent days.


Emergency Elections Podcast: What A Week
After a week in which multiple women accused Donald Trump of sexual assault, Trump and GOP bigwigs in Washington engaged in outright conflict, and the Republican nominee continued to talk about a “rigged” election, we convened the politics team for an emergency all-hands-on-deck podcast.
We’ll be back with a regularly scheduled show on Monday, and don’t forget about our live show in New York City on Oct. 24. Tickets are still available here.
Below is a partial transcript. It has been lightly edited for clarity.
Clare Malone: It was striking that there were so many stories [this week], though perhaps not surprising for 2016. As far as processing the stories goes, let me lay out a couple of numbers. A Morning Consult poll says that 74 percent of Republicans want party officials to continue to support their nominees. I got some SurveyMonkey data last night: 81 percent of Republican women and 84 percent of Republican men are still supporting Donald Trump. And that’s despite a lot of hand-wringing in the leadership of GOP.
I think that gets to something really interesting about not just the Republican Party but our society. I think it should be a jolt to American men, to be perfectly frank. There’s a thing going around on Twitter — #NotAllMen — and that’s fair. But a lot of Republican women that I’ve talked to and women being surrogates for Trump on TV say things like “I do believe that men talk about women in different ways privately that they would never talk publicly.” Women believe enough that this is within the realm of normal language, that this is not a disqualifying thing.
And I think that says something pretty bad about our society, and not just Republican women. When it comes down to it, if you’re a Republican woman supporting Trump you’re supporting him because ultimately you may have misgivings about him but you support your team. But the fact that this isn’t a disqualifying factor in our society is something that requires quite a bit of introspection.
Farai Chideya: I definitely think there’s two separate issues here. One is this national debate that’s emerged about this behavior. And the other is about Donald Trump as an ecosystem. He’s not really a candidate anymore, he’s an ecosystem with advisors, supporters, detractors…
But I would like to talk more… about the overall issue of assault — 23 percent of women have been touched sexually, in street harassment incidents and other incidents… This is just not that weird.
Jody Avirgan: Does this week help advance our conversation about that issue? Putting the election aside.
Chideya: I hope so. It’s really up to us.
Nate Silver: One theme of this election in general is that it might advance a lot of conversations but it also proves how far society has to go. And that’s putting it politely. I’m not sure what words to use, but there’s something profoundly evil about the Trump campaign at this point, and the people he attracts to it. And I think that’s the right word to use.
Farai Chideya: I disagree. I think that the concept of “inhuman” is one of the worst words in the world. Because everything humans do from genocide to altruism is human. And this is human behavior. To me the more that we can face that the better.
Nate Silver: I’m not saying it’s inhuman. I’m saying human beings have good and evil sides to them, and this is a guy who brings out the absolute worst in people.
You can listen to the episode by clicking the “play” button above or by downloading it in iTunes, the ESPN App or your favorite podcast platform. If you are new to podcasts, learn how to listen.
The FiveThirtyEight Elections podcast publishes Monday evenings, with occasional special episodes throughout the week. Help new listeners discover the show by leaving us a rating and review on iTunes. Have a comment, question or suggestion for “good polling vs. bad polling”? Get in touch by email, on Twitter or in the comments.

October 13, 2016
Trump Isn’t Teflon
A series of women have accused Donald Trump of sexually assaulting them. Trump has denied the claims. But given the number of accusers and the release of a tape last week that showed Trump bragging about actions similar to the ones the women described, the stories are likely to be a problem for his campaign.
We’re 26 days away from the election, so I wanted to advance a series of simple propositions about how the allegations might affect Trump’s prospects. If this stuff sounds familiar, it probably should, since it’s similar to the analysis I did after the release of the tape last week.
Proposition No. 1: Trump isn’t “Teflon.” Stories like these have hurt him. The conventional wisdom from the primaries — that Trump was unaffected by scandals or other negative storylines — hasn’t held up in the general election. Trump is the most unpopular presidential nominee of the modern era, and furthermore, downswings in his polling correlate well with specific incidents, such as his criticism of Judge Gonzalo Curiel and Khizr and Ghazala Khan. He’s also lost further ground to Hillary Clinton since the tape was released last week.
Proposition No. 2: These events may affect Trump’s “ceiling” more than his “floor.” At some point, though, one wonders how much lower Trump can go. He’s getting only 39 percent of the vote in national polls, a low figure for such a partisan era. Even if Trump gets embroiled in further scandals, each one may drive away fewer voters than the one before, as he’s already been involved in so many. And Trump’s response to the accusations — such lashing out at The New York Times and other media organizations that reported his accusers’ stories — could play well with his base.
But 39 percent of the vote won’t be enough for Trump to win the election or come anywhere close to it. At a minimum, he’ll need around 46 percent on Nov. 8, assuming that about 8 percent of the vote goes to third-party candidates. Where he’ll get those votes from is hard to say. Based on recent polls, I’d estimate that about 35 percent of Trump’s current voters are white men without a college degree, by far Trump’s best demographic group. But only around 10 percent of voters who don’t currently support Trump fall into that category. Trump will have to win over women, college-educated white men or people of color to win the election, and the events of the past week are unlikely to help him with any of those groups.
Proposition No. 3: It’s plausible that the effect on the polls could be temporary rather than permanent. There’s a complicated debate about whether election polls are essentially mean-reverting or instead resemble a random walk. In other words, if Trump goes from being (for instance) 5 percentage points behind to 7 points behind as a result of some news event, is he more likely than not to rebound to 5 points after a couple of weeks? Or is the 7-point deficit the new normal? There’s even a third possibility — that polls are momentum-driven, so that if a candidate loses ground in a poll, he’s likely to continue losing further ground.
Without getting too deep into the weeds, I’d just remind you to be open to the possibility that the accusations could have an effect that will last for between a few days and a couple of weeks, but that could fade once other issues displace them in the news cycle. Of course, with less than four weeks to go until the election and people already voting in many states, even a temporary change in the polling numbers could still be reflected in the outcome on Nov. 8.
Proposition No. 4: We probably haven’t seen the end of this. If Trump turns out to be a serial sexual abuser, there’s a good chance that other women will come forward with stories like the ones we’ve heard already. And the women who have come forward so far may yet share additional details about Trump’s alleged conduct. In the past, Trump has also shown a tendency to extend news cycles by refusing to admit wrongdoing and attacking his accusers, even when faced with accusations far less serious than these. We’re already starting to see Trump repeat that pattern here.
Furthermore, opposition researchers have begun releasing information at a prodigious rate, with major new stories about Trump dropping every few days. Many political operatives and campaign reporters believe that there’s more damaging information about Trump that has yet to be made public. While sometimes those guesses can turn out to be wrong, Trump has lived in the public spotlight for decades, leaving a long paper and video trail, and crossing paths — and swords — with many people along the way. The probability of additional leaks is high, so Trump is likely to be off-balance for the stretch run of the campaign.
Proposition No. 5: This probably won’t cost him the election — because Trump was already losing. It’s important to remember that Trump has been running behind Clinton for almost the whole campaign, and he had fallen into roughly a 5-percentage-point deficit after his poor performance in the first presidential debate — and before the latest round of scandals. That deficit is fairly hard to come back from even under the best of circumstances. To make it to the Oval Office now, Trump would have to make one of the greatest comebacks in political history while navigating a minefield of scandals and leaks, making his task even harder. But as far as FiveThirtyEight’s forecasts are concerned, the first debate still looks like the turning point in the race.

October 12, 2016
Election Update: Post-Debate Polls Show Trump Still In Big Trouble
We’re spending a lot of time these days diagnosing whether Donald Trump’s position in the polls is merely bad or still getting worse. Most of the evidence on Wednesday — which included the first dusting of state polls since the second presidential debate, on Sunday night — fell into the “still getting worse” bucket. Trump’s chances are down to 14 percent in our polls-only forecast (against an 86 percent chance for Hillary Clinton) and to 17 percent, a record low for Trump, in our polls-plus forecast.
We’ll start with the three state polls that were conducted entirely after Sunday night’s debate:
First, a Baldwin Wallace University poll showed Trump trailing Clinton by 9 percentage points in Ohio. That’s obviously an awful result for Trump — his worst poll of Ohio all year — although hard to put into context because Baldwin Wallace University hasn’t done a lot of election polling before. Their previous poll of Ohio, in February, showed Trump up by 2 points.Another unsightly number for Trump came from a Y2 Analytics poll of Utah, which you may remember as the state that Mitt Romney won by 48 points. It showed Trump tied with Clinton at just 26 percent of the vote, with the independent candidate Evan McMullin at 22 percent and the Libertarian Gary Johnson at 14 percent. We’re going to be adding McMullin to our model in Utah — give us a day or two on that. But in the meantime, we could also really use another poll or two of Utah to confirm or contradict this result. Although polling there in the spring sometimes showed a tight race, Trump pulled ahead by margins ranging from 7 to 15 points in a series of Utah polls in August and September. If McMullin is really polling in the 20s, however — and taking most of his voters from Trump — he could create an unpredictable finish.Finally, an Opinion Savvy poll of Florida put Clinton up by 3 percentage points. This is the least-worst of the post-debate polls for Trump, but still not good — it shows a slight uptick for Clinton from a late September poll, when Opinion Savvy had her ahead by less than a percentage point.That’s it for the fully post-debate polls. But there was also a Monmouth University poll of Missouri, conducted mostly after the debate, that showed Trump up 5 percentage points there. That’s probably Trump’s best result of the day, given that Monmouth’s previous poll of Missouri, from August, had Trump up just 1 point. To keep things in perspective, however, Mitt Romney won Missouri by 9 points.
Finally, a Marquette University Law School poll of Wisconsin, conducted entirely before the debate, showed Clinton up 7 points — improved from a 3-point lead in Marquette’s mid-September poll. That’s about what we’d have expected to see from a Wisconsin poll, as our forecast has Clinton ahead there by about 8 points. In another scary bit of data for Trump, however, he did significantly worse in the portions of the poll that were conducted on Saturday and Sunday after the release of a 2005 video that showed him condoning unwanted sexual contact toward women.
There are also the national tracking polls, which variously show Trump to be rebounding slightly or Clinton to be continuing to extend her lead. Clinton also regained the lead in the Republican-leaning USC Dornsife/Los Angeles Times tracking poll for the first time since Sept. 11, although we’d recommend reading this analysis of the poll from The Upshot’s Nate Cohn before you spend too much time focusing on its fluctuations.
Trump now trails Clinton by 6.5 percentage points in our popular vote forecast — by comparison, he was 4.6 points back of Clinton a week ago, on Oct. 5, before the videotape or the second debate. So he’s moving in the wrong direction as time is running out. While a Trump comeback is still mathematically feasible — Trump’s 17 percent chance in the polls-plus model, as we’ve pointed out before, is the same as your chances of losing a “game” of Russian roulette — it wouldn’t really have any good precedent in recent American presidential elections.
Video: How different demographic groups could swing the election

October 11, 2016
Election Update: Women Are Defeating Donald Trump
A series of national polls released on Tuesday showed Hillary Clinton leading Donald Trump by margins ranging from 5 to 11 percentage points — except for the USC Dornsife/Los Angeles Times tracking poll, which defiantly continues to show Trump up by 2 points. There isn’t yet enough data from after Sunday night’s debate to really gauge its impact, however. For that matter, the polls may not yet have fully caught up to the effects of the release on Friday of a 2005 videotape, which showed Trump making vulgar comments about women and condoning unwanted sexual conduct toward women. For the time being, Clinton’s lead is holding at about 6 percentage points in our polls-only model, which gives her an 84 percent chance of winning the White House. Clinton’s chances are 80 percent in our polls-plus forecast.
But while we’re in something of a wait-and-see mode, one demographic split caught my eye. That was from a Public Religion Research Institute poll conducted on behalf of The Atlantic. It showed a massive gender split, with Clinton trailing Trump by 11 percentage points among men but leading him by 33 points among women. To put those numbers in perspective, that’s saying Trump would defeat Clinton among men by a margin similar to Dwight D. Eisenhower’s landslide victory over Adlai Stevenson in 1952, while Clinton would defeat Trump among women by a margin similar to … actually, there’s no good comparison, since no candidate has won a presidential election by more than 26 percentage points since the popular vote became a widespread means of voting in 1824. To get to 33 points, you’d have to take the Eisenhower-Stevenson margin and add Lyndon B. Johnson’s 23-point win over Barry Goldwater in 1964 on top of it.
The PRRI poll is an outlier for showing quite so large a gender gap, however. In the table below, I’ve compiled the gender split from all national polls I could find so far in October.
POLLWOMENMENCBS NewsClinton +18Trump +11CNNClinton +14Trump +4Fairleigh DickinsonClinton +24Trump +7Fox NewsClinton +10Trump +7Google Consumer SurveysClinton +13Trump +3Ipsos/ReutersClinton +9Clinton +5Morning ConsultClinton +6Clinton +4PRRI/The AtlanticClinton +33Trump +11Quinnipiac UniversityClinton +20Trump +12Rasmussen ReportsClinton +11Clinton +2USC Dornsife/LA TimesClinton +9Trump +14YouGovClinton +15Trump +2AverageClinton +15Trump +5National polls in October show a wide gender gapThere’s quite a wide range — with live polls showing a notably wider gender spread than online and automated polls. But on average, Clinton leads Trump by 15 percentage points among women while trailing him by 5 points among men. How would that look on the electoral map?
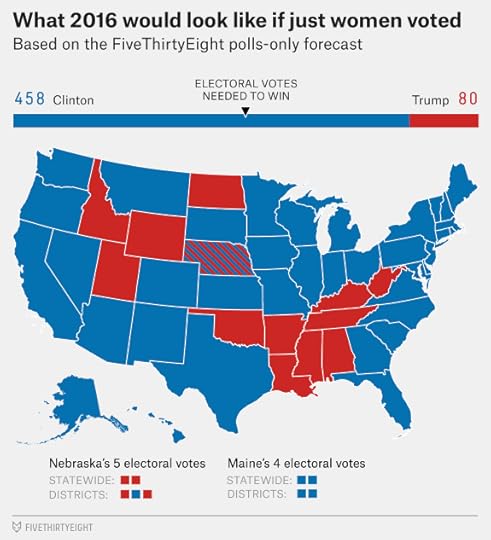
Here’s a quick way to estimate it. In the polls I cited above, Clinton is doing 10 points better among women than among the electorate overall. So we’ll add 10 points to her current polls-only margin in every state to forecast her performance if women were the only ones who could vote. In addition to the states where Clinton is already leading Trump, that would put her ahead in Alaska, Arizona, Georgia, Kansas, Indiana, Missouri, Montana, South Carolina, South Dakota, Texas and the 2nd congressional districts in Maine and Nebraska. Clinton would win 458 electoral votes to just 80 for Trump:
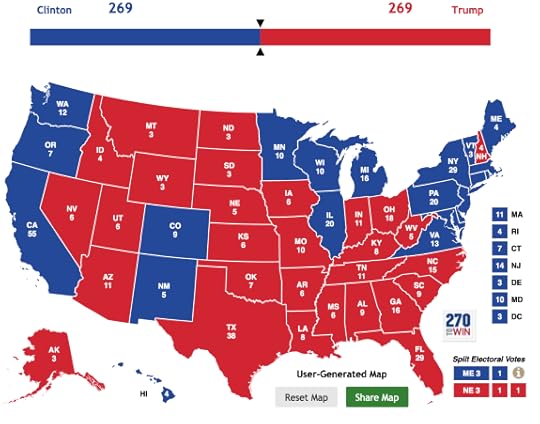
If men were the only voters, conversely, we’d have to subtract 10 points from Clinton’s current margin in every state — which would yield an awfully red map. Trump would win everything that could plausibly be called a swing state, with Clinton hanging on only to the West Coast, parts of the Northeast, Illinois and New Mexico. That would yield 350 electoral votes for Trump to 188 for Clinton:
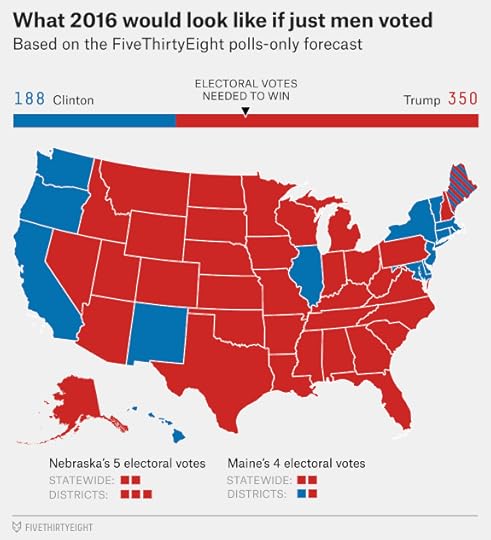
Of course, if the electoral franchise were really restricted only to men, our politics would look a lot different. And if it were restricted only to women, they’d look really, really different, perhaps with entirely different coalitions than the ones that prevail now.
But it seems fair to say that, if Trump loses the election, it will be because women voted against him. I took a look at how men and women split their votes four years ago, according to polls conducted in November 2012. On average, Mitt Romney led President Obama by 7 percentage points among men, about the same as Trump’s 5-point lead among men now. But Romney held his own among women, losing them by 8 points, whereas they’re going against Trump by 15 points.
POLLWOMENMENABC News/Washington PostObama +9Romney +9American Research GroupObama +11Romney +12CNNObama +8Romney +9Gravis MarketingObama +2Romney +2GWU/BattlegroundObama +15Romney +16Monmouth UniversityObama +5Romney +7NBC News/Wall Street JournalObama +8Romney +7Pew ResearchObama +11Romney +10Public Policy PollingObama +5Obama +2Purple StrategiesObama +5Romney +3YouGovObama +12Romney +9AverageObama +8Romney +7The gender gap in November 2012 national pollsThat’s the difference between a close election — as you’ll remember, those national polls in late 2012 showed the race neck-and-neck — and one that’s starting to look like a blowout.

Is This What It Looks Like When A Party Falls Apart?
In this week’s politics chat, we discuss the implications of Donald Trump’s fight with Republican officials. The transcript below has been lightly edited.
micah (Micah Cohen, politics editor): Choosing a topic this week was easy, as the Republican Party appears to be ripping itself apart. So, today’s question: How freaking crazy is what we’re seeing?
harry (Harry Enten, senior political writer): I think it’s perfectly normal to have the Republican nominee bash the Republican speaker of the House on Twitter. It’s also perfectly normal for Republican candidates nationwide to denounce the Republican nominee.
No, it’s completely bat-crap insane.
micah: So, as of our latest count, about 1-in-5 GOP governors, U.S. representatives and U.S. senators have denounced Trump. More than that, obviously, have condemned his behavior on the tape.
So let’s start here: Is there any precedent for this? Does anything come close?
natesilver (Nate Silver, editor in chief): Not in my lifetime.
clare.malone (Clare Malone, senior political writer): Yeah, I think we might need a presidential historian up in here.
micah: Maybe @julia happens to be on slack?
harry: There’s no good precedent for this as far as I know. Obviously, there were party divisions in 1872 and 1896, for example, but this is something different.
natesilver: I like how you’re just trying to beam people into the chat without their permission, Micah. It’s very Star Trek.
micah: OK, so there’s no good precedent that we know of. So then what do we make of this? Is this what it looks like when a party falls apart?
natesilver: It’s just a flesh wound!
clare.malone: I think it’s what it looks like when the national part of a party falls apart, for sure — it’s like a top heavy ice cream cone losing that precarious third scoop on top.
harry: It’s very difficult to break apart how much of this is an ideological division versus a referendum on Trump’s personality.
natesilver: The Washington Post’s lede yesterday referred to how the Republican Party “tumbled toward anarchy Monday,” and that seemed totally appropriate. I feel bad for reporters in future campaigns who will probably be exaggerating if they use language like that. Not so this time, I don’t think.
clare.malone: Maybe let’s take it in baby bites, starting with Paul Ryan, right? That guy, the speaker of the House, just basically conceded that his party shouldn’t win the presidency. That is, pretty effing astounding.
harry: Paul Ryan faces a nearly impossible task: a majority of GOP voters like Trump; a majority of all voters don’t.
natesilver: I feel more sympathy for Ryan than a lot of other Republicans. #confessyourunpopularopinion
clare.malone: It’s definitely, as Harry said, driven by an unacceptable personality in the form of Trump, but he’s also the embodiment of an element of their party faithful. He’s revealing motivations that they’re not totally cool with, aka, xenophobia, racism, etc. The national Republicans would LOVE to be courting conservative Latinos.
julia (Julia Azari, associate political science professor at Marquette University and FiveThirtyEight contributor): I am here! What’s going on?
micah: Julia!!!
clare.malone: Love the guest appearance!
micah: 
October 10, 2016
Election Update: Polls Show Potential Fallout From Trump Tape
Polls conducted since the disclosure of a tape on Friday, in which Donald Trump was recorded condoning unwanted sexual contact against women, suggest that he has probably lost further ground against Hillary Clinton. But the polls aren’t in much agreement, with some polls showing little change in the race and others implying that the tape has had catastrophic consequences for his campaign.
Let’s run through the nine national polls that conducted at least some interviews since the release of the tape late Friday afternoon. In some cases, the polls also contain quite a bit of pre-tape data, so it’s important to pay careful attention to the dates of each survey. We’ll start with the polls that didn’t show much of a shift away from Trump.
Morning Consult’s poll for Politico, conducted entirely on Saturday, showed Clinton with a 4-point lead. Technically speaking, that’s an increase for her, since Clinton led by 2 points in a poll they conducted just after the vice presidential debate. But it’s down from a 6-point lead for Clinton in Morning Consult’s Sept. 30-Oct. 2 poll. So our model considers it to be a pretty neutral result.The USC Dornsife/Los Angeles Times tracking poll, which has had a strong Trump-leaning “house effect”, hasn’t shown a meaningful change, with Trump remaining about 3 percentage points ahead of Clinton. Unlike almost every other poll, the LA Times survey also didn’t show a bounce for Clinton following the first presidential debate. Note, however, that only two of seven days of the poll were conducted since the release of the tape.Survey Monkey’s weekly tracking poll, also with two of seven days of interviews since the tape, shows Clinton up 5 points, little changed from 6 points a week earlier.The Google Consumer Surveys weekly tracking poll, with two of six days of interviews since the tape, has Clinton up 5 points, unchanged from a week ago.And The Times-Picayune/Lucid tracking poll, conducted Friday through Sunday, has Clinton up by 8 points. That sounds like a good result for Clinton, but the survey generally has good numbers for her, as she’s had leads ranging from 5 points to 12 points in the poll since the first debate.Four other polls show clear gains for Clinton, however:
YouGov’s weekly tracking poll, conducted Friday and Saturday, has Clinton up by 6 points — improved from a 3-point lead a week earlier.The Rasmussen Reports tracking poll shows a very sharp shift toward Clinton, putting her ahead by 7 points as compared with a 1-point lead in the poll they released on Friday, even though only one-third of the interviews were conducted since the tape. That’s Clinton’s best position in a Rasmussen poll all cycle.The UPI/CVOTER International tracking poll shows Clinton ahead by 6 points — a marked shift upward from a 1-point lead for Trump a week ago, even though only two of seven days of the poll were conducted since the tape was released.And, most dramatically, an NBC News/Wall Street Journal poll, conducted Saturday and Sunday, shows Clinton with an 11-point lead (and an even larger 14-point lead if third-party candidates are removed). One caution: the poll used a smaller sample size than NBC News and the Wall Street Journal typically uses, just 447 likely voters.What to make of this? Actually, this is pretty normal. For instance, if the video hurt Trump by a net of 2 percentage points, you’d expect some polls to show a 4- or 5-point shift toward Clinton and others to show no gain, or even a slight rise for Trump, because of sampling error and methodological differences.
I’m inclined to read this data pretty negatively for Trump, however, for two reasons. First, as I mentioned, a lot of these polls still have quite a bit of pre-tape data. So the potential effects are not yet fully priced in. Furthermore, the effects of the tape won’t necessarily become evident overnight. It will take a few days for more voters to learn about the contents of the tape and Republican leaders’ reaction to it. I often see reporters and analysts jumping the gun based on the very first poll after a big news event — but it’s not uncommon to have “false negatives” in which overnight polls show little effect while subsequent ones show more.
And second, Trump couldn’t really afford any negative shock to his numbers, given that he entered Friday in a bad position to begin with. Let’s say that the tape only hurts him by one percentage point, for instance, bringing him to a 6-point deficit from a 5-point deficit a week ago. Even that would be a pretty big deal. Before, Trump had to make up five points in five weeks — or one point per week. Now, he has to make up six points in four weeks instead (1.5 points per week).
All of this is further complicated by Sunday night’s debate. Scientific instant polls showed Clinton winning — although, just perhaps, Trump could benefit from at least diverting the headlines away from the tape. Then again, Trump didn’t exactly avoid the subject by invoking Bill Clinton’s sexual infidelities, which could invite further scrutiny of his own conduct toward women.
For the time being, Clinton is an 84 percent favorite in FiveThirtyEight’s polls-only model, and an 81 percent favorite according to polls-plus (her high point of the year in polls-plus). But her odds in both forecasts will probably increase as more post-tape data comes in. We’ll need until Thursday or Friday to have a clear sense for the impact of both the tape and the second debate.
Video: How to swing the election

Nate Silver's Blog

- Nate Silver's profile
- 730 followers

