
Nate Silver's Blog, page 118
October 31, 2016
Election Update: Comey Or Not, Trump Continues To Narrow Gap With Clinton
We got another set of mixed results on Monday on whether the election has tightened further as a result of FBI Director James Comey’s letter to Congress about Hillary Clinton’s email server. Overall, however, this is a fairly negative set of data for Clinton. First, we’ll start with polls that were conducted entirely since the news broke on Friday:
A Morning Consult national poll for Politico, conducted Saturday and Sunday, has Clinton leading Donald Trump by 3 percentage points. That’s down from a 6-point lead in a poll Morning Consult conducted on Oct. 19-20 after the third presidential debate. But Morning Consult also conducted a poll last Thursday and Friday — included with this morning’s release — that had shown the race tightening, with Clinton holding a 3-point lead. So this poll shows Trump closing the gap with Clinton, but not necessarily because of Comey.The Times Picayune-Lucid national tracking poll, conducted Friday through Sunday, has Clinton up by just 1 percentage point — as close as Trump has ever been to Clinton in that poll — although there isn’t a huge swing from the pre-Comey version of the poll, which had Clinton ahead by 3 points.A set of eight automated polls of swing states conducted on Sunday by Remington Research Group on behalf of the Republican consulting firm Axiom Strategies showed Trump gaining 1 percentage point, on average, as compared with polls they conducted a week earlier.There are also several polls that straddle the period before and after Comey’s announcement:
A Monmouth University poll of Indiana, conducted Thursday through Sunday, showed Trump leading Clinton by 11 points, compared with a 4-point lead earlier this month. The Senate portion of the poll also contained bad news for Democrats, with Republican Todd Young pulling into a tie with Democrat Evan Bayh.The USC Dornsife/Los Angeles Times and IBD/TIPP national tracking polls each showed a bit of movement in Trump’s direction. The ABC News/Washington Post tracking poll, meanwhile, has Clinton up 1, which is unchanged from Sunday but nonetheless a bad result for her, and Clinton trailed Trump by 1 point in the portion of the poll conducted since Comey’s announcement.Now for some better results for Clinton: The Rasmussen Reports national tracking poll had her pulling into a 3-point lead from a tie previously. SurveyMonkey’s 50-state tracking poll also showed Clinton steady to gaining slightly in many states. And while they don’t show a ballot test, Gallup’s national tracking poll showed no decline in Clinton’s favorable ratings.While this is not a terrible set of numbers for Clinton — and probably not the “game changer” that the Comey news was billed as on Friday — I’ve also seen analyses that go too far in the other direction and conclude that the news hasn’t really had any impact. Clinton’s popular vote lead is down to 4.7 percentage points in our forecast, as compared with 5.7 percentage points on Friday and 7.1 percentage points two weeks ago. And Trump’s chances of winning are 24 percent in the polls-only model, up from 19 percent on Friday and 12 percent two weeks ago. Trump’s chances are 26 percent in the polls-plus model, which is converging with polls-only.
It’s not easy to tell how much of that shift reflects a reaction to Comey, as compared with a race that had been tightening already. And it remains the case that the margin is closing because Trump is gaining ground from undecided voters and third-party candidates, rather than Clinton losing support. The fact is, though, that the data we’ve gotten during the past few days is consistent with a reasonably competitive race — although one in which Clinton has the advantage — especially given the significant disagreement in the polls and the relatively high uncertainty surrounding the polling this year.
But we also haven’t seen many recent high-quality state polls from states such as Pennsylvania, Michigan and Wisconsin, which are a key part of Clinton’s electoral firewall. The next set of results from those states will go a long way toward determining just how nervous Democrats wind up being. But at this point, the election is a long way from being in the bag for Clinton. Both FiveThirtyEight’s models and betting markets give Trump about a 1 in 4 chance of winning the election, about the same chance as the Chicago Cubs have of winning the World Series.


October 30, 2016
Election Update: What If Clinton Wins North Carolina — And Loses Pennsylvania?
Donald Trump continues to make modest gains in the FiveThirtyEight forecast. His chances are 21 percent in our polls-only model and 23 percent in polls-plus, his best position since early this month in each forecast. And Trump has narrowed Hillary Clinton’s popular vote lead to roughly 5 percentage points from 7 points two weeks ago.
But there’s not yet much evidence about what impact, if any, FBI director James Comey’s letter to Congress on Friday about Clinton’s personal email server will have on the race. Instead, the best polls of the day for Trump were probably a pair of Florida polls completed prior to Comey’s announcement. A poll conducted by Siena College in conjunction with The New York Times’ Upshot blog showed Trump leading Clinton by 4 percentage points — a shift from a 1-point Clinton lead in a Siena/Upshot poll of Florida in September. And a Marist College poll for NBC News and The Wall Street Journal had Clinton with a 1-point lead in Florida, down from a 3-point lead earlier this month.
Florida is a well-polled state, and Clinton remains slightly ahead in the polling average there, with a lead of about 1 percentage point overall in our forecast. But Florida is now somewhat less likely to jump its position in the queue and save Clinton if she has last-minute problems elsewhere on the map, such as in Pennsylvania or Michigan. By contrast, two new polls of North Carolina showed Clinton with leads of 3 and 6 points, a problem for Trump given that Clinton has a substantial lead based on early voting in the state.
We’ll return to the electoral map in a moment — but first, a look at what polls conducted since Comey’s announcement say about the race. This will be brief because there actually aren’t any of them. The best we can do is to look at polls that conducted some of their interviews since the FBI news and compare them to the most recent pre-Comey edition of the poll. There’s really no evidence of a further shift to Trump — at least not yet:
STATEPOLLSTERDAYS POST-COMEYNEW POLLLAST PRE-COMEY POLLSHIFTU.S.ABC/Wash. Post1 of 4Clinton +1Clinton +2Trump +1U.S.IBD/TIPP2 of 6Clinton +3Clinton +3—U.S.USC/LA Times2 of 7Trump +2Trump +2—Wisc.Emerson College1 of 2Clinton +6Clinton +6—Ariz.YouGov1 of 3Trump +2Trump +2—Colo.YouGov1 of 3Clinton +3Clinton +1Clinton +2N.C.YouGov1 of 3Clinton +3Clinton +4Trump +1Pa.YouGov1 of 3Clinton +8Clinton +8—Polls since Comey news don’t show a shift yetOf the eight state or national polls that conducted at least some interviews on Friday or Saturday, two showed a 1-point shift toward Trump, one showed a 2-point shift toward Clinton, and the other five recorded no change. Of course, that’s not what the headlines behind these polls necessarily said. The IBD/TIPP tracking poll, for instance, claimed Clinton’s lead had shrunk “as email scandal blows up.” But her lead in the poll — 2.5 percentage points — is essentially identical to what it was two days ago (3.0 percentage points) before the Comey news.
That’s not to say the news won’t hurt Clinton, however. Absence of evidence is not the same thing as evidence of absence, and without any fully post-Comey polls, there’s just not much data yet on what effect it will have on the race. Clinton also has a variety of potential responses to the FBI news, which could mitigate any potential effects — or worsen them, if she chooses wrongly.
But let’s say that the polls continue to shift toward Trump for whatever reason — whether because of Comey or something else. In that case, Clinton’s “firewall” could shift toward states where she’s already banked a lot of votes as a result of early voting. In particular, Clinton’s lead in North Carolina may be harder for Trump to overcome than our model (which doesn’t directly account for early voting) may imply. The same might also be true of Nevada, where Democrats have a clear lead so far based on early voting results, and where Trump will either need a massive Election Day turnout or a great performance among independents to overcome.
If you put both North Carolina and Nevada in Clinton’s column, what is Trump’s most plausible winning map? It’s probably one of these two:
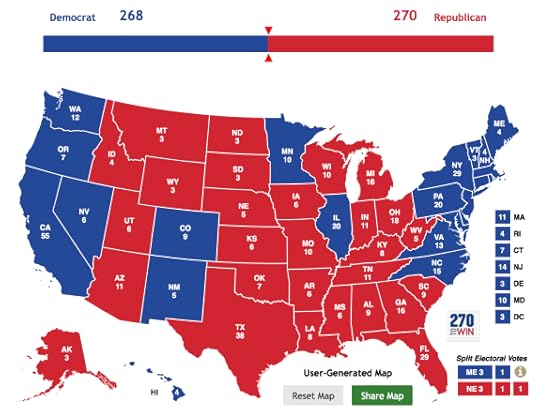

In the first scenario, Trump overperforms in the Midwest and wins both Michigan and Wisconsin, along with Ohio and Iowa. It’s a geographically coherent map — and there’s probably been too little attention paid to Michigan and Wisconsin, which rank 3rd and 5th on our list of tipping-point states, respectively. (Although, note that Wisconsin has in-person early voting so Clinton may be banking a lead there also.)
In the second map, Trump overperforms in the Northeast and wins Pennsylvania and New Hampshire — neither of which have early voting — along with the 2nd Congressional District of Maine. That would be good for a 269-269 tie, which would probably lead to Trump’s election in a Republican-led House of Representatives.
Neither map would leave Trump with much margin for error. Polls have actually shifted away from Trump in Maine’s 2nd District despite his seeming demographic advantages there. Nebraska’s highly-educated 2nd Congressional District — it’s the other state to split its electoral votes by congressional district, along with Maine — could also go to Clinton (there’s been almost no polling there). Utah is a wild-card for Trump because of his poor standing with Mormons and Evan McMullin’s position on the ballot. Even Alaska, where a new poll this weekend actually showed Clinton ahead, is a source of uncertainty.
OK, this is getting far into the weeds. Obviously, Trump doesn’t have an easy path forward if he loses North Carolina. The point is really just this: Despite the recent tightening, Clinton has a fairly significant lead in the polls of about 5 percentage points. So in order to win, Trump needs a further shift because of Comey or some other news — or he needs the polls to have been off the mark to begin with. In the event of a last-minute shift or a significant polling error, the order of the swing states could easily be scrambled, such that Clinton wins North Carolina while losing Pennsylvania or Michigan, for example. With the race in a somewhat dynamic state as we enter the final full week of the campaign, we encourage you to think broadly about how the Electoral College might play out instead of fixating on just a few scenarios.

October 29, 2016
Election Update: Four Ways Forward For Clinton After The FBI News
I’ve heard from people who wonder whether Friday’s news – that FBI director James Comey was investigating additional emails that may be pertinent to Hillary Clinton’s private email server — might have come too late in the campaign to be reflected in the polls, and therefore in our forecast, before Election Day. While the situation isn’t ideal, there’s probably just enough time left to measure the initial impact. In the past, major developments in the campaign have generally taken somewhere around a week to be fully reflected in our forecast, give or take a couple of days depending on the volume of polling. Because we expect there to be an awful lot of polling during the remaining 10 days of the campaign, and because our forecast is designed to react fairly aggressively to late polling shifts, we should have a pretty good read on the initial reaction to the news by the middle of next week.
But while I’m not that worried about the model having enough time to account for the reaction to the FBI news, I am worried about whether it will capture the reaction to the reaction as the story continues to develop. The thing about Friday’s news is that it left a lot of questions unanswered. Comey’s letter to Congress was cryptic, and his motivations for sending it were uncertain. There are conflicting reports about whether the emails include messages to or from Clinton, how many emails there are, whether they’re new or something the FBI has looked at already, and whether the FBI requires a court order to investigate them in more detail. Even the reporting that the investigation pertains to devices owned by ex-Congressman Anthony Weiner and his wife, Clinton aide Huma Abedin, is based on anonymous sourcing. There’s a lot we don’t know.
It seems to me as though there are four basic courses the story might take. As a framing device, I’m going to conceive of these as four strategies available to the Clinton campaign, although of course the campaign isn’t the only actor here – the Trump campaign, the FBI, the news media, down-ballot candidates and so forth also have some choices to make.
Strategy No. 1: Demand more details from ComeyThis was Clinton’s initial strategy during her brief press conference on Friday, where she said that “the American people deserve to get the full and complete facts immediately.”
This approach carries a couple of advantages. First, Clinton may reasonably believe that the details of the case aren’t as bad as the headlines. Voters may fill in the blanks when words like “FBI,” “Clinton” and “investigation” appear in the same headline, even if there’s more smoke than fire to the case. But as more information about the case has come to light, the implications seem less severe for Clinton than they did at first.
Another advantage is that Clinton may get credit from the media for appearing as though she has nothing to hide. There’s a whole school of “savvy” political reporting that holds that it isn’t the crime that matters, but the cover-up. In this view, a relatively minor scandal can become a serious “political problem” if the candidate doesn’t handle it appropriately by showing the right amount of openness and contrition. To say the least, I’m not a fan of this approach, which diverts voters’ attention from the evidence and instead inserts the reporter or pundit as the equivalent of a figure-skating judge who grades the candidates based on artistic impression. But it’s a widespread paradigm in the press, and Clinton could gain more sympathetic coverage if she plays by the media’s rules.
The risk is that by continuing to litigate the case, Clinton could keep the story in the news, which could be a negative for her even if further details prove to be exculpatory. At this point in the election, it’s mostly so-called low-information voters who are still making up their minds — not necessarily those who will read the fine print. And in general this year, candidates have tended to lose ground in the polls whenever they’ve been in the headlines. A day that the media spends talking about Comey and emails is also a day that they don’t spend talking about Trump, and his many vulnerabilities.
Strategy No. 2: Rile up Democratic partisans by attacking Comey and other targetsWhile Clinton herself hasn’t yet attacked Comey’s motivations, her top surrogates and advisors like John Podesta are already doing so. There’s the risk of hypocrisy here given that some of these same Clinton surrogates were praising and defending Comey after the FBI chose not to charge Clinton in July. But the target for arguments like these is not undecided voters who are looking for logical consistency, so much as Democratic partisans who are looking for reasons to feel aggrieved. One reason that scandals and gaffes often don’t have as much impact on the polls as pundits expect is because we live in a highly partisan era, and even highly negative news stories can sometimes wind up motivating a candidate’s own supporters to vote.
Clinton and her surrogates could also take a cue from the Republican playbook by attacking the media for way it’s covered the story. But that’s a riskier strategy for a Democrat, especially given that the public is more inclined to think the media is biased against Trump than against Clinton. Still, the longer the story remains in the news, the more risk there is of fatigue or backlash against it, and Clinton can potentially gain sympathy among Democratic partisans by protesting that the media is obsessed with her “damn emails” at the expense of everything else at stake in the election.
Strategy No. 3: Let it goThis is the opposite of strategy No. 1. Here the Clinton campaign lays low after calculating that the story will die of its own accord. And it may be what we see if the campaign doesn’t see much impact from the FBI news in public and internal polls by early next week. The Clinton campaign woke up Friday morning with a lead of 5 or 6 percentage points nationally. The campaign could afford to lose a point or two, especially if it expects the impact to fade by Election Day (although that may be less true for down-ballot races, where the margin in many states is within 1 or 2 percentage points).
It can be easy to underestimate how quickly the media can turn from one story to the next. Many stories that seem major at the time wind up garnering no more than two or three days of coverage, provided there’s nothing further to perpetuate them — or if there’s something else that pre-empts them.
Strategy No. 4: Drop an opposition research bomb on TrumpSpeaking of which, I often see reporters speculating or predicting that the Clinton campaign is sitting on one or two major pieces of opposition research about Trump, which they’ll leak to the press at a time of maximum strategic advantage. There’s reason to be skeptical of these claims: If the Clinton campaign had something great, wouldn’t they have released it already, especially given that people are already voting in many states?
But the FBI news may slightly increase the chance that we’ll see counter-attacks against Trump. Especially if the polls do tighten, the usually risk-averse Clinton campaign may become more willing to push a story that has some risk of backfiring (say, a serious accusation against Trump that isn’t backed up by more than one source). News organizations and their potential sources may also become more willing to run with these stories if the election becomes closer, taking on more legal and reputational risk, whereas they’d bypass them if Clinton seemed to have the election in the bag.
If the Clinton campaign does have something major on Trump — or even something minor — there’s a lot of art and science involved in when it drops the story. Too soon, and it could get swept beneath the undertow of the FBI story. Too late, and it might look desperate. But one way the campaign could end is with a whole crescendo of major stories dropping. That could make things complicated for pollsters and forecasters.

October 28, 2016
Election Update: The FBI Is Back — This Time With Anthony Weiner
I was just sitting here thinking that we were in for a relatively newsless, perhaps even anticlimactic, finish to the presidential campaign. Then the news broke that FBI Director James Comey sent a letter to congressional leaders saying that the FBI had “learned of the existence of emails that appear to be pertinent to the investigation” of Hillary Clinton’s personal email server during her time as secretary of state. The FBI will take “appropriate investigative steps” to review the emails, the letter said.
The emails apparently came from electronic devices belonging to Anthony Weiner, the former congressman, and his wife, Huma Abedin, an aide to Clinton, and surfaced as part of an investigation into lewd text messages that Weiner sent to underage women. It isn’t clear that the emails directly implicate Clinton, and the reporting I’ve followed so far suggests that in a legal sense, Comey’s decision to inform Congress may be something done out of an “abundance of caution.” But in a political sense, there’s certainly some downside for Clinton in the appearance of headlines containing the words “FBI,” “investigation” and “email” just 11 days before the election.
We’ll return to the FBI news in a moment, but first, a quick look at where our forecast stands — and I’ll remind you that it is based on polls and won’t reflect any effect from the FBI news until the polls do. We’ve reached the point in the campaign in which there are so many polls coming in — state polls, national polls, tracking polls, one-off polls — that it’s really nice to have a model to sort out all the data. A couple of days ago, the model was beginning to detect tenuous signs that the presidential race was tightening. Now, that seems a bit clearer. Clinton’s lead over Donald Trump is now 5.7 percentage points in our polls-only model, down from 7.1 points on Oct. 17. And Trump’s chances of winning the election have recovered to 18 percent from a low of 12 percent. Trump’s chances in our polls-plus forecast are 21 percent, improved from a low of 15 percent.
Almost all the tightening is happening because Trump’s numbers have improved. Clinton’s share of the vote — about 46 percent in national polls — is still as high as it’s been all campaign. But Trump seems to have brought home some Republicans who were thinking about sitting out the election or voting for a third-party candidate. Libertarian Gary Johnson has fallen to 5 percent in our popular-vote forecast — his lowest point to date. (If Johnson finishes with less than 5 percent, the Libertarian Party would be deprived of federal matching funds for the 2020 election.) The undecided vote is also declining, although it remains high compared with recent elections.
The tightening is modest enough that it’s not apparent in every poll. It isn’t hard to find polls with favorable trend lines for Clinton, in fact. But there are slightly more of them that have favorable trend lines for Trump, at least compared with his mid-October lows.
To take a wider vantage point: If you’d told Clinton a year ago that she would enter the final week of the campaign with a 5- or 6-point lead and roughly an 80 percent chance of winning the presidency, she’d probably have been very pleased with that. At the same time, we haven’t seen the bottom completely fall out for Trump as seemed possible a week or two ago. There have been no major opposition-research dumps on Trump over the last week, and he’s been relatively quiet on the campaign trail, making less news than he usually does. (Obligatory caveat: That could change at any time.)
Instead, the surprise of the day was a negative one for Clinton. Our general view of campaign-related news coverage is that it’s evolved a lot from 2012, when many events were hyped to be “game-changers” and very few turned out to move the polls. In fact, among some of the more empirically minded journalists I follow, the conventional wisdom may have overcompensated too far in the direction of “lolz nothing matters,” downplaying the importance of events that seemed highly likely to move the polls, such as the first presidential debate. In general, making news of any kind has been bad for Clinton and Trump, as periods of more intense coverage have been followed by declines in the polls.
One of those events came July 5, when Comey announced that there would be no criminal charges in the investigation into Clinton’s server but repudiated Clinton for the way she handled email. That announcement brought the story back into the news and preceded a 2-percentage-point drop for Clinton in national polls, although there was no obvious gain for Trump — instead, voters retreated into the undecided column.
If, hypothetically, the same thing were to happen again — Clinton loses 2 points to undecided overnight — her odds of winning the election would decline to 68 percent in our polls-only model. So that’s a significant shift.
But it’s not clear that the situations are comparable, especially if the “investigative steps” have nothing directly to do with Clinton or her email server and won’t be completed until after the election. My hunch (like The Washington Post’s Dave Weigel’s) is that Weiner is such a tragicomic figure, and such a lightning rod for news coverage, that he could insulate Clinton from some of the fallout she might have suffered otherwise. There are also fewer undecided voters now than there were in July, voter choices are more locked in, and many people have already voted — which could lessen the impact.
Even so, the news could get Republican partisans riled up, increasing turnout, and could play into a closing message for Trump about Clinton’s “corruption” — if he’s disciplined enough to sustain one. At a minimum, there’s no upside in the story for Clinton.
To repeat, our forecasts won’t show any impact until and unless the polls do. But in general, FiveThirtyEight’s models are relatively quick about detecting trends from the polls. At the same time, they account for a greater amount of uncertainty than most other models, which results in a better chance for the trailing candidate (in this case, Trump). Our forecast already saw Clinton as less of a sure thing than other models, which variously give her a 92 percent to a 99 percent chance of winning as compared with our roughly 80 percent chance, and that gap could widen in the coming days.

Elections Podcast Countdown: 11 Days
As the 2016 campaign comes to a close, the FiveThirtyEight Elections podcast team is recording daily episodes. Listen above for the latest installment, in which editor-in-chief Nate Silver and politics editor Micah Cohen answer listener questions about our forecast models. They discuss recent tightening in the polls, early voting and how betting markets have already moved in response to news that the FBI is reviewing new evidence in their probe of Hillary Clinton’s private email server.
For more elections coverage, check out:
The latest presidential forecastThe latest Senate forecastThe latest election updatesHave questions you want answered on the podcast? Get in touch by email, on Twitter or in the comments. We will not be posting transcripts for our daily podcasts, but you can still get your daily dose of written news and analysis through Nate Silver’s election updates.
We’ll be recording daily Elections podcasts from now until Nov. 8 and posting new episodes every afternoon. Be sure to subscribe so you don’t miss a new episode.
You can listen to the episode by clicking the “play” button above or by downloading it in iTunes, through the ESPN App or on your favorite podcast platform. If you are new to podcasts, learn how to listen.

October 27, 2016
Election Update: The Polls Disagree, And That’s OK
Pretty much everyone has an incentive to push the narrative that the presidential race is tightening. The television networks would like for you to keep tuning in to their horse-race coverage. Hillary Clinton’s campaign would like for you to turn out to vote, instead of getting complacent. Donald Trump’s campaign would like you to know that its candidate still has a chance.
But what do the polls say? The race probably is tightening — but perhaps not as much as the hype on the cable networks would imply. In our polls-only forecast, Trump has narrowed Clinton’s lead in the popular vote to roughly 6 percentage points from 7 points a week ago, and his chances of winning have ticked up to 17 percent from 13 percent. In our polls-plus forecast, Trump’s chances are up to 19 percent from 16 percent. Because of the high level of uncertainty in the race, we can’t say the door is closed on a narrow Trump victory. And we’re certainly a week or two removed from the period when every poll brought good news for Clinton: Plenty of polls now show negative trend lines for her (in addition to others that show a positive trend). But the race hasn’t fundamentally changed all that much, and Clinton remains in a strong position.
The data, however, offers a lot of opportunities for cherry-picking, both because there are a lot of polls and because they don’t agree all that much with one another. That’s especially true of national polls. Recent national surveys show everything from a 14-percentage-point Clinton lead to a 1-point lead for Trump. On average, that works out to a Clinton lead of 5 to 6 points — but there’s a lot of variation.
How unusual is it for polls to show this wide a range of outcomes? In the table below, I’ve compiled a summary of national polls conducted during the final week of the campaign in elections since 1976. (I used just one poll per polling firm — the last one each released before the election.) For 2016, I’m showing the numbers for national polls since last week’s presidential debate. Note that this is not an apples-to-apples comparison: There’s a good chance the polling range will narrow over the final week of the campaign because of herding (pollsters sometimes get scared to publish results that seem like outliers as the campaign draws to a close). But it makes for some interesting data:
LEADING CANDIDATE POLLING MARGINYEARNO. POLLSLEADING CANDIDATEHIGHLOWAVERAGESTD. DEVIATION19763Jimmy Carter+4-1+1.32.519804Ronald Reagan+5+1+2.51.919845Ronald Reagan+25+10+17.26.219888George H.W. Bush+19+4+9.14.819929Bill Clinton+8+2+5.72.319968Bill Clinton+18+7+11.83.220009George W. Bush+5TIE+2.91.8200414George W. Bush+6-2+1.62.3200818Barack Obama+11+5+7.61.8201222Barack Obama+4-1+1.21.52016*22Hillary Clinton+14-1+5.33.6How national polls varied in the final week of past campaigns* 2016 results reflect polls conducted since the third presidential debate, not over the final week of the campaign.
In 2012, there were 22 polls conducted in the final week of the campaign. And they formed a very tight range: None had President Obama ahead by more than 4 percentage points or behind by more than 1 point. The standard deviation of Obama’s margin over Mitt Romney was just 1.5 points.
The 2000 and 2008 elections were similar, with only 5 or 6 percentage points between the best and worst polls for the respective candidates. No national poll in the final week of the 2000 campaign had Al Gore ahead in the popular vote, incidentally, even though he ended up winning it. The 2004 election had a slightly wider range: Some polls showed a George W. Bush lead of as large as 6 percentage points, while a couple had John Kerry ahead.
All those differences are modest compared with what we’re seeing this year. As measured by the standard deviation, the spread in polls conducted since the third presidential debate is about twice as wide as what we saw at the end of campaigns from 2000 through 2012, on average. Again, that isn’t a perfect comparison because the range of polls may narrow over the final week of this campaign. But it’s not just your imagination if you feel like there’s more variation in the polls than you’re used to.
Here’s another question, though. How much should you expect the polls to differ from one another? Even if there were no methodological differences, you’d expect some variation as a result of random sampling error. Could the seemingly huge spread in the polls this year turn out to be nothing more than statistical noise?
Probably not. For each election, I ran 10,000 simulations in which I estimated how wide the range of the polls “should” be based on the sample size of each poll. From these simulations, I also calculated a confidence interval for each election; in theory, the standard deviation in the polls should fall within this interval 95 percent of the time.
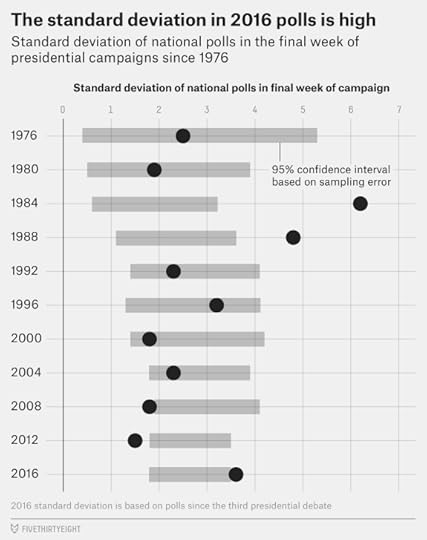
Well, that’s pretty interesting. The standard deviation for the 2016 polls — 3.6 percentage points — falls just outside the confidence interval, which runs from 1.8 points to 3.5 points. That suggests there are probably some real methodological differences and that the wide spread in the polls doesn’t reflect sampling error alone. For instance, live telephone polls show Clinton ahead by 6.4 points on average, a larger lead than she has in online polls (5.1 points) or automated telephone polls (2.3 points, although there are only three automated polls in the average).
What’s also interesting, though, is that there was too little variation in the polls in 2008 and, especially, in 2012. By chance alone, you’d have expected some Obama +6’s in the final polling average in 2012 or some Romney +3’s. Instead, the polls were packed within a very tight range, which probably suggests some herding.
And it wasn’t even as though the national polls did all that great in 2012. Of the 22 national polls, all but one underestimated Obama’s popular vote margin against Romney. Conversely, there was a wide spread in the polls in 1984 and 1988 — even wider than this year — but the average did a good job of forecasting the final margin in the race.
So although the wide spread in the polls this year may reflect challenges in the polling industry, you shouldn’t make a habit of berating the polls that seem to be outliers or use a somewhat unorthodox methodology. Aggregating mechanisms like polling averages and betting markets are powerful precisely because they reflect a diverse array of approaches and opinions, and they lose their power when they’re subject to herding or groupthink. You also shouldn’t cherry-pick the two or three polls that fit your narrative when there are dozens of them out there, of course. But ignoring or “debunking” the polls you don’t like is often almost as bad a sin as cherry-picking the ones you do like.

October 26, 2016
Election Update: Is The Presidential Race Tightening?
It seems like we’re overdue for another round of “is the presidential race tightening?” And the answer isn’t totally clear. Our model thinks Donald Trump has probably narrowed his deficit against Clinton slightly, but the difference is modest enough that we’ve wanted to change our answer with every new round of polls. And in general, we’re reluctant to proclaim any turnaround in the race while we still have to squint to see a shift.
But here’s what we think is a little clearer: Trump’s share of the vote has increased, as he’s picked up undecided and third-party voters, probably as the result of Republicans’ returning home after a disastrous series of weeks for Trump this month. Clinton, however, is at least holding steady and probably also improving her own numbers somewhat.
Consider one of the worst polls of the day for Clinton: Monmouth University’s poll of New Hampshire, which gave Clinton a 4-percentage-point lead, down from a 9-point lead in Monmouth’s previous poll of New Hampshire in mid-September. But the poll didn’t really show Clinton’s vote declining (she fell only from 47 percent of the vote to 46 percent). Instead, the shift was primarily because Trump increased his vote share from 39 percent to 43 percent, having taken his votes from Gary Johnson and the undecided column.
One of Trump’s worst polls, conversely, was a Suffolk University national poll that showed Clinton beating him by 10 points — up from a 7-point lead in Suffolk’s previous national poll in late August. And yet, Trump didn’t actually lose any ground in the Suffolk poll, improving to 38 percent of the vote from 35 percent before. It’s just that Clinton zoomed up further, improving to 47 percent from 42 percent.
We can also see this pattern in FiveThirtyEight’s national polling average. Clinton’s currently at 46.0 percent, which is her highest number on the year and up by 0.6 percentage points from a week ago, when she was at 45.4 percent just before the third presidential debate. Trump, meanwhile, is at 39.6 percent in national polls. That’s not a great number but is also improved — he was at 38.8 percent a week ago.
PERIODDATECLINTONTRUMPJOHNSONUNDECIDED / OTHERBefore 1st debateSep. 2642.441.07.59.1Before 2nd debateOct. 944.839.76.98.6Before 3rd debateOct. 1945.438.86.59.3TodayOct. 2646.039.65.78.7How national polls have shiftedBased on FiveThirtyEight polls-only national polling average
Something else we’re relatively certain about is that Trump’s gains are partly the result of Republicans returning home to his campaign. One piece of evidence comes from Gallup’s tracking of candidate favorables: Trump’s favorable rating among Republicans has improved from 64 percent to 71 percent over the past week. But his favorability numbers with the broader electorate are up only slightly, from 31 percent to 34 percent. That suggests that Trump’s gains have come principally among Republicans.
Another hint is in Trump’s polling over the past week in deeply red states such Arkansas, Oklahoma and Wyoming, where he’s gotten some of his strongest numbers of the year. No, these states were never really in any doubt, but they do contain plenty of Trump base voters, so the trend lines are useful to look at if we want to see how his base is behaving. (Trump’s also pulled back from the brink slightly in Texas, although he still appears to be in trouble in Utah.)
Finally, I’d consider reversion to the mean. Trump’s unpopularity is unprecedented, but even so, the United States is a highly partisan country, and having only 64 percent of your own party’s voters take a favorable view of you — as Gallup found a week ago — is really low. While Trump’s performance during the second and third debates was middling as judged by post-debate polls, he at least tossed his base plenty of red meat. And there’s been less discussion recently of the videotape released on Oct. 8 that showed Trump condoning unwanted sexual contact toward women, or of the many women who came forward to accuse him of sexual assault.
Another potential issue is partisan nonresponse bias, the possible tendency of voters not to respond to surveys during periods of poor news coverage for their candidate, which can potentially exaggerate swings in the polls. I’m personally somewhat agnostic about how serious a problem this is and whether there are good ways to adjust for it. But certainly, when a candidate has several weeks in a row of very negative coverage, you shouldn’t necessarily assume the polls conducted during that period represent the “new normal” in the race.
With all that said, Trump’s chances of winning the election haven’t improved very much in our forecast. His odds are 15 percent in our polls-only forecast, not appreciably changed from 13 percent a week ago, and 16 percent in our polls-plus forecast, as compared with 15 percent last week. That’s because the modest gains Trump has made are partly offset by time running off the clock, and the number of undecided voters declining.
So then: Democrats have nothing to worry about, right? Nope, we wouldn’t say that, either. The race could easily tighten further. And our forecast gives Trump better odds than most other models because it accounts for the possibility of a systemic polling error, a greater risk than people may assume. A 16 percent chance of a Trump presidency isn’t nothing — as we’ve pointed out before, it’s about the same as the chances of losing a “game” of Russian roulette. And 15 percent is about the same chance we gave the San Antonio Spurs of beating the Golden State Warriors last night — the Spurs won by 29 points.

October 25, 2016
Election Update: Where Are The Undecided Voters?
Every new poll seems to provide support for one of two impressions of the race: one in which Hillary Clinton is pulling away toward a historic landslide, and another in which Clinton holds a lead but Donald Trump remains on the fringes of contention.
On the whole, the data released over the past several days suggests that the race may have tightened just the slightest bit. But this seems to be the result of Trump having seen his image rebound some among Republican voters, rather than having taken any votes away from Clinton. In fact, Clinton’s standing in our national polling average — 46 percent — is the highest it’s been all year, including when she was in the midst of her convention bounce. But Trump’s at 40 percent, about 1 percentage point better than a week ago, and — believe it or not — also not far from his high on the year (Trump peaked at 41 percent in late September).
Both candidates, in other words, are slowly gaining votes from undecided voters and from third-party candidates. Emphasis on “slowly,” because there are still a lot of these voters up for grabs. About 15 percent of the electorate isn’t yet committed to Clinton or Trump, as compared to just 5 percent who weren’t committed to President Obama or Mitt Romney at this point in 2012. That’s one of the reasons why our models still give Trump an outside chance at victory. In theory, with Clinton at “only” 46 percent of the vote, he could beat her by winning almost all of the undecided and third-party voters. (In practice, there’s no particular indication that these voters have Trump as their second choice.)
These undecideds, however, aren’t distributed evenly across the various states. Florida and North Carolina have relatively few of them, for example, while New Hampshire and Colorado have more. This could affect each campaign’s strategy over the final few weeks: In states with few undecideds, it’s mostly a matter of turning out your vote; in states with more of them, voters may still be open to persuasion.
Let’s look at some data using the adjusted polling average in each state from the FiveThirtyEight polls-only forecast. We’ll look at the 16 states that we term “states to watch” — already a fairly broad group that includes states with very dissimilar races, such as Maine and Utah — plus a few others that could be extreme reaches for each candidate: New Mexico for Trump, and Texas, Alaska, Indiana and Missouri for Clinton.
I’ve sorted the states by the combined number of undecided and third-party voters (from fewest to most). I’m deliberately blurring the distinction between these groups because third-party voters often have a weak commitment to their candidates and can be picked off by one of the major-party candidates. The exception is when the third-party candidate has a viable chance of winning, which probably applies only to Evan McMullin in Utah at this point. Henceforth, I’ll use the term “undecided” to refer to this combined group of undecided and third-party voters.
ADJUSTED POLLING AVERAGESTATECLINTONTRUMP3RD PARTY OR UNDECIDEDFlorida46.2%42.8%10.9%North Carolina45.342.711.9Georgia42.645.212.2Pennsylvania46.840.013.2Nevada44.841.813.4Ohio43.542.713.7Missouri40.245.314.5Texas40.245.314.5Virginia46.538.115.3Arizona42.142.015.9Wisconsin45.838.315.9Indiana38.445.316.3New Hampshire45.837.416.8Minnesota45.138.016.9Iowa41.341.717.0Colorado44.638.117.2Michigan45.136.918.0Maine44.936.618.5New Mexico43.733.323.0Alaska35.440.424.2Utah25.431.443.2Which states’ voters have made up their minds?The fewest undecideds are in Florida, North Carolina, Georgia, Pennsylvania and Nevada. And that makes sense. These are states where both parties have their bases, with voters split heavily along racial, religious and educational lines. In these states, it’s mostly a competition to see whose base is a little larger and who can turn out more of their voters. Coincidentally or not, these states also have a lot of early voting, except for Pennsylvania. So you’re seeing a lot of campaign activity in most of these states, especially in Florida, North Carolina and Nevada. Campaigns generally think that by this late stage of the race, they can improve their margins more by focusing on turnout rather than persuasion — especially in early-voting states where the election has already begun.
The state with the most “undecided” voters is Utah, but most of them are actually McMullin voters. He has a real shot in the state (a 14 percent chance according to our polls-only model, and that’s probably too low), so he’ll probably hold on to the voters he has so far, or even pick up more. After that comes New Mexico, where Johnson has his largest residual share of support but has faded from contention, and Alaska. Trump isn’t a good fit for Alaska’s more libertarian-ish brand of conservatism, but it’s a real stretch for Clinton and, because it has just three electoral votes and is out of the way, isn’t likely to be the subject of any last-minute campaign activity. (Campaign nerds might remember Dick Cheney’s quixotic visit to Hawaii at the end of the 2004 campaign; Cheney and George W. Bush still lost the state by 9 percentage points.)
Among the more traditional swing states, Maine, Michigan, Colorado, Iowa and New Hampshire have more undecided voters than the others. You might notice that they have something in common: a lot of white voters, and particularly a lot of middle-class whites, which is one group that’s still relatively torn between the candidates.
These states are important because if there’s some sort of last-minute surge back toward Trump, he has more opportunity to make up ground in these states than in places like Pennsylvania, where more of the vote is locked in. There are Election Day scenarios where Clinton finds herself in unexpected trouble in one of her supposed firewall states such as Michigan or New Hampshire, but she squeaks by with a win in North Carolina or Florida because her turnout operation and early voting save the day. That might not be the way Clinton would draw things up, but it would still count as a win.
Overall, Clinton’s chances are 85 percent in our polls-only forecast and 83 percent in polls-plus, not meaningfully changed over the past few days.
VIDEO: Nate Silver says Clinton’s campaign is underrated

Are Democrats Headed For A Split Even If Clinton Wins?
In this week’s politics chat, we examine the cracks in the Democratic Party’s coalition. The transcript below has been lightly edited.
micah (Micah Cohen, politics editor): The WikiLeaks dumps of hacked Hillary Clinton campaign emails have mostly been 
A Two-Weeks-Until-Election-Day Podcast Extravaganza
Election Day is in two weeks, and on Monday night, the FiveThirtyEight Elections podcast team entered the home stretch with its final live podcast taping of the season. The crew discussed the wide-open Electoral College map and how the U.S. Senate races are shaping up. Team members also indulged in a bit of counterfactual fancy — imagining what the presidential race would look like if someone other than Donald Trump were the GOP nominee. Also, in honor of our recent podcast documentary on the 1992 campaign, they played a round of 1992 presidential election trivia (with some pop culture questions thrown in).

Today also marks the kickoff of daily Elections podcasts; they’ll be happening through Nov. 8. We’ll be posting new episodes every afternoon. Be sure to subscribe so you don’t miss one.
You can listen to the episode by clicking the “play” button above or by downloading it in iTunes, the ESPN App or your favorite podcast platform. If you are new to podcasts, learn how to listen.

Nate Silver's Blog

- Nate Silver's profile
- 730 followers

