
Nate Silver's Blog, page 115
November 21, 2016
Politics Podcast: What Would You Change About American Democracy?
FiveThirtyEight contributor Julia Azari joins the FiveThirtyEight Politics podcast to talk about the historical precedent for President-elect Donald Trump’s administration thus far, and Clare Malone shares her latest reporting on Americans’ distrust of institutions.
We’re also sending listeners on a Thanksgiving mission: Avoid an argument about the 2016 presidential election by asking relatives a deeper question, how they might change the way we conduct our democracy. Topics could include redistricting, campaign finance, primaries, the Electoral College or campaign duration. To share what you hear, email podcasts@fivethirtyeight.com or call (646) 820-0538.
You can listen to the episode by clicking the “play” button above or by downloading it in iTunes, the ESPN App or your favorite podcast platform. If you are new to podcasts, learn how to listen.
The FiveThirtyEight Politics podcast publishes Monday evenings, with occasional special episodes throughout the week. Help new listeners discover the show by leaving us a rating and review on iTunes. Have a comment, question or suggestion for “good polling vs. bad polling”? Get in touch by email, on Twitter or in the comments.


Which Republican Senators Are Most Likely To Fight Trump?
Out of the rubble of the Nov. 8 election, Democrats managed to pick up two U.S. Senate seats from Republicans — in Illinois and New Hampshire — while holding on to all of their own. It was an underwhelming performance given how many chances Democrats had to gain seats all over the map. Still, Donald Trump will begin his presidential term with Republicans holding only a narrow Senate majority: either 51-49 or (more likely) 52-48, depending on the results of Louisiana’s runoff election on Dec. 10.
That means defections of just two to three Republican senators could block Trump from confirming his cabinet, making successful Supreme Court appointments, or passing new pieces of legislation. But how many anti-Trump Republicans can we really expect in the Senate, especially given that all but three Republican senators come from states that voted for him? And with the daunting Senate map that Democrats face in 2018 — with several red-state Democrats up for re-election — how many of their own senators might join with Trump on key votes?
Until the Senate convenes on Jan. 3, the best we can do is make educated guesses about the coalitions that will line up around Trump. But there are a few obvious factors that will presumably correlate with support for his agenda:
Issue alignment: Senators whose policy positions are more aligned with Trump’s will be more likely to support him.Personal support: Senators who endorsed Trump — and there were a lot of gradations of endorsements and non-endorsements — will be more likely to support him.Electoral incentive: The better Trump performed in a senator’s state, the more likely the senator will be to support Trump, other factors held equal, especially if the senator is up for re-election in 2018.I came up with a quick way to measure each of these qualities on a 1-to-5 scale, where 5 implies a higher likelihood of supporting Trump. Although the calculation for the first factor, issue alignment, is fairly involved, this is not meant to be a terribly precise exercise. Instead, we just want to get a rough sense for how many potential Republican defectors or Democratic supporters there might be for Trump on contentious votes. Not to be overlooked: How easy or challenging it will be for Trump to gather the 60 votes necessary to overcome potential Democratic filibusters, a tactic that probably won’t be going away anytime soon.
Here’s a brief description of how I calculated the score for each factor:
Issue alignment. Trump was an unusual Republican nominee in that he didn’t have down-the-line conservative views, instead mixing extremely conservative stances on issues such as immigration with surprisingly moderate (or even leftist) ones on other issues such as trade — with a lot of improvisation (and inconsistency) along the way. Therefore, the usual statistical methods that rate members of Congress on a one-dimensional, liberal-conservative scale may not be the best way to predict compatibility with Trump.
Instead, I used data from OnTheIssues.org, which tracks candidates’ positions within 20 policy areas based on their public statements and voting history. The site rates candidates’ positions on a 10-point scale from -5 to +5 — for instance, on immigration, -5 represents a conservative stance (start deporting people) whereas +5 is a liberal one (amnesty for immigrants who entered the country illegally).
We can calculate each senator’s similarity to Trump in the aggregate over these various issues. For each issue, I measured the distance between each senator’s stance and Trump’s position on the 10-point scale. Then I squared the result, which punishes larger differences of opinion as compared to smaller ones, and weighted each issue based on how often Trump talks about it — so immigration matters more than school choice, for instance. This calculation resulted in a weighted, root-mean-squared distance (RMSD) from Trump, where lower numbers meant more similarity to him.
REPUBLICANSDEMOCRATSSENATORSTATESCORESENATORSTATESCORE1PerdueGA2.637HeitkampND4.12ScottSC3.1—Campbell*LA4.73RischID3.452WarnerVA4.84SasseNE3.454DonnellyIN5.35TillisNC3.455ManchinWV5.36CassidyLA3.556McCaskillMO5.77ShelbyAL3.658HassanNH5.88EnziWY3.659MerkleyOR5.99SullivanAK3.660TesterMT5.910GardnerCO3.661KlobucharMN6.112JohnsonWI3.662ShaheenNH6.112AlexanderTN3.663SchatzHI6.113YoungIN3.664KingME6.114BarrassoWY3.665CaseyPA6.215CruzTX3.766CarperDE6.316RubioFL3.767BookerNJ6.417ErnstIA3.868StabenowMI6.418ToomeyPA3.869KaineVA6.419DainesMT3.870CoonsDE6.520InhofeOK3.871HeinrichNM6.521FischerNE3.872Cortez MastoNV6.622GrahamSC3.873BlumenthalCT6.623BurrNC3.974WydenOR6.724HoevenND3.975MurphyCT6.725CrapoID3.976PetersMI6.826SessionsAL3.977GillibrandNY6.827CochranMS3.978FeinsteinCA6.928FlakeAZ4.079HarrisCA7.029CapitoWV4.180BennetCO7.030CorkerTN4.181NelsonFL7.031IsaksonGA4.182BrownOH7.032CottonAR4.183MenendezNJ7.133ThuneSD4.184SandersVT7.134CornynTX4.185LeahyVT7.135BoozmanAR4.186DurbinIL7.136LankfordOK4.187ReedRI7.238WickerMS4.288SchumerNY7.239HatchUT4.289FrankenMN7.240LeeUT4.290HironoHI7.241MoranKS4.391WarrenMA7.242McConnellKY4.392WhitehouseRI7.343GrassleyIA4.493UdallNM7.344RobertsKS4.494MarkeyMA7.445HellerNV4.595CardinMD7.446Kennedy*LA4.596DuckworthIL7.547BluntMO4.697BaldwinWI7.548RoundsSD4.698Van HollenMD7.549MurkowskiAK4.799CantwellWA7.650PortmanOH4.8100MurrayWA7.751PaulKY4.853McCainAZ5.057CollinsME5.8Which senators are most similar to Trump?*Either Campbell or Kennedy will be elected in the Louisiana runoff on Dec. 10.
Source: ontheissues.org
Because of Trump’s unorthodox stances, no senator is a carbon copy of him. (Perhaps that will change once Trump has been in office four years and reshapes the party in his image.) The closest, according to our similarity score, is Sen. David Perdue of Georgia, who like Trump was a wealthy businessman before running for office. And in general, senators who were first elected during the tea party era from 2010 onward are more similar to Trump than those who have held longer tenures in office. The former group includes some senators, such as Ben Sasse of Nebraska, who have publicly feuded with Trump. Their beefs with Trump may have less to do with differences over policy and more about his style of leadership and fitness for office.
By contrast, a few Republican senators really don’t have much in common with Trump, policywise. Sen. Susan Collins of Maine, especially, has more differences with Trump than similarities. Arizona Sen. John McCain and Trump may both be “mavericks,” but not in a way that will necessarily be compatible with one another. Kentucky Sen. Rand Paul’s libertarian-ish views are a bad mix for Trump’s populist ones. And moderate, pro-free-market Republicans such as Ohio Sen. Rob Portman may find themselves at odds with Trump on issues such as trade.
Among Democrats, Trump has some commonalities with moderate, populist Democrats such as North Dakota Sen. Heidi Heitkamp, Indiana Sen. Joe Donnelly and West Virginia Sen. Joe Manchin. Heitkamp, in particular, rates as being closer to Trump on the issues than many Republicans. Several of these Democrats also happen to be up for re-election in 2018 in states that Trump won by wide margins (more about that in a moment). Meanwhile, the least similar senators to Trump are Patty Murray and Maria Cantwell of Washington, liberal Democrats who (unlike many of their liberal compatriots) support free trade.
(Note: for easier comparison with the other metrics, I translated the RMSD scores to a 5-point scale, where 5 indicates more similarity to Trump. You can find that calculation in the footnotes.)
Personal support. I also rated the senators on a 5-point scale based on whether, when and how they endorsed Trump. (The primary sources are Daniel Nichanian’s spreadsheet and FiveThirtyEight’s own endorsement tracker from the primaries). The rating scale is as follows, ranging from least supportive of Trump to the most.
1 point — endorsed Hillary Clinton. All current and newly elected Democratic senators fall into this category, except for Foster Campbell, the Democrats’ candidate in the Louisiana runoff, who didn’t endorse either Clinton or Trump.2 points — endorsed Evan McMullin or Gary Johnson. This category applies only to Sen. Lindsey Graham of South Carolina, who endorsed and then voted for McMullin.3 points — didn’t endorse Trump or anyone else. Several Republicans, such as Collins, fall into this category, including some like McCain who unendorsed Trump after the “Access Hollywood” tape surfaced.3.5 points — ambiguous on Trump. Sen. Shelley Moore Capito of West Virginia called on Trump to “re-examine his candidacy” after the “Access Hollywood” tape, but never formally unendorsed him, nor did she ever reaffirm her original endorsement.4 points — wavered, then endorsed Trump. These candidates eventually endorsed Trump by Election Day, but either unendorsed him at some point during the campaign before re-endorsing him, endorsed one of his opponents in the primary or ran against him in the primary.5 points — endorsed Trump without wavering. Everyone else falls into this category.Electoral incentive. Only three Republican senators — Collins of Maine, Cory Gardner of Colorado and Dean Heller of Nevada — came from states that Trump lost last week. In fact, many Republicans probably have more reason to worry about a primary challenge than their general election prospects. That could help keep Sasse in line, for example.
By contrast, 11 or 12 Senate Democrats will hail from states won by Trump, depending on whether Campbell wins the Louisiana runoff. But there are obviously varying degrees of Trumpiness in their states. It looks as if Trump will eventually win Michigan by a couple 10ths of a percentage point — results aren’t finalized yet — but Michigan Sen. Debbie Stabenow doesn’t have as much to worry about as Heitkamp, given that Trump won North Dakota by 36 percentage points. I translated Trump’s margin of victory or defeat in each state onto a 5-point scale, as detailed in the footnotes.
Calculating the Trump support score. Finally, I estimated each senator’s overall likelihood to support Trump by averaging the three categories, but with a twist: I put more weight on the state’s electoral environment if the senator is up for re-election soon. In particular, I gave the electoral incentive category 1.5 times the weight of the other categories if the senator is up for re-election in 2018, the same weight as the other categories if he or she is up in 2020, and a weight of 0.5 if he or she was just elected and isn’t on the ballot again until 2022.
Here are the scores for the 51 or 52 Republican senators, ranked in inverse order of their Trump support score.
SENATORSTATERE-ELECT YEARISSUE ALIGNMENTPERSONAL SUPPORTELECTORAL INCENTIVETRUMP SUPPORT SCORECollinsME20202.532.52.7HellerNV20183.532.52.9McCainAZ2022333.53.1GardnerCO2020432.53.2PortmanOH20223343.2MurkowskiAK2022334.53.3FlakeAZ20183.533.53.4GrahamSC2020424.53.5LeeUT20223.534.53.5ToomeyPA20224433.8PaulKY20223453.8RubioFL20224433.8SullivanAK2020434.53.8CapitoWV20203.53.554.0RoundsSD20203454.0CruzTX20184444.0BoozmanAR20223.5454.0ThuneSD20223.5454.0TillisNC20204.543.54.0HatchUT20183.544.54.1BluntMO2022354.54.1Kennedy*LA2022354.54.1SasseNE20204.5354.2RobertsKS20203.5454.2McConnellKY20203.5454.2CochranMS2020444.54.2CornynTX20203.5544.2GrassleyIA20223.5544.2IsaksonGA20223.5544.2JohnsonWI20224534.2CrapoID20224454.2BurrNC2022453.54.3ScottSC20224.544.54.3DainesMT20204454.3AlexanderTN20204454.3InhofeOK20204454.3ErnstIA20204544.3WickerMS20183.554.54.4MoranKS20223.5554.4LankfordOK20223.5554.4FischerNE20184454.4CottonAR20203.5554.5RischID20204.5454.5YoungIN2022454.54.5CorkerTN20183.5554.6HoevenND20224554.6ShelbyAL20224554.6SessionsAL20204554.7EnziWY20204554.7CassidyLA20204.554.54.7PerdueGA20205544.7BarrassoWY20184554.7Which Republicans might defy Trump?*Kennedy’s position is pending results of Dec. 10 runoff in Louisiana
Sources: OnTheIssues.org, Daniel Nichanian, David Wasserman
Collins, although she’s reportedly set to back Trump’s nomination of Jeff Sessions as Attorney General, is a good bet to be the most frequent Republican vote against Trump, not having much in common with him on the issues, never having endorsed him, and hailing from a blue state — although Maine was much closer than usual this year. Still, her vote alone wouldn’t be enough to block Trump.
Instead, there’s a set of five to 10 Republican senators who might defect from Trump, depending on the circumstances. One group consists of Republicans who might be on thin ice with swing voters if Trump proves to be an unpopular president. Heller — the only Republican from a Clinton state up for re-election in 2018 — probably faces the most acute electoral pressure. Democrats will also almost certainly make a serious play for Arizona Sen. Jeff Flake’s seat in 2018 given that Arizona is trending blue and they don’t have very many alternatives, and Flake was among the more consistent Republican critics of Trump over the course of the campaign. And Gardner will face a potential toss-up race in 2020.

Senators Susan Collins, John McCain, Dean Heller, Rob Portman and Lisa Murkowski.
Getty Images
On the flip side are Republicans who might be free to defy Trump because they don’t face much electoral pressure. McCain, who just won re-election in Arizona, was a thorn in the side of George W. Bush early in his first term and could do the same to Trump. Portman, Paul, Alaska Sen. Lisa Murkowski and Utah Sen. Mike Lee also won re-election last week by commanding margins and could afford to defy Trump if they have a philosophical disagreement with him. Graham, up for re-election in 2020 and never having been all that popular with the Republican base to begin with, is in a somewhat riskier position.
But if it won’t always be that easy for Trump to rustle up support from 50 Republicans, there are also times when he can probably win votes from some Democrats:
SENATORSTATERE-ELECT YEARISSUE ALIGNMENTPERSONAL SUPPORTELECTORAL INCENTIVETRUMP SUPPORT SCOREHeitkampND20183.5153.4Campbell*LA2022334.53.3ManchinWV20183153.3TesterMT20182.5153.1DonnellyIN2018314.53.1McCaskillMO20182.514.52.9BrownOH20181142.3StabenowMI20182132.1KlobucharMN20182132.1CaseyPA20182132.1HassanNH20222.5132.0WarnerVA20203122.0ShaheenNH20202132.0KingME2018212.51.9BaldwinWI20181131.9NelsonFL20181131.9PetersMI20201.5131.8KaineVA20182121.7MerkleyOR20202.511.51.7FrankenMN20201131.7HeinrichNM20181.5121.6BennetCO20221.512.51.5Cortez MastoNV20221.512.51.5BookerNJ2020211.51.5CoonsDE2020211.51.5CarperDE2018211.51.5MurphyCT20181.511.51.4SchatzHI20202111.3UdallNM20201121.3BlumenthalCT20221.511.51.3WydenOR20221.511.51.3CantwellWA2018111.51.2WhitehouseRI2018111.51.2MenendezNJ2018111.51.2HarrisCA20221.5111.2DurbinIL2020111.51.2ReedRI2020111.51.2FeinsteinCA20181.5111.1GillibrandNY20181.5111.1DuckworthIL2022111.51.1MurrayWA2022111.51.1Van HollenMD20221111.0HironoHI20181111.0MarkeyMA20201111.0WarrenMA20181111.0LeahyVT20221111.0CardinMD20181111.0SandersVT20181111.0SchumerNY20221111.0Which Democrats might support Trump?*Campbell’s position is pending results of Dec. 10 runoff in Louisiana
Sources: OnTheIssues.org, Daniel Nichanian, David Wasserman
Heitkamp, Manchin and Donnelly (and Campbell, if he wins the Louisiana runoff) are probably the biggest defection risks for Democrats, not being all that far apart from Trump on the issues and coming from extremely red states that are voting again in 2018. Sen. Jon Tester of Montana and Sen. Claire McCaskill of Missouri also face tough re-election bids, but they’re further removed from Trump on the issues and have a track record of standing with their party on major votes.

Senators Heidi Heitkamp, Joe Manchin, Joe Donnelly, Jon Tester and Claire McCaskill.
Getty Images
But if the bad news for Democrats is that three to six of their votes could potentially be in play depending on the issue, the good news is that the rest of their senators are likely to be pretty unified. Because Democrats lost so many Senate races in swing states in 2014 and 2016, most of their remaining senators come from reliably blue states, and also have reliably liberal voting records. Some 43 Democrats have a Trump support score of 2.0 or lower, which is two more than they need to sustain a filibuster.
In short, the Senate — after a relatively dormant period during President Obama’s second term — will be the center of attention again once Trump enters office. There will potentially be a fair amount of party crossover, with Democratic senators supporting Trump and Republican ones opposing him, sometimes on the same vote. Relatively minor differences in Trump’s popularity could make a big difference in whether his agenda is passed or stymied, as these senators calculate the impact of their vote in 2018 or 2020. And special elections — such as the one that brought Massachusetts’ Scott Brown into the Senate in 2010 — could make a big difference. But with a large GOP majority in the House of Representatives, the Senate will be the closest thing to a check on Trump’s power until voters go to the polls again.
CORRECTION (Nov. 21, 10:41 a.m.): A previous version of this article misidentified one of the two Republican-controlled Senate seats Democrats won in 2016. It was New Hampshire, not Nevada.
CORRECTION (Nov. 21. 12:24 p.m.): A previous version of this article included tables that incorrectly calculated each senator’s Trump support score. The calculation did not properly weight the score based on the year in which the senator is up for re-election, as the article stated. The tables have been corrected to match the calculation method described in the article, and the relative ranking of some senators has shifted slightly as a result. In addition, a table mistakenly listed Senator-elect Kamala Harris of California and Sen. Patty Murray of Washington as being up for re-election in 2020. They will next be on the ballot in 2022.

November 14, 2016
Politics Podcast: The Transition Begins
The FiveThirtyEight Politics podcast crew uses new data to assess the conventional wisdom about the 2016 election and looks at President-elect Donald Trump’s first decisions during the transition.
Check back soon for a partial transcript.
You can listen to the episode by clicking the “play” button above or by downloading it in iTunes, the ESPN App or your favorite podcast platform. If you are new to podcasts, learn how to listen.
The FiveThirtyEight Politics podcast publishes Monday evenings, with occasional special episodes throughout the week. Help new listeners discover the show by leaving us a rating and review on iTunes. Have a comment, question or suggestion for “good polling vs. bad polling”? Get in touch by email, on Twitter or in the comments.

Will The Electoral College Doom The Democrats Again?
Last week’s election produced the widest gap between the Electoral College and the popular vote in a generation — a result of Hillary Clinton racking up huge margins in populous coastal states such as California and New York while narrowly losing several Midwestern battlegrounds to Donald Trump. Were this pattern to continue, Democrats could be at a significant Electoral College disadvantage.
Clinton, who’s currently leading in the popular vote by 0.6 percentage points and whose advantage should increase — probably to between 1.5 and 2.0 points — as additional ballots are counted, became the fourth candidate to lose the Electoral College while winning the popular vote. She joins Al Gore (2000), Grover Cleveland (1888) and Samuel Tilden (1876). But Tilden’s loss to Rutherford B. Hayes in 1876 was, in part, because Colorado — which had newly joined the union and said it didn’t have time to run an election — appointed its electors to Hayes via its state legislature. Thus, Clinton is likely to win the popular vote by the widest margin of any Electoral College loser in an election in which all states voted, surpassing Cleveland’s 0.8-percentage-point margin in 1888.
The good news for Democrats is that political coalitions change quickly, and even relatively minor changes can shift the Electoral College advantage from one party to the other. It’s possible to determine which party had the Electoral College edge even when it didn’t produce a different winner from the popular vote. For example, we can say that President Obama had the Electoral College advantage in 2012 and would have been favored to win it if the popular vote had been tied.
We can determine this by means of FiveThirtyEight’s tipping-point calculation. It works like this: Sort the states in order of the margin of victory or defeat for the Republican candidate, starting with the most Republican state (in Tuesday’s election, this was Wyoming, for example). Count up the cumulative number of electoral votes in these states, awarding zero votes for any state won by a third-party candidate. Whatever state puts the Republican over the top to an overall majority — which currently requires 270 electoral votes — is a tipping-point state. Next, do the same calculation in reverse, starting with the most Democratic state. Usually this produces the same result, but it can differ if there were states won by third parties or if there could have been an Electoral College tie. Thus, each election has one or two tipping-point states.
In 2012, for example, the tipping-point state was Colorado, which Obama won by 5.4 percentage points. If every state had moved toward Mitt Romney by 3.9 percentage points, yielding a tied national popular vote, Obama would still have won Colorado by 1.5 points — and every other state he originally won by more than 1.5 points — and thereby the Electoral College.
In Tuesday’s election, the tipping-point state will probably wind up being Pennsylvania, where Trump leads by 1.1 percentage points based on ballots counted so far — although it’s possible that it will be displaced by Florida (Trump +1.2) or Wisconsin (+0.9) before results are certified. This is an interesting trio of states in that Pennsylvania and Wisconsin were previously considered part of Democrats’ “blue wall,” while Florida has been slightly Republican-leaning relative to the national average in recent elections. It’s possible that in 2020 and beyond, Florida will be more of a necessity than a luxury for Democrats and part of their easiest path to 270 electoral votes.
There’s a relatively wide gap between Clinton’s losing margins in these states and her winning margin in the national popular vote. In 2012, Obama’s margin in the popular vote expanded from 2.7 percentage points on the Monday after the election to 3.9 points in the final count as additional mail ballots from California and Washington state — and provisional ballots from other states, mostly from cities that vote heavily Democratic — were counted and added to his tally. Clinton’s lead is likely to grow by a similar margin, which would eventually yield a popular-vote victory of 1.8 points. That would produce almost a 3-point gap — 2.9 percentage points, to be precise — between the tipping-point state and the popular vote, the largest in any election since 1948:
YEARNATIONAL POPULAR VOTETIPPING-POINT STATE(S)TIPPING-POINT MARGINELECTORAL COLLEGE EDGE2016D__+1.8*PennsylvaniaR__+1.1R_+2.92012D__+3.9_ColoradoD__+5.4D_+1.52008D__+7.3_ColoradoD__+9.0D_+1.72004R__+2.5_OhioR__+2.1D_+0.42000D__+0.5_FloridaR__+0.0R_+0.51996D__+8.5_PennsylvaniaD__+9.2D_+0.71992D__+5.6_TennesseeD__+4.7R_+0.91988R__+7.7_MichiganR__+7.9R_+0.21984R_+18.2_MichiganR_+19.0R_+0.81980R__+9.7_IllinoisR__+7.9D_+1.81976D__+2.1_WisconsinD__+1.7R_+0.41972R_+23.1_Maine_and OhioR_+22.3D_+0.81968R__+0.7_Illinois_and OhioR__+2.6R_+1.91964D_+22.6_WashingtonD_+24.6D_+2.01960D__+0.2_New_Mexico and MissouriD__+0.6D_+0.41956R_+15.4_FloridaR_+14.5D_+0.91952R_+10.9_MichiganR_+11.5R_+0.61948D__+4.5_California_and IllinoisD__+0.8R_+3.71944D__+7.5_New_YorkD__+5.0R_+2.51940D__+9.9_PennsylvaniaD__+6.9R_+3.01936D_+24.3_OhioD_+20.6R_+3.71932D_+17.8_IowaD_+17.7R_+0.11928R_+17.4_IllinoisR_+14.7D_+2.71924D_+26.6_New_YorkD_+25.2R_+1.41920D_+31.2_Rhode_IslandD_+26.2R_+5.01916D__+3.1_CaliforniaD__+0.4R_+2.71912D_+17.0_New_Jersey and IowaD_+18.7D_+1.71908R__+8.5_West_VirginiaR_+10.2R_+1.71904R_+18.8_New_JerseyR_+18.6D_+0.21900R__+6.2_IllinoisR__+8.4R_+2.21896R__+4.3_OhioR__+4.8R_+0.51892D__+3.0_Connecticut_and IllinoisD__+3.2D_+0.21888D__+0.8_New_YorkR__+1.1R_+1.91884D__+0.6_New_YorkD__+0.1R_+0.51880R__+0.2_New_YorkR__+1.9R_+1.71876D__+3.0_South_CarolinaR__+0.5R_+3.51872R_+11.8_OhioR__+7.1D_+4.71868R__+5.3_North_CarolinaR__+6.8R_+1.51864R_+10.1_IllinoisR__+8.8D_+1.3The Electoral College advantage ebbs and flows* 2016 popular vote margin is projected
The “Electoral College edge” is the margin in the tipping-point state minus the margin in the national popular vote. Where there are two tipping-point states, their margins are averaged together.
Sources: Dave Leip’s Atlas of U.S. Presidential Elections, David Wasserman
In recent elections, with both parties generally being at least somewhat competitive in all four major regions of the country, there usually hasn’t been such a large gap between the tipping-point state and the popular vote. And small gaps have often reversed themselves. Gore, of course, lost the Electoral College in 2000 to George W. Bush despite winning the popular vote. But four years later, Democrats had a slight Electoral College advantage, as John Kerry came slightly closer to winning Ohio, the tipping-point state that year, than to the national popular vote. In general, in fact, there’s almost no correlation between which party has the Electoral College advantage in one election and which has it four years later. It can bounce back and forth based on relatively subtle changes in the electorate.
The major exception was in the first half of the 20th century, when Republicans persistently had an Electoral College advantage because Democrats racked up huge margins in the South, yielding a lot of wasted votes as far as the Electoral College is concerned. This nearly led to a massive Electoral College-popular vote split in 1948. That year, Democratic incumbent Harry Truman won the popular vote by 4.5 percentage points. But if California, Ohio and Illinois — which Truman won by less than 1 percentage point each and by less than 60,000 votes total — had flipped to Republican Thomas Dewey, Dewey would have won the Electoral College.
The question is whether Democrats are re-entering something akin to the “Solid South” era, except with their votes concentrated in more urban coastal states instead of the South. In this respect, California — where Clinton leads by 28 percentage points, more than Obama’s 23-point margin in 2012 — represents lots of wasted votes, at least in terms of the Electoral College.
At the same time, Arizona, Georgia and Texas — which together have 65 electoral votes — all became more Democratic this year. Winning Texas alone would have been enough for Clinton to just barely win the Electoral College with 270 electoral votes.
And it isn’t necessarily the case that states such as Pennsylvania and Michigan have permanently gone from blue-leaning to purple or even red-leaning. Sometimes, states behave unpredictably for one or two elections before reverting back to the mean — for instance, Obama won Indiana in 2008 before it returned to being strongly Republican. The dynamics of 2020 will also be different in that Democrats will be the challenging party instead of the incumbents.
The risk to Democrats is being caught in between, with the Midwest continuing to drift redder and Arizona and the like not yet ready to become true swing states. That’s what happened to Clinton this year, yielding about the most painful loss imaginable.

November 11, 2016
‘Model Talk’ Debriefs The 2016 Results
The FiveThirtyEight Elections podcast takes stock of how well our forecast model predicted the result of the 2016 presidential election.
Have questions you want answered on the podcast? Get in touch by email, on Twitter or in the comments. The Elections podcast will continue through Inauguration Day at least, with episodes every Monday afternoon from now on. Be sure to subscribe so you don’t miss a new episode.
You can listen to the episode by clicking the “play” button above or by downloading it in iTunes, through the ESPN App or on your favorite podcast platform. If you are new to podcasts, learn how to listen.

Why FiveThirtyEight Gave Trump A Better Chance Than Almost Anyone Else
Based on what most of us would have thought possible a year or two ago, the election of Donald Trump was one of the most shocking events in American political history. But it shouldn’t have been that much of a surprise based on the polls — at least if you were reading FiveThirtyEight. Given the historical accuracy of polling and where each candidate’s support was distributed, the polls showed a race that was both fairly close and highly uncertain.
This isn’t just a case of hindsight bias. It’s tricky to decide what tone to take in an article like this one — after all, we had Hillary Clinton favored. But one of the reasons to build a model — perhaps the most important reason — is to measure uncertainty and to account for risk. If polling were perfect, you wouldn’t need to do this. And we took weeks of abuse from people who thought we overrated Trump’s chances. For most of the presidential campaign, FiveThirtyEight’s forecast gave Trump much better odds than other polling-based models. Our final forecast, issued early Tuesday evening, had Trump with a 29 percent chance of winning the Electoral College. By comparison, other models tracked by The New York Times put Trump’s odds at: 15 percent, 8 percent, 2 percent and less than 1 percent. And betting markets put Trump’s chances at just 18 percent at midnight on Tuesday, when Dixville Notch, New Hampshire, cast its votes.
So why did our model — using basically the same data as everyone else — show such a different result? We’ve covered this question before, but it’s interesting to do so in light of the actual election results. We think the outcome — and particularly the fact that Trump won the Electoral College while losing the popular vote — validates important features of our approach. More importantly, it helps to explain why Trump won the presidency.
A small, systematic polling error made a big differenceClinton was leading in the vast majority of national polls, and in polls of enough states to get her to 270 electoral votes, although her position in New Hampshire was tenuous in the waning days of the campaign. So there wasn’t any reasonable way to construct a polling-based model that showed Trump ahead. Even the Trump campaign itself put their candidate’s chances at 30 percent, right about where FiveThirtyEight had him.
But people mistake having a large volume of polling data for eliminating uncertainty. It doesn’t work that way. Yes, having more polls helps to a degree, by reducing sampling error and by providing for a mix of reasonable methodologies. Therefore, it’s better to be ahead in two polls than ahead in one poll, and in 10 polls than in two polls. Before long, however, you start to encounter diminishing returns. Polls tend to replicate one another’s mistakes: If a particular type of demographic subgroup is hard to reach on the phone, for instance, the polls may try different workarounds but they’re all likely to have problems of some kind or another. The cacophony of headlines about how “CLINTON LEADS IN POLL” neglected the fact that these leads were often quite small and that if one poll missed, the others potentially would also. As I pointed out on Wednesday, if Clinton had done only 2 percentage points better across the board, she would have received 307 electoral votes and the polls would have “called” 49 of 50 states correctly.
FiveThirtyEight’s probabilities are based on the accuracy of polling averages in presidential elections dating back to 1972. That is, our models are based on how accurate polls have or haven’t been historically, instead of making idealized assumptions about them. For instance, national polling averages in the final week of the campaign have missed the actual outcome by an average of about 2 percentage points. That’s larger than you’d expect from sampling error alone and suggests that the polls sometimes suffer from systematic error: Almost all of the them are off in the same direction.
Historically, meanwhile, the error is larger in state polls than in national polls. That’s because there’s less of an opportunity for polling errors to cancel each other out. Suppose, for example, that the polls underestimate Clinton’s performance with Hispanic voters, but overestimate it among white voters without college degrees. In national polls, the overall effect might be relatively neutral. But the state polls will err in opposite directions, overestimating Clinton’s performance in states with lots of noncollege white voters but underestimating it in Hispanic-heavy states.
That’s something like what happened this year. In fact, the error in national polls wasn’t any worse than usual. Clinton was ahead by 3 to 4 percentage points in the final national polls. She already leads in the popular vote, and that lead will expand as mail ballots are counted from California and Washington, probably until she leads in the popular vote by 1 to 2 percentage points overall. That will mean only about a 2-point miss for the national polls. They may easily wind up being more accurate than in 2012, when they missed by 2.7 percentage points.
But what about the state polls? They were all over the place. Clinton actually overperformed FiveThirtyEight’s adjusted polling average in 11 states and the District of Columbia. The problem is that these states were California, Hawaii, Illinois, Massachusetts, Nevada, New Jersey, New York, New Mexico, Oregon, Rhode Island and Washington. Since all of these states except for Nevada and perhaps New Mexico were already solidly blue, that only helped Clinton to run up the popular vote margin in states whose electoral votes she was already assured of. That’s especially true of Calfornia, where Clinton both beat her polls by more than 5 percentage points and substantially improved on Barack Obama’s performance from 2012.
VIDEO: Nate Silver discusses the method to our forecast Clinton collapsed in the Midwest, destroying her Electoral College chances
Conversely, Clinton underperformed her polls significantly throughout the Midwest and the Rust Belt: by 4 points in Michigan and Minnesota, by 5 points in Pennsylvania and by 6 points in Iowa, Ohio and Wisconsin. Clinton just narrowly held on to win Minnesota, and she hadn’t been favored in Iowa or Ohio to begin with. But Michigan, Wisconsin and Pennsylvania flipped to Trump and cost her the election. (Otherwise, she’d have wound up with 278 electoral votes.)

FiveThirtyEight’s models consider possibilities such as these. In addition to a systematic national polling error, we also simulate potential errors across regional or demographic lines — for instance, Clinton might underperform in the Midwest in one simulation, or there might be a huge surge of support among white evangelicals for Trump in another simulation. These simulations test how robust a candidate’s lead is to various types of polling errors.
In fact, Clinton’s Electoral College leads weren’t very robust. And the single biggest reason was because of her relatively weak polling in the Midwest, especially as compared to President Obama four years ago. Because the outcomes in these Midwestern states were highly correlated, having problems in any one of them would mean that Clinton was probably having trouble in the others, as well.

There just aren’t enough electoral votes in swing states elsewhere in the country for a Democrat to survive a Midwestern collapse. Michigan, Wisconsin, Minnesota, Ohio, Iowa and Pennsylvania (which is not a part of the geographic Midwest, but which functions like a Midwestern state politically) together have 80 electoral votes. Lose all of those states, and a Democrat would still lose even with Florida, North Carolina, Colorado, Nevada, Virginia in her column.
Eventually, Democrats will find new battleground states. Clinton came closer to winning Arizona and Georgia than she did to winning Ohio, and closer to winning Texas than she did to winning Iowa. By 2024 or 2028, these may all have become purple states. In the interim, the Electoral College could get awkward for Democrats, with states such as Pennsylvania having gone from bluish to reddish, and states like Arizona and Georgia becoming more purple, but taking their time to get there. The Electoral College was already pretty awkward for them this year, obviously, which is why our model showed more than a 10 percent chance of a popular vote/Electoral College split in Trump’s favor.
Undecideds and late deciders broke for TrumpThe single most important reason that our model gave Trump a better chance than others is because of our assumption that polling errors are correlated. No matter how many polls you have in a state, it’s often the case that all or most of them miss in the same direction. Furthermore, if the polls miss in one direction in one state, they often also miss in the same direction in other states, especially if those states are similar demographically.
There were some other factors too, however, that helped Trump’s chances in our forecast. One is that our model considers the number of undecided and third-party voters when evaluating the uncertainty in the race. There were far more of these voters than in recent, past elections: About 12 percent of the electorate wasn’t committed to either Trump or Clinton in final national polls, as compared with just 3 percent in 2012. That’s a big part of the reason our model was quite confident about Obama’s chances in 2012, but not all that confident about Clinton’s chances this year.
Indeed, late-deciding voters broke toward Trump, according to exit polls of most swing states. Or at least, that was the case in states where Trump outperformed his polls, such as in Pennsylvania and Wisconsin. It wasn’t as true in states such as Nevada and Virginia, where Clinton matched or exceeded her polls:
VOTE SHARE OF THOSE WHO DECIDED THE WEEK BEFORE THE ELECTIONSTATECLINTONTRUMPWisconsin30%59%Minnesota3153Utah1941Iowa3454Pennsylvania3754Florida3855Maine3349New Hampshire3752Michigan3950North Carolina4149New Mexico4146Ohio4346Virginia4542Nevada4540Georgia5242Voters who decided in the final week went strongly for TrumpThe exit poll did not provide a breakout of voters who decided in the last week in Colorado or Arizona, because the sample size was too small.
Source: National Exit Poll
Pollsters simply can’t do much about voters who make up their minds only after the survey is completed. (And making inferences is a guessing game: It’s sometimes said that undecideds tend to break to the challenger, but the empirical evidence on this is mixed. Obama won late-deciding votes in 2012, for example.) But modelers can do something about it, by allowing for more uncertainty in the forecast when there are more undecideds. If only 3 percent of the electorate is undecided, then winning undecideds 3-2 — as Trump did in several swing states — will shift the overall outcome by less than 1 percentage point. But if 12 percent of the electorate is undecided, winning them by that ratio will produce a net swing of 2 to 3 points toward a candidate, potentially letting him overtake the front-runner.
Trump was also gaining ground on Clinton over the final two weeks of the campaign (although with a slight rebound for Clinton in the last 48 hours or so). There’s a lot of room to debate how much a model should chase down a polling swing when one occurs in, say, July or August. FiveThirtyEight’s polls-only model is notoriously aggressive about trying to reflect the public polls as they appear on the day of the forecast, even if it makes for a swingier result. Our polls-plus model, and most other forecasts, are more conservative and have various techniques for discounting polling swings. But as Election Day approaches, we think models ought to be fairly aggressive about detecting polling movement. (Polls-plus stops discounting polling swings by the end of the campaign). If there’s a late-breaking news event, such as FBI Director James Comey’s letter to Congress on Oct. 28, even a “temporary” effect may still weigh on voters at the time they cast their ballot.
A failure of conventional wisdom more than a failure of pollingIt’s one thing to criticize pollsters — or polling-based forecasts — if your personal prediction came closer to getting the outcome right. But I’d assert that most mainstream journalists would have given Trump much lower odds than the 30 percent chance that FiveThirtyEight gave him, and that most campaign coverage was premised on the idea that Clinton was all but certain to become the next president. Both reporters and pundits criticized FiveThirtyEight and other polling sites for not accounting for early voting data, for example, on the idea that it portended good news for Clinton that our model ignored. As we’ve discovered in the past, however, it’s hard to make inferences from early voting and attempts to do have a fairly bad track record — as they did this year.
We also received a lot of criticism from Democratic partisans in the closing weeks of the campaign — more than we did from Trump supporters — because they thought we didn’t have Clinton as a heavy enough favorite. That’s unusual. We’ve forecasted enough races over the years to have taken criticism from almost every side. But in the past, it’s always been the trailing candidate’s supporters who gave us more grief.
In this respect, there’s another parallel between Trump’s victory on Tuesday, and the United Kingdom’s vote to leave the European Union in June. Brexit polls showed the race almost tied, with “Remain” leading by perhaps half a percentage point. In fact, “Leave” won by about 4 percentage points. The polls took a lot of criticism even though they’d shown “Leave” at almost even-money, whereas betting markets — and the conventional wisdom from London-based reporters — had “Remain” heavily favored to prevail. Londoners may have interpreted the data in selective ways because of the “unthinkability” of Britain’s leaving the EU to people in their social circles.
Tuesday’s results were similar. We strongly disagree with the idea that there was a massive polling error. Instead, there was a modest polling error, well in line with historical polling errors, but even a modest error was enough to provide for plenty of paths to victory for Trump. We think people should have been better prepared for it. There was widespread complacency about Clinton’s chances in a way that wasn’t justified by a careful analysis of the data and the uncertainties surrounding it.

November 9, 2016
What A Difference 2 Percentage Points Makes
Here’s the Electoral College map we’re going to end up with, assuming that every uncalled state goes to the candidate leading in the vote count there as of 4 p.m. Eastern time on Wednesday. There’s a sea of red for President-elect Donald Trump. He earned 306 electoral votes and became the first Republican since 1988 to win Michigan, Wisconsin or Pennsylvania.
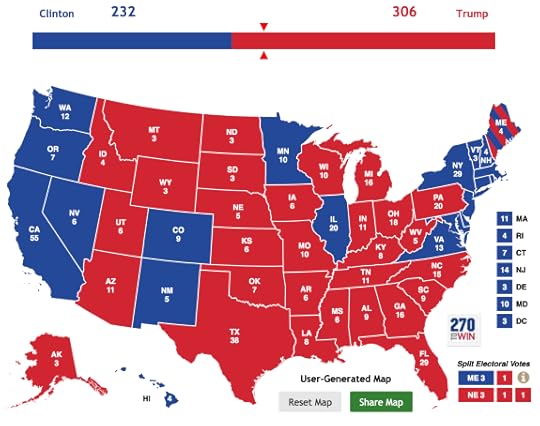
Just think about all the implications of this:
The Democrats’ supposed “blue wall” — always a dubious proposition — has crumbled. Indeed, with Hillary Clinton’s defeat, Democrats may have to rebuild their party from the ground up.But the Republican Party is also forever changed. The GOP has learned that there’s a bigger market for populism, and a far smaller one for movement conservatism, than many of us imagined. The Party of Reagan has been supplanted by the Party of Trump.The divide between cultural “elites” in urban coastal cities and the rest of the country is greater than ever. Clinton improved on President Obama’s performance in portions of the country, such as California, Atlanta and the island of Manhattan. But whereas Obama won Iowa by 10 percentage points in 2008, Clinton lost it by 10 points.America hasn’t put its demons — including racism, anti-Semitism and misogyny — behind it. White people still make up the vast majority of the electorate, particularly when considering their share of the Electoral College, and their votes usually determine the winner.One fact that doesn’t fit very well into this narrative is that Clinton leads in the popular vote count. She should eventually win the popular vote by 1 to 2 percentage points, and perhaps somewhere on the order of 1.5 million to 2 million votes, once remaining mail-in ballots from California and Washington are counted, along with provisional ballots in other states.
But ignore that for now — elections, after all, are contested in the Electoral College. (Hence the name of this website.) So here’s another question. What would have happened if just 1 out of every 100 voters shifted from Trump to Clinton? That would have produced a net shift of 2 percentage points in Clinton’s direction. And instead of the map you see above, we’d have wound up with this result in the Electoral College instead:
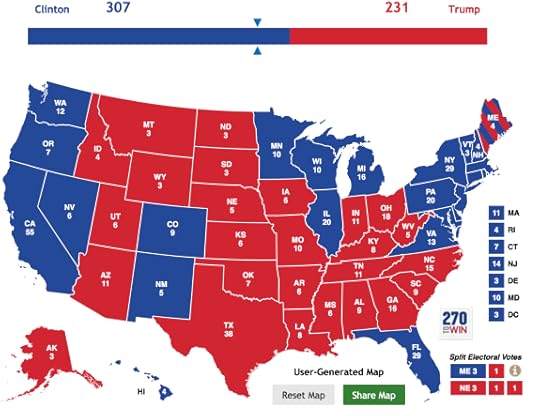
Michigan, Wisconsin, Pennsylvania and Florida flip back to Clinton, giving her a total of 307 electoral votes. And she’d have won the popular vote by 3 to 4 percentage points, right where the final national polls had the race and in line with Obama’s margin of victory in 2012. If this had happened, the interpretation of the outcome would have been very different — something like this, I’d imagine:
Republicans simply can’t appeal to enough voters to have a credible chance at the Electoral College. While states like Ohio and Iowa might be slipping away from Democrats, they’ll be more than made up for by the shift of Arizona, North Carolina and Florida into the blue column as demographic changes take hold. Democrats are the coalition of the ascendant.The United States was more than ready for the first woman president. And they elected her immediately after the first African-American president. With further victories for liberals over the past several years on issues ranging from gay rights to the minimum wage, the arc of progress is unmistakable.American political institutions are fairly robust. When a candidate like Trump undermines political norms and violates standards of decency, he’s punished by the voters.In light of Trump’s narrow victory, these arguments sound extremely unconvincing. But they’re exactly what we would have been hearing if just 1 out of 100 voters had switched from Trump to Clinton. So consider that there might be at least partial truth in some of these points.
Likewise, if Clinton had just that small, additional fraction of the vote, people would be smugly dismissing the arguments in the first set of bullet points — even though they, too, would have been just 2 percentage points away from seeming incredibly prescient.
Interpretation of the polling would also have been very different. If Clinton had done just 2 points better, pollsters would have called the popular-vote margin almost on the nose and correctly identified the winner in all states but North Carolina.
We’ll have more to say about the polling in the coming days. But to a first approximation, people are probably giving the polls a little bit too much blame. National polls will eventually miss the popular vote by about 2 percentage points, which is right in line with the historical average (and, actually, a bit better than national polls did in 2012). State polls had considerably more problems, underestimating Clinton’s complete collapse of support among white voters without college degrees but also underestimating her support in states that have large Hispanic populations, such as New Mexico.
Given how challenging it is to conduct polls nowadays, however, people shouldn’t have been expecting pinpoint accuracy. The question is how robust Clinton’s lead was to even a small polling error. Our finding, consistently, was that it was not very robust because of the challenges Clinton faced in the Electoral College, especially in the Midwest, and therefore our model gave a much better chance to Trump than other forecasts did.
But that’s not very important. What’s important is that Trump was elected president. Just remember that the same country that elected Donald J. Trump is the one that elected Barack Hussein Obama four years ago. In a winner-take-all system, 2 percentage points can make all the difference in the world.

Elections Podcast: President Trump
The day after Donald Trump won the 2016 presidential election, our podcast crew gathered to discuss the path he took to secure the Electoral College while losing the popular vote, the demographic divide among the American electorate and where the country goes from here.
Have questions you want answered on the podcast? Get in touch by email, on Twitter or in the comments. The Elections podcast will continue through Inauguration Day at least, with episodes every Monday afternoon from now on. Be sure to subscribe so you don’t miss a new episode.
You can listen to the episode by clicking the “play” button above or by downloading it in iTunes, through the ESPN App or on your favorite podcast platform. If you are new to podcasts, learn how to listen.

November 8, 2016

Final Election Update: There’s A Wide Range Of Outcomes, And Most Of Them Come Up Clinton
Throughout the election, our forecast models have consistently come to two conclusions. First, that Hillary Clinton was more likely than not to become the next president. And second, that the range of possible Electoral College outcomes — including the chance of a Donald Trump victory, but also a Clinton landslide that could see her winning states such as Arizona — was comparatively wide.
That remains our outlook today in our final forecast of the year. Clinton is a 71 percent favorite to win the election according to our polls-only model and a 72 percent favorite according to our polls-plus model. (The models are essentially the same at this point, so they show about the same forecast.) This reflects a meaningful improvement for Clinton in the past 48 hours as the news cycle has taken a final half-twist in her favor. Her chances have increased from about 65 percent.
Our forecast has Clinton favored in states and congressional districts totaling 323 electoral votes, including all the states President Obama won in 2012 except Ohio and Iowa, but adding North Carolina. However, because our forecasts are probabilistic, and because Clinton’s leads in North Carolina and Florida especially are tenuous, the average number of electoral votes we forecast for Clinton is 302, which would be equivalent to her winning either Florida or North Carolina but not both.

Our forecast has Clinton winning the national popular vote by 3.6 percentage points, which is similar to her lead in recent national polls. Her chances of winning the popular vote are 81 percent, according to our forecast.
So what’s the source of all the uncertainty? And why does the same model that gave Mitt Romney only a 9 percent chance of winning the Electoral College on the eve of the 2012 election put Trump’s chances about three times higher — 28 percent — this year? It basically comes down to three things:
First, Clinton’s overall lead over Trump — while her gains over the past day or two have helped — is still within the range where a fairly ordinary polling error could eliminate it.Second, the number of undecided and third-party voters is much higher than in recent elections, which contributes to uncertainty.Third, Clinton’s coalition — which relies increasingly on college-educated whites and Hispanics — is somewhat inefficiently configured for the Electoral College, because these voters are less likely to live in swing states. If the popular vote turns out to be a few percentage points closer than polls project it, Clinton will be an Electoral College underdog.Let me briefly go into detail on each one of these points.
Polls are good — but not perfectThe track record of polling in American presidential elections is pretty good but a long way from perfect, and errors in the range of 3 percentage points have been somewhat common in the historical record. Of note, for instance, is that Obama beat his national polling average by nearly 3 points in 2012, although state polls did a better job of pegging his position. In 2000, Al Gore was behind by about 3 points in the final national polling average but won the popular vote. In 1996, Bill Clinton was ahead in national polls by about 12 points, but won by 8.5.
In three of the last five presidential elections, in other words, there was a polling error the size of which would approximately wipe out Clinton’s popular vote lead — or alternatively, if the error were in her favor, turn a solid victory into a near-landslide margin of 6 to 8 percentage points. There’s also some chance of a larger error still. In 1980, Ronald Reagan led in final national polls by slightly less than Clinton does now, but wound up winning the popular vote by almost 10 percentage points.
Three- or 4-point polling errors should also be familiar from other contexts. Republicans beat their polls by 3 or 4 percentage points, on average, in competitive Senate and gubernatorial races in the 2014 midterms. Brexit was about a 4-point polling error, and the error in the 2015 U.K. general election was larger — Conservatives’ margin over Labour was understated by about 6 percentage points. We often get annoyed when people express shock after outcomes like these occur — polling is a tricky business — only to expect polls to be infallible the next time around.
Undecided voters contribute to uncertaintyIn our national polling average, about 12 percent of voters are either undecided or say they’ll vote for a third-party candidate. While this figure has declined over the past few weeks, it’s still much higher than in recent elections. Just 3 percent of voters were undecided at the end of the 2012 race, for example, according to RealClearPolitics. Clinton’s share of the vote — about 46 percent in national polls — is low for a leading candidate, and Trump’s share of 42 percent is the lowest of any candidate since Bob Dole in 1996.
FINAL NATIONAL POLLING AVERAGEYEARDEM CANDIDATEGOP CANDIDATEUNDECIDED/OTHER2000Gore43.6%Bush46.8%Undecided/other9.6%2004Kerry47.4Bush48.9Undecided/other3... are far more undecided voters this yearSource: RealCLEARPOLITICS (2000-2012), FiveThirtyEight Polls-only Model (2016)
As ought to be fairly intuitive, undecided voters make for a more uncertain outcome. If two-thirds of undecideds were to break for Trump, for instance, the candidates would tie in the popular vote at almost 50-50. If Clinton were to win undecideds by that margin, she’d claim a 7- or 8- point popular vote victory. Granted, these outcomes are not totally realistic, given that the third-party candidates will get at least some votes. But a candidate polling at just 46 percent of the vote can’t take her victory for granted, and one polling at 42 percent is at risk of a blowout if late-deciding voters move against him.
Undecided voters contribute significantly to uncertainty in the FiveThirtyEight forecast. If there were half as many undecideds — in line with recent past elections but still more than in 2012 — Clinton’s chances of winning the Electoral College would rise to 78 percent in our forecast, and her chances of winning the popular vote would be 89 percent, higher than Obama’s were in our final 2012 forecast.
Polling errors are correlated across states — and could put Clinton at risk or put red states in playBy definition, if Trump or Clinton beat their polls by 3 points nationally, they’ll also do so by 3 points in the average state. If anything, in fact, the gain might be larger than that in the average swing state because swing states tend to have more swing voters than non-swing states do. (In FiveThirtyEight parlance, they’re more elastic — more responsive to changes in national trends.) Here, for example, is how our polls-only model shows the swing states lining up if the polls are exactly right, if there’s a 3-point error in Clinton’s favor, or if there’s a 3-point error in Trump’s favor.
CLINTON’S PROJECTED MARGINSTATEPOLLS-ONLY FORECASTWITH 3-POINT NATIONAL ERROR IN CLINTON’S FAVORWITH 3-POINT NATIONAL ERROR IN TRUMP’S FAVORMaine+7.4+10.9+4.0Minnesota+5.8+8.9+2.7New Mexico+5.8+8.9+2.7Virginia+5.6+8.5+2.7Wisconsin+5.3+8.4+2.2Michigan+4.2+7.2+1.2Colorado+4.0+7.2+0.9Pennsylvania+3.7+6.6+0.8New Hampshire+3.6+7.1+0.0Nevada+1.2+4.2-1.8North Carolina+0.7+3.5-2.1Florida+0.7+3.6-2.3Maine CD-2+0.4+3.7-3.0Nebraska CD-2-1.8+1.2-4.7Ohio-1.9+1.1-4.9Arizona-2.2+0.8-5.3Iowa-2.9+0.3-6.1Georgia-4.0-1.4-6.7South Carolina-7.0-4.3-9.6Alaska-7.4-4.2-10.7How state forecasts would change if polls are slightly offIf there’s a 3-point error in Clinton’s favor, she’d be a heavy favorite to win Florida and North Carolina, and she would probably also flip Ohio, Arizona, Nebraska’s 2nd Congressional District and possibly Iowa to her column. Georgia would be highly competitive. Clinton would probably need a Reagan-in-1980 polling error in her favor — and not a mere ordinary polling error — to put states beyond Georgia in play, although there are some wild cards such as Utah and Alaska that could be competitive.
But if there’s a 3-point error against Clinton? That would still leave her with a narrow lead over Trump in the popular vote — by about the margin by which Gore beat Bush in 2000. But New Hampshire, which is currently the tipping-point state, would be exactly tied. Meanwhile, Clinton’s projected margin in Michigan, Pennsylvania and Colorado would shrink to about 1 percentage point, while Trump would be about 2 points ahead in Florida and North Carolina. It’s certainly not impossible that Clinton could win under those circumstances — her turnout operation might come in really handy — but she doesn’t have the Electoral College advantage that Obama did in 2012, when he led in states such as Ohio and Iowa and had larger leads than Clinton does in Michigan and Pennsylvania. In particular, Clinton could be vulnerable to a slump in African-American turnout.
Despite what you might think, we haven’t been trying to scare anyone with these updates. The goal of a probabilistic model is not to provide deterministic predictions (“Clinton will win Wisconsin”) but instead to provide an assessment of probabilities and risks. In 2012, the risks to to Obama were lower than was commonly acknowledged, because of the low number of undecided voters and his unusually robust polling in swing states. In 2016, just the opposite is true: There are lots of undecideds, and Clinton’s polling leads are somewhat thin in swing states. Nonetheless, Clinton is probably going to win, and she could win by a big margin.
VIDEO: Nate Silver discusses the final presidential forecast

Nate Silver's Blog

- Nate Silver's profile
- 730 followers

