
Nate Silver's Blog, page 116
November 7, 2016
Election Update: Clinton Gains, And The Polls Magically Converge
First things first: Hillary Clinton has a 70 percent chance of winning the election, according to both the FiveThirtyEight polls-only and polls-plus models. That’s up from a 65 percent chance on Sunday night, so Clinton has had a good run in the polls in the final days of the campaign. Clinton’s projected margin of victory in the popular vote has increased to 3.5 percent from 2.9 percent.
We’ll continue to collect polls through early Tuesday morning, at which point we’ll update the model for the last time and publish a more philosophical overview on the race. But I’m not sure how much more data we’re really expecting — most of it will probably just be state and national tracking polls that run one last update.
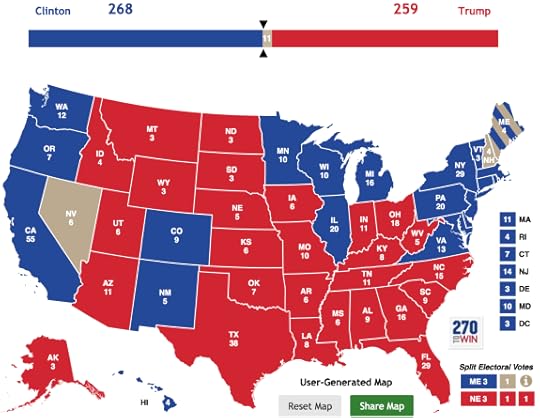
As a lot of you noticed, Nevada, North Carolina and Florida flipped from red to blue over the course of Monday. We don’t think that’s a particularly meaningful metric, because the forecasts are probabilistic — Clinton’s chances of winning Florida increased to 54 percent from 48 percent, for instance, which is nontrivial but not an especially large change. Still, we know it’s something a lot of readers follow. It’s unlikely that any further states will flip to Clinton in our final forecast, as she’s too far behind in Ohio, the next-closest state. It’s possible that Florida and North Carolina could flip back to Trump by tomorrow morning, though probably not Nevada, where Clinton’s lead is a bit larger.
Mostly, though, the number I have on my mind today is “4.” That’s because it kept coming up over and over as national polls were released today: It seemed like every pollster had Clinton leading by 4 percentage points. Here’s data from national polls that were conducted beginning on Oct. 28 or later:
DATESPOLLSTERTYPEGRADEMARGINNov. 3-6Monmouth UniversityLive telephoneA+Clinton +6Nov. 4-6Selzer & CompanyLive telephoneA+Clinton +3Nov. 3-6ABC/Washington PostLive telephoneA+Clinton +4Nov. 1-3Marist CollegeLive telephoneAClinton +1Nov. 3-6Fox NewsLive telephoneAClinton +4Nov. 3-5NBC/WSJLive telephoneA-Clinton +4Oct. 31-Nov. 4IpsosOnlineA-Clinton +4Nov. 1-4Angus ReidOnlineA-Clinton +4Nov. 3-6IBD/TIPPLive telephoneA-Trump +2Nov. 2-6CBS NewsLive telephoneA-Clinton +4Nov. 1-5RKM ResearchLive telephoneB+Clinton +3Nov. 4-7YouGovOnlineBClinton +4Nov. 1-2Gravis MarketingAutomated/onlineB-Clinton +2Oct. 31 – Nov. 6CVOTER InternationalOnlineC+Clinton +3Nov. 2-6Rasmussen ReportsAutomated/onlineC+Clinton +2Oct. 31 – Nov. 6SurveyMonkeyOnlineC-Clinton +6Nov. 4-5Morning ConsultOnline—Clinton +3Nov. 5-7The Times-Picayune/LucidOnline—Clinton +5Oct. 31 – Nov. 6USC Dornsife/LA TimesOnline—Trump +5Recent national polls show a 3- to 4-point Clinton lead, on averagePolls conducted beginning Oct. 28 or later.
Seven of the 19 polls have Clinton leading by 4 points; another four have her ahead by 3 points, then we have a smattering of 1’s, 2’s and 6’s — along with two pollsters, IBD/TIPP and Los Angeles/USC Dornsife, who still have Trump ahead. (We admire the L.A. Times poll for not changing its methodology in midstream, even though the poll has its issues.) On average, Clinton leads by 2.9 points in the polls, although the highest-rated pollsters have her a bit higher at 3.8 points, on average. As is usually the case, the range of national polls closely matches the FiveThirtyEight popular-vote forecast.
It’s worth raising an eyebrow, though, when the polls (other than the L.A. Times) show a range this tight at the end of an election, especially given that they’d diverged so much earlier in the campaign. That probably reflects some degree of herding — for instance, because pollsters stick surveys that seem to be outliers in a file drawer rather than publishing them. So the tight range of polls shouldn’t be taken to mean that everyone’s figured exactly how to poll this challenging election just in the nick of time. Still, the polls clearly agree that Clinton is the favorite, and perhaps has a slight wind at her back for Election Day.
Our Elections podcast previews the presidential race and the House and Senate contests.
CORRECTION (Nov. 7, 2016, 10:15 p.m.): An earlier version of the headline on the table in this article misstated Clinton’s average lead in recent polls. It is is 3 to 4 points, not 2 to 3 points.


Elections Podcast Countdown: Final Election Preview
As the 2016 campaign comes to a close, the FiveThirtyEight Elections podcast team is recording daily episodes. In our final pre-election installment, we assess the forecast model, discuss defining moments of the campaign and prepare for Election Day.
Here is a portion of our conversation that has been lightly edited for clarity:
Jody Avirgan (producer and podcast host): I think my main question for all of you — maybe we can just go in order — is what your big question heading into Election Day is. Nate, you want to start?
Nate Silver (editor in chief): It seems like we’re seeing a few signs of momentum for Hillary Clinton in the polls, more in national polls than in state polls. I guess my question is does that reflect actual momentum or — because the last poll sometimes isn’t the best poll. The last poll, sometimes pollsters herd and cover their ass a little bit. Now, in this case, there are logical reasons to think that the news cycle has turned to a more favorable position for her. But we see what happens when she goes from having a 2- or 3-point lead to a 3- or 4-point lead. Even that narrow difference in our model “flips” a couple of states. It’s going from 49 percent to 51 percent, so don’t get too excited. But there are a lot of states that are really on that margin. She had a good poll in New Hampshire last night, for example. And so, a little bit more security potentially in the last 24 hours.
Jody: Clare, what’s your big question going into Election Day?
Clare Malone (senior political writer): What I’ll be watching for our live blog is how Election Day unfolds, like the actual procedure and whether or not there are incidents of voter harassment, things like that. Long lines are definitely a thing that people expect, but I think I’m interested to see if there are going to be other, I guess, more ominous things that are happening at polling places. We had a couple early reports of Trump supporters on bullhorns, yelling at people. So, that’s my big thing, is how the actual voting unfolds and what happens.
Jody: And Harry, what’s your big question for Election Day?
Harry Enten (senior political writer and analyst): My big question is the Latino vote. We have seen some evidence in the early vote that Latinos are voting in higher numbers than they did four years ago. We’ve seen some evidence in the early vote to suggest that pollsters may be underestimating their impact on the electorate, and if they are, we shall see that in states like Florida, Nevada, Arizona, a little bit in Colorado and New Mexico. And that, to me, is the question that remains unanswered. If pollsters are missing or underestimating the effect of the Latino vote, Hillary Clinton’s margin in those states will be wider than some pollsters have expected it to be.
Jody: So, let’s talk about that, because that does feel like a big storyline in general. Very briefly, what are some of the reasons why polling might miss a Latino vote?
Harry: Well, there are two reasons that come right to the top of my head. No. 1, Latinos tend to be younger. It’s more difficult to reach younger voters. Many pollsters, or some pollsters, still don’t call cell phones or perhaps don’t call enough cell phones. The other reason why it could be easy to miss is because there are many Latinos who don’t speak English or for whom English is a second language. So, if you only have English only interviewers or someone comes on the phone in English, a Latino voter who speaks primarily Spanish might hang up on them. So, you basically have these converging things. There are probably other things that also go into it, but as we have seen in the past, some polls in states like Nevada underestimate the Democratic vote. We haven’t necessarily seen that in a state like Florida, but it’s potential this time around given a high Latino turnout we’ve seen so far in the early vote, and we should get basically record Latino turnout in the state of Florida.
Jody: Nate, as our most ardent skeptic of emerging conventional wisdom, what do you make of this storyline that, oh, yeah, the Latino vote is going to be huge, the early voting numbers are overwhelming. I mean, Jon Ralston, who we all respect and is in Nevada, he’s going pretty far out there and saying, Nevada’s in the bag, Donald Trump is cooked. Do you buy that?
Nate: I think when you don’t have a systematic way to analyze things and there’s complex and contradictory information, your biases are fairly likely to get the better of you. Now, I think within the universe of Nevada and the universe of Jon Ralston that Jon Ralston has a systematic way to understand how Nevada early vote translates to votes. And you actually have a lot of Democrats who are like, oh, don’t worry about the polls, the polls show a close race, but there’s a lot of wishful thinking. Which is not to say that the value is zero, but … [people] should keep track — how many times when you try and predict the direction in which the polls are biased, how often you come out ahead. And by the way, see how often you predict that the party that you prefer to elect comes out ahead.
Jody: Because we’ve said this many times — if you’re going to say that the polls are biased, then you kind of have to expect that they could be biased in either direction.
Jody: Let’s talk a little bit about ground game, get-out-the-vote, the day of mobilization efforts. Democrats have tended to be better at this the last few cycles. Obviously, Hillary Clinton and Barack Obama are very different candidates, but the Hillary Clinton machine, if you want to phrase it that way, has learned a lot of lessons and has a lot of people who in many ways perfected it for Obama. So, Harry, what does a data driven, very concerted, get out the vote on Election Day effort look like, and how much of a difference maker is it?
Harry: Well, I’ll start at the second part of that. I think what’s most important here is you need to have enthusiasm among your supporters to turn out the vote. That’s something I learned a very long time ago. Get out the vote efforts are only as good as the people you’re trying to get out to vote, and if you don’t have enthusiastic supporters, you can forget about it. In terms of how much it moves the polls, not very much — you know, maybe a point of two here or there.
Jody: When you say moves the polls, you mean moves the results.
Harry: Right, moves the results a point or two, especially in a presidential election. It may be a different story in a down-ballot race. So, we’re not looking for huge effects. However, in a close race, that can make the difference. You know, we could talk about the ways in which that get out the vote effort works — door knocking, calls, apps, getting your friends to try to get to the polls.
Jody: Clare, on the Trump side, his last push, he went to Tampa; Wilmington, North Carolina; Reno, Nevada; Denver — all those were on Saturday. On Sunday, he went to Iowa, Michigan, Pennsylvania, Virginia. I think he’s in Manchester, New Hampshire, today. What do you make of that collection of states, and what do you think is important to watch when it comes to their final push?
Clare: Well, I’ve got to say — the fact that New Hampshire has turned back into, not even a symbolic battle ground, but … it’s like the primaries again. Everyone is in New Hampshire, and it’s a small state, but it’s…
Jody: Remember how cold it was?
Clare: But beautiful. I have to say, New Hampshire was beautiful. Just the loveliest snow.
Jody: That’s probably why Donald Trump went back there.
Clare: I have very fond memories of meeting Dave Wasserman in the middle of a blizzard. You guys had this lunch and this lovely picture…
Jody: We’re already getting so sanguine on this podcast.
Clare: Anyway. Trump was [also] in the Upper Midwest trying to, I would say, shore up that white support. [Then there’s] North Carolina. North Carolina has turned into the real interesting, fraught state. Micah Cohen, our editor, just shared a North Carolina GOP press release where they’re putting out these early voting numbers, and the GOP says “North Carolina Obama Coalition Crumbling.” African-American early voting is down 8.5 percent from this time in 2012. Caucasian voters early voting is up 22.5 percent from this time in 2012, which is quite a blunt…
Harry: They ain’t hiding nothing.
Clare: It’s quite a blunt thing to say. I think that it’s a convergence of, maybe, less enthusiasm for Clinton than Obama, but also, let’s not forget that provisions of the Voting Rights Act are no longer in effect in that state, and that the state legislature made efforts to curtail some early voting days and locations, so I think we might be seeing a double effect there.
Jody: OK, let’s go on to a quick round of one of our favorite games: “Buy, Sell, Hold.” And we’ll do it state by state for the most interesting states on the map. So, I’ve got a list here, and I’ll read the leader’s chance of winning, according to our polls only model. We might as well start with Nevada, which seems to be the trickiest state of the 2016 election so far. Hillary Clinton, according to polls-only, has a 53 percent chance of winning as of this taping right now. Nate: buy, sell, hold?
Nate: I would buy Hillary Rodham Clinton in the state of Nevada at that price.
Jody: So, you’re selling the forecast. You don’t trust our model. You think the chances are higher.
Nate: I do trust our model, and I think that anyone who wants to make subjective calls and tries to beat our model, I think — you know, we’ll see how that goes. But you set up this experiment where I have to do this thing that I don’t like to do.
Jody: Technically, you set up the model and then I just set up the experiment on top of the model.
Nate: Nevada is a state where the combination of historical polling error, the combination of demographics being a little bit hard to reconcile with a tight set of polls there — she has a teeny bit of momentum in some of the polls, in certain of them she went from losing Nevada to winning it, so yeah, I’d buy Clinton.
Jody: So you think her chances are a little higher than 53 percent. Clare?
Clare: I’m going to buy. I’m heavily influenced by Jon Ralston’s reporting.
Jody: Never has a picture of a line outside a grocery store electrified the political community more than that one that Jon Ralston tweeted. I mean, I’ve seen that picture everywhere.
Clare: I mean, it also tracks, I think, with the idea that Latino turnout seems to be a lot higher in Florida, so if we’re talking about demographic surges that could be the story of this election, I would say that I feel pretty good about Nevada.
Jody: OK. And Harry?
Harry: Make it three, three’s a crowd.
Clare: Make it three, bartender.
Harry: I am buying Hillary Clinton’s chances in the state of Nevada for the reasons that have basically been spoken about here. Democrats are voting in high numbers, the unaffiliated voters traditionally in that state lean Democratic, the internal polls suggest that they continue to do so. I am buying Hillary Clinton in the state of Nevada.
Jody: OK. Ohio: 66 percent chance, according to our model, of Donald Trump’s winning Ohio. Nate — buy, sell, hold, what do you make of that evaluation?
Nate: Um, I think I hold. Those seem like appropriate odds to me. I’d buy Clinton if I had to pick, I think just because it’s a little bit hard to explain why Ohio polls have been quite that bad for her. And so, given 2-to-1 odds, and given that she seems to maybe have a half a point of a lift here in the last set of national polls and that you’ve seen the campaign still spending resources there as though it were a competitive state, she could win it by half a point or something.
Jody: Clare, what do you have to say for your home state?
Clare: Um, sell. I think she might have a better chance than we’re giving her.
Jody: So, you’re buying Clinton? You’re selling Trump?
Clare: Yeah. Yes. I don’t know which way I’m supposed to phrase —
Jody: Yeah, no one knows. We’re just confusing our audience.
Jody: Harry, Ohio?
Harry: My tendency is also to match Nate’s, which is to hold. But I have been interested in Clinton believing that that state isn’t gone, that she did do some rallies here at the last minute. We also know that the Republican Party in that state hates Donald Trump, so there could be a GOTV problem for him out in that state. Again, I hold, I think Trump will probably win in the end, but if our model is going to be wrong, it will be in underestimating Hillary Clinton, not overestimating her.
Jody: OK. Let’s go through a couple others on my list, and we’ll just do them real quick here. North Carolina. Basically, a toss-up in our model. Nate, what do you think?
Nate: I think it’s a toss up. I mean, the polling trends haven’t been great for Democrats there, the African American turnout hasn’t been great for Democrats there, so I would be reluctant to put money down in that state.
Jody: Clare?
Clare: I’m putting money down.
Jody: On who?
Clare: I think … oh, this one’s hard.
Jody: How could you not expect that follow-up question?
Clare: No, I know, I know. I think Trump might win North Carolina.
Jody: OK.
Harry: I’m going to go with Nate. I’m holding.
Clare: See, I refuse to hold on this game.
Jody: Holding on a 50/50, it’s no fun. And politics is supposed to be fun.
Clare: I have no statistical reputation to uphold.
Harry: Gary Johnson will lose.
Jody: All right, Gary Johnson will lose. That’s Harry’s bold prediction. Florida, essentially the same: 51 percent, as of this taping, Clinton favorite. Nate, do you also see it as a pure toss-up or do you think one of them has an edge that’s not being represented in our model?
Nate: You know, Florida and North Carolina are the shruggy states for me. I think that early voting looks a little better for Democrats in Florida and North Carolina, so the extent that you believe in that. I’ll put it like this. If I had to call that split, then I would go Florida for Clinton and North Carolina for Trump, which is of course how it went four years ago.
Jody: Clare?
Clare: I think Clinton’s going to win Florida. And I’m going to go to the Latino turnout and say that I think that will be a powerful motivating force.
Jody: Thank you for playing this game, Clare.
Clare: You’re welcome.
Harry: I’m going to agree with Clare on this one. I believe Hillary Clinton will win the state of Florida, and it will probably be apparent as of 8 p.m. Eastern time when the polls in all the parts of the state close because the large early vote —
Nate: I don’t know. I’d be careful with that, because people are going to make inferences from the early vote, and we’re not going to know —
Harry: What I know from watching the past few cycles is that the early vote, and the early vote as of counted as of 8 o’clock in the evening when all the polls close matches fairly well with the final results. That doesn’t mean it’s perfect.
Jody: OK. Pennsylvania. Hillary Clinton has never trailed in the polls there. Is that right? Our model says 76 percent chance for Clinton — does anyone think the chances are lower than 76 percent?
Nate: I mean, relative to the rest of the country? My theory is that it’s more plausible for Trump to win Pennsylvania and some other rust belt states like Michigan than people infer, and that there are these kind of sophomoric arguments like, “Oh, well, she’s been ahead in all the polls.” But that doesn’t really matter much if you happen to be one point ahead or two points ahead and it’s close. And you understand the scenario by which she loses a state like Michigan or Pennsylvania is, you know, those white working class voters, those union workers go further to Trump, and she doesn’t turn out her African-American base. If both of those things happen — so you’re flipping a coin twice, 25 percent chance — then I think she could be in jeopardy in one of those states. People are a little smug about saying, “how dare Trump campaign in Michigan, that shows how desperate he is.”
Clare: I would say on Pennsylvania that I have to, since I gave her better odds of winning Ohio, I have to give her worse odds of winning Pennsylvania, if I’m being consistent. Because I think it’s a similar thing with Ohio, where Trump is really relying on turning out those people who are deleted off the voter rolls for years and years in Western Pennsylvania who are going to turn out, or is she going to get enough people in the Philly area to really overcome it? So, I would say … she’s going to win it, probably, but would I give her a 76 percent chance? I’d say it’s closer.
Harry: Clinton will win in the state of Pennsylvania. I would think Michigan is the one I’d be more worried about. There’s just too big of a vote coming out of Philadelphia and its suburbs, even if Trump has a good turnout operation in the western part of that state.
Jody: Is there any chance to wrap up I can extract a Buy, Sell, Hold on the overall forecast? Hillary Clinton, 67.6 percent right now. This is all just a way to back Nate into predicting the race.
Clare: Listen, I will speak, even if no one else will. I think Hillary Clinton is likely to win this election. I think it’s going to be closer than we thought it was going to be like, mid-October when everyone was writing like, the landslide.
Jody: Including me. Although, I did caveat that with, “this will come back to haunt us.”
Jody: Nate?
Nate: Pass. Hard pass.
For more elections coverage, check out:
The latest presidential forecastThe latest Senate forecastThe latest election updatesHave questions you want answered on the podcast? Get in touch by email, on Twitter or in the comments.
We’ll be recording daily Elections podcasts from now until Nov. 8 and posting new episodes every afternoon. Be sure to subscribe so you don’t miss a new episode.
You can listen to the episode by clicking the “play” button above or by downloading it in iTunes, through the ESPN App or on your favorite podcast platform. If you are new to podcasts, learn how to listen.

Actualización sobre las elecciones: El Estado de los Estados
This article is published in cooperation with ESPN Deportes .
Las encuestas están llegando rápida y furiosamente –y hay signos de un repunte tardío de Hillary Clinton, cuya ventaja se ha incrementado a aproximadamente 3.5 puntos porcentuales con respecto a Donald Trump. Sus probabilidades de ganar el Colegio Electoral han aumentado hasta el 69 por ciento tanto en los modelos de “polls-only” (sólo sondeos) como en los de “polls-plus” (sondeos con proyecciones), recuperando parte del terreno perdido después de la carta enviada por James Comey, director del FBI, al Congreso el 28 de octubre. Seguiremos actualizando nuestro pronóstico hasta las primeras horas de la mañana del martes.
Pero aunque la probabilidad de un triunfo de Clinton haya crecido uno o dos puntos porcentuales más, todavía es la probable, pero no segura, ganadora. Eso significa que el día de mañana será muy emocionante – no sólo porque el resultado sea incierto sino porque un inusual número de estados tendrán potencialmente poder de decisión en el resultado. Consideremos, por ejemplo, que las ideologías de los partidos y las coaliciones demográficas están cambiando de tal manera que Clinton es favorita total en la carrera a pesar de estar varios puntos atrás en Iowa y siendo una modesta segundona en Ohio, y también consideremos que Trump todavía tiene una posibilidad a pesar de que a veces quedó postergado en las encuestas en los estados republicanos, desde Georgia hasta Utah.
Pienso que los estados pendulares (swing states) pertenecen a ocho grupos de dos a cuatro estados cada uno. Estos grupos corresponden muy probablemente al orden relativo de importancia de los estados según nuestro índice de punto de decisión, que refleja la probabilidad que tiene cada estado de emitir el voto 270, decisivo en el Colegio Electoral. Pero estos grupos también reflejan una suerte de diagrama de flujo mediante el cual se podría revelar el ganador del Colegio Electoral. Según lo que suceda en el primer grupo de estados, podríamos estar casi seguros de una victoria de Clinton – haciendo que los grupos debajo del primero sean menos relevantes. Aunque también un creciente número de contingencias podrían entrar en juego cuando la carrera llega a Omaha, Nebraska. Pero comencemos desde arriba (todas las cifras siguientes provienen de nuestra predicción “polls-only” a menos que se indique lo contrario):
Grupo 1: Las trincherasFlorida (Clinton es “favorita” con el 51 por ciento; 17 por ciento de probabilidad de decidir la elección).Carolina del Norte (Clinton es “favorita” con el 51 por ciento; 11 por ciento de probabilidad de decidir la elección).Creo que Florida y Carolina del Norte serán los protagonistas de esta elección. Tienen un poco de todo: votación temprana, encuestas conflictivas, datos demográficos cambiantes. Y siempre han desempeñado un rol en el drama de la campaña, ya que ninguno de los dos candidatos ha logrado obtener una ventaja apreciable en los dos estados (por ejemplo, ningún candidato ha estado como favorito mejor que 2 a 1 en Carolina del Norte en nuestra predicción “polls-plus”).
Más aún, las urnas de votación de ambos estados se cierran relativamente temprano y cuentan sus votos relativamente rápido, de manera que serán unos de los primeros estados en los que estaremos buscando pistas para saber cómo se desarrollará el día de mañana.
Clinton parecería haber tomado la ofensiva en estos estados, en el sentido de que ganar en cualquiera de ellos haría muy difícil la recuperación de Trump – y eso se verifica particularmente en Florida, con sus 29 votos electorales, que podrían compensarla si perdiera dos estados claves en otros lugares del mapa. Pero existe una probabilidad mayor de la que uno podría imaginar de que estos estados resulten ser una necesidad en lugar de un lujo para Clinton, si se diera el caso de que algo sale mal para Clinton en el Medio Oeste.
Grupo 2: El cortafuegos exterior de ClintonPennsylvania (Clinton es favorita con el 76 por ciento; 11 por ciento de probabilidad de decidir la elección).Michigan (Clinton es favorita con el 79 por ciento; 11 por ciento de probabilidad de decidir la elección).A lo largo del “Rust Belt” (Cinturón industrial) y el Medio Oeste Superior, Clinton está unos 3 o 4 puntos porcentuales menos que los que tuvo el Presidente Obama en nuestra predicción final de 2012, lo que es una buena razón por la que Trump tiene mejores probabilidades de ganar que las que tuvo Mitt Romney. Y el escenario en el cual Clinton pierda un estado como Michigan o Pennsylvania no es difícil de imaginar: Primero, suficientes votantes blancos sin títulos universitarios se inclinan por Trump, y, en segundo lugar, la influencia afroamericana se ha deprimido con respecto a la de cuatro años atrás (lo que no es alocado pensar que podía suceder). Pensemos en Clinton arrojando al aire una moneda dos veces, la primera para determinar si Trump consigue su base y la segunda para determinar si ella consigue su base. Si ninguno de los candidatos lleva su base a las urnas o si ambos lo hacen, Clinton ganaría en Michigan y Pennsylvania en virtud de que ambos son estados levemente inclinados a apoyar a los demócratas. Pero si la moneda cae en su contra las dos veces y Clinton no lleva sus votantes mientras que Trump lo hace, ella podría perder. Eso se corresponde con nuestra predicción de que ella tiene aproximadamente el 25% de probabilidad de perder cada estado.
También se da el caso de que Trump casi nunca ha estado en primer lugar en encuestas de alta calidad de Pennsylvania o Michigan. Pero las ventajas de Clinton se han estrechado, y Pennsylvania es uno de los pocos estados pendulares sin voto temprano, lo que potencialmente permite que una campaña recupere terreno tardíamente. Michigan, mientras tanto, tiene un número inusualmente grande de indecisos y una historia de malas encuestas.
Grupo 3: Los puntos de giroNevada (Clinton es favorita con el 54 por ciento; 4 por ciento de probabilidad de decidir la elección).New Hampshire (Clinton es favorita con el 66 por ciento; 3 por ciento de probabilidad de decidir la elección).Y hablando de malas encuestas, nadie está muy seguro de lo que está sucediendo en estos estados. En Nevada, hay un conflicto entre las encuestas que siguen dando un empate y los datos de la votación temprana que parecen presagiar cosas favorables para Clinton. En New Hampshire, hay un conflicto entre las mismas encuestas, con sondeos recientes mostrando diversos resultados, desde una ventaja de 5 puntos para Trump hasta una ventaja de 11 puntos para Clinton. Además, ambos estados son algo difíciles de definir demográficamente en el contexto de una elección Trump-Clinton. New Hampshire tiene una reputación de ser de clase trabajadora, pero en realidad, tiene ingresos bastante altos. En Nevada, están creciendo las poblaciones de latinos y asiáticos-americanos, pero también hay muchos votantes blancos sin títulos universitarios. De todas maneras, allí los Demócratas superan en número a los Republicanos, y si tuviera que apostar contra las encuestas en algún lugar, lo haría en Nevada, porque creo que se han subestimado las cifras de Clinton.
Estos estados también están vinculados por otra razón: Van a ser súper importantes o totalmente irrelevantes, sin que haya posibilidades de situaciones intermedias. Si Trump pierde en Florida o en Carolina del Norte, los pocos votos electorales totales de Nevada y New Hampshire (seis y cuatro, respectivamente) no serán suficientes para compensar. Lo mismo vale para Clinton si Trump gana en Pennsylvania o Michigan. Pero si Trump obtiene los estados del Grupo 1 y Clinton consigue el Grupo 2 junto con el resto de su “cortafuegos”, Nevada o New Hampshire (aunque no los dos) serán cruciales para producir un mapa ganador.
 Grupo 4: El cortafuegos interior de ClintonColorado (Clinton es favorita con el 75 por ciento; 7 por ciento de probabilidad de decidir la elección).Virginia (Clinton es favorita con el 83 por ciento; 7 por ciento de probabilidad de decidir la elección).Wisconsin (Clinton es favorita con el 82 por ciento; 4 por ciento de probabilidad de decidir la elección).
Estos son blancos secundarios para Trump. Colorado fue el estado que decidió la elección tanto en 2008 como en 2012, y se podría acusar a la campaña de Clinton de haberlo dado por sentado. Sin embargo, sus datos demográficos que reflejan alto nivel educativo, no son una buena noticia para Trump. Lo mismo vale para Virginia, pero allí la carrera se ha puesto más pareja que en la mayoría de los otros estados — la ventaja de Clinton se ha reducido de 10 puntos a 5 puntos en dos semanas — posiblemente debido a que partes de la base Republicana se han decidido por Trump. Mientras tanto, a Trump no le fue bien en Wisconsin en las primarias Republicanas, y Obama ganó allí fácilmente hace cuatro años a pesar de la presencia de Paul Ryan, presidente de la Cámara de Representantes, que representa el 1° Distrito del Congreso de Wisconsin, en la boleta Republicana. De todos modos, nuestro modelo nos dice que no descartemos totalmente estos estados, donde la ventaja de Clinton es sólo de un punto o poco más que en los estados del Grupo 2.
Grupo 5: La vieja guardiaOhio (Trump es favorito con el 65 por ciento; 7 por ciento de probabilidad de decidir la elección).Iowa (Trump es favorito con el 73 por ciento; 1 por ciento de probabilidad de decidir la elección).Obama lideraba las encuestas en Ohio y Iowa cuatro años atrás. Pero Clinton no hace lo mismo, lo que es una razón importante por la cual su mapa del Colegio Electoral es menos robusto que el de él.
Si bien los cambios son relativamente fáciles de entender en función de los patrones demográficos – ambos estados tienen muchos votantes blancos de clase trabajadora – son una señal de que el mapa no volverá necesariamente a la normalidad aunque Clinton gane la elección.
Pero no se trata tanto de que Clinton esté fuera de carrera en estos estados – es más probable que gane Iowa que pierda en Pennsylvania, según nuestra predicción – sino que es difícil verla como ganadora en ellos a menos que le vaya bien en el resto del Medio Oeste. Y si le va bien en el resto del Medio Oeste, será difícil que pierda en el Colegio Electoral. Por lo tanto, Ohio y Iowa no tienen una buena clasificación según nuestro índice de punto de decisión, que tiene en cuenta estas correlaciones.
A pesar de todo, Ohio podría tener un par de cosas buenas que lo hacen un buen blanco para Clinton, como la relación glacial de Trump con el Partido Republicano del estado y encuestas más ajustadas en la última semana. Iowa, por el contrario, podría seguir el camino de Missouri, un estado que pasó de ser un indicador de tendencias a salir del mapa de estados pendulares, sin detenerse en lugares intermedios.
Grupo 6: Los estados adelantados cuatro añosArizona (Trump es favorito con el 71 por ciento; 3 por ciento de probabilidad de decidir la elección).Georgia (Trump es favorito con el 81 por ciento; 2 por ciento de probabilidad de decidir la elección).Estos estados, ubicados en los rincones sudoeste y sudeste del mapa, podrían ser la piedra fundamental de la coalición 2024 de los Demócratas. ¿Pero qué sucederá este año? A medida que la carrera fue evolucionando, los números de Clinton se han mantenido mejor en Arizona que en Georgia — lo que es coherente con su potencial de tener mejores cifras que Obama con los hispanos, pero peores con los afroamericanos. El voto de Arizona también es potencialmente más elástico que el de Georgia, lo que quiere decir que hay más votantes pendulares, mientras que en Georgia, los Demócratas tienen antecedentes de poseer el 48 por ciento del voto, pero quizás no lleguen al 50 por ciento más uno.
Pero repetimos, la cuestión no es si Clinton puede ganar estos estados, sino si los mismos podrían tener la posibilidad de ser el punto de decisión en esta elección. Arizona, por ejemplo, podría desempeñar un papel en mapas como el siguiente, en el que Clinton barre los estados pendulares del oeste, pero se esfuerza en el Medio Oeste:

¿Poco probable? Sí, poco probable Pero cuando el mapa electoral cambia — como sucedió en 1992, por ejemplo — los cambios a veces llegan todos juntos. Si las encuestas no necesariamente tienen una tendencia general, sino que contienen errores substanciales entre ciertos grupos demográficos, uno podría encontrarse con algunos resultados bizarros como estos.
Grupo 7: Los estados “espera, ¿es cierto?”Minnesota (Clinton es favorita con el 84 por ciento; 3 por ciento de probabilidad de decidir la elección).Nueva México (Clinton es favorita con el 80 por ciento; 2 por ciento de probabilidad de decidir la elección).Trump ha hecho visitas tardías a ambos estados, ganándose una cantidad de burlas a causa de ello, pero el hecho es que nuestro modelo coincide de alguna manera con su decisión. Nuestros sondeos promedio en Nueva México muestran que Clinton tiene una ventaja de sólo 5 puntos porcentuales. Es difícil comprender este resultado en vista de los datos demográficos de Nueva México, pero el ex gobernador del estado, Gary Johnson, del partido Libertario, podría estar restando la mayoría de sus votos a Clinton.
Tal vez Minnesota hubiera requerido un esfuerzo más organizado de Trump para que jugara a su favor, pero el modelo lo marca como relativamente incierto porque ha habido pocas encuestas allí. Si Clinton está teniendo tantos problemas en Iowa, ¿es totalmente improbable que ella pudiera tener dificultades en el estado que está justo después de su frontera norte?
Grupo 8: Los imponderablesAlaska (Trump es favorito con el 77 por ciento; menos del 1 por ciento de probabilidad de decidir la elección).El 2° Distrito del Congreso de Maine (Trump es favorito con el 52 por ciento; menos del 1 por ciento de probabilidad de decidir la elección).Resto de Maine (Clinton es favorita con el 79 por ciento; 1 por ciento de probabilidad de decidir la elección).El 2° Distrito del Congreso de Nebraska (Trump es favorito con el 62 por ciento; menos del 1 por ciento de probabilidad de decidir la elección).Utah (Trump es favorito con el 84 por ciento; menos del 1 por ciento de probabilidad de decidir la elección).Finalmente, llegamos a los estados que tendrían importancia sólo en el caso de una elección muy pareja, particularmente, en aquellos casos en que Clinton pierda en Nevada y en New Hampshire, pero gane en el resto de su cortafuegos, dejándola clavada en 268 votos electorales.
Debe notarse que son 268 votos electorales y no 269 porque el cortafuegos de Clinton no incluye el norte, las zonas rurales y el 2° Distrito de Maine, cuyos datos demográficos son casi perfectos para Trump – aunque recientes encuestas hechas allí han mostrado una mayor paridad luego de una ventaja de Trump. Los dos votos electorales del total de Maine también podrían estar en juego, aunque es casi seguro que Clinton gane el 1er Distrito, que incluye a Portland.
Nebraska también divide sus votos electorales por distrito congresual, y el 2° Distrito con base en Omaha (que favoreció a Obama en 2008) se inclinaría por Trump según el puñado de encuestas que se hicieron allí. Pero el 2° distrito tiene una enorme cantidad de votantes con educación universitaria y podría ser un buen blanco para el equipo de analistas de Clinton.
En Utah – y sí, es llamativo que estemos hablando de él como un potencial estado pendular – el apoyo al independiente Evan McMullin se ha detenido sin alcanzar los 30 puntos después de haber llegado a amenazar a Trump, mientras que éste aventaja a Clinton por unos 10 puntos porcentuales en encuestas recientes. De los dos candidatos, McMullin tiene más probabilidades de vencer a Trump que Clinton, ya que la participación de voto de los candidatos de terceros partidos son más impredecibles. Por ejemplo, si muchos de quienes apoyan a Clinton se decidieran a darle una posibilidad a McMullin, este podría surgir como ganador de último momento.
Pero mi estado imponderable favorito es Alaska, donde Clinton realmente lideró la más reciente encuesta telefónica. El estado ha estado muy competido todo el año en una variedad de encuestas partidarias y no partidarias. El componente demográfico de nuestro modelo es escéptico, proyectando que Trump “debería” ganar en Alaska por 10 puntos porcentuales de acuerdo a lo que indican las encuestas de otros estados. Sin embargo, si Trump obtuviera 268 votos electorales y Alaska no hubiese sido escrutado todavía, uno no podría realmente dar nada por sentado.

Election Update: The State Of The States
The polls are coming in fast and furious — and there are signs of late momentum for Hillary Clinton, whose lead has increased to roughly 3.5 percentage points over Donald Trump. Her chances of winning the Electoral College have ticked up to 69 percent in both the polls-only and polls-plus models, recovering some of the ground she lost after FBI director James Comey’s letter to Congress on Oct. 28. We’ll continue to update our forecast through early Tuesday morning.
But even if Clinton’s win probability inches up by another percentage point or two, she’ll still be the probable but far-from-certain winner. That means tomorrow is going to be very exciting — not only because the result is uncertain but because an unusually large number of states will potentially have a say in the outcome. Consider, for instance, that party ideologies and demographic coalitions are changing to the point that Clinton is an overall favorite in the race despite being several points behind in Iowa and even a modest underdog in Ohio, and also consider that Trump still has a shot despite sometimes having trailed in polls in red states ranging from Georgia to Utah.
I think of the swing states as belonging to eight groups of two to four states each. These groups correspond pretty closely to the states’ relative order of importance according to our tipping-point index, which reflects each state’s chance of casting the decisive 270th vote in the Electoral College. But these groups also reflect a sort of flowchart by which the winner of the Electoral College might be revealed. Depending on what happens in the first group of states, we could be all but certain of a Clinton victory — rendering the groups below it less relevant. Or an increasing number of contingencies could come into play where the race comes down to Omaha, Nebraska. But let’s start from the top (all the figures below come from our polls-only forecast unless otherwise noted):
Group 1: The trenchesFlorida (Clinton is a 51 percent “favorite”; 17 percent chance of tipping election)North Carolina (Clinton is a 51 percent “favorite”; 11 percent chance of tipping election)I think of Florida and North Carolina as being the protagonists of this election. They have a bit of everything: early voting, conflicting polling, changing demographics. And they’ve always played a role in the drama of the campaign, since neither candidate has ever really been able to pull away in either state. (No candidate has ever been better than a 2-1 favorite in North Carolina in our polls-plus forecast, for instance.) Furthermore, both states’ polls close relatively early and they count their vote relatively quickly, so they’ll be some of the first states we’ll be checking for clues as to how tomorrow will proceed.
Clinton would seem to be playing offense in these states, in the sense that winning either one would make it very hard for Trump to come back — that’s especially the case for Florida, with its 29 electoral votes, which could cover for her losing two key states elsewhere on the map. But there’s a higher chance than you might think that they prove to be a necessity rather than a luxury for Clinton, in case something goes wrong for Clinton in the Midwest.
Group 2: Clinton’s outer firewallPennsylvania (Clinton is a 76 percent favorite; 11 percent chance of tipping election)Michigan (Clinton is a 79 percent favorite, 11 percent chance of tipping election)Throughout the Rust Belt and the Upper Midwest, Clinton is running 3 or 4 percentage points worse than President Obama did in our final 2012 forecast, which is a big reason why Trump has a better chance of winning than Mitt Romney did. And the scenario by which Clinton loses a state like Michigan or Pennsylvania isn’t hard to fathom: First, enough white voters without college degrees turn out for Trump, and second, African-American turnout is depressed as compared with four years ago (which isn’t crazy to think could happen). Think of Clinton as flipping a coin twice, once to determine whether Trump turns out his base and once to determine whether she turns out her own base. If neither candidate brings his or her base to the polls or both do, Clinton wins Michigan and Pennsylvania by virtue of their being slightly blue-leaning states. But if the coin comes up tails both times, and Clinton doesn’t turn out her voters while Trump turns out his, she could lose. That corresponds to her roughly 25 percent chance of losing each state in our forecast.
It’s also the case that Trump has almost never been ahead in high-quality polls of Pennsylvania or Michigan. But Clinton’s leads have narrowed, and Pennsylvania is one of the few swing states without early voting, potentially allowing a campaign to make up ground late. Michigan, meanwhile, has an unusually large number of undecideds and a history of bad polling.
Group 3: The pivot pointsNevada (Clinton is a 54 percent favorite; 4 percent chance of tipping election)New Hampshire (Clinton is a 66 percent favorite; 3 percent chance of tipping election)Speaking of bad polling, no one’s quite sure what’s going on in these states. In Nevada, there’s a conflict between polls that continue to show a tossup and early voting data that seems to portend favorable things for Clinton. In New Hampshire, there’s a conflict among the polls themselves, with recent surveys showing everything from a 5-point lead for Trump to an 11-point lead for Clinton. Both states are also a bit hard to place demographically in the context of a Trump-Clinton election. New Hampshire has a reputation for being working-class, but it actually has fairly high incomes. In Nevada, the Latino and Asian-American populations are growing, but there are also lots of white voters without college degrees. Still, Democrats outnumber Republicans there, and if I had to bet against the polls anywhere, it would be on them having lowballed Clinton’s numbers in Nevada.
These states are also linked for another reason: They’re either going to be super important or totally irrelevant, without a lot of room in between. If Trump loses Florida or North Carolina, Nevada and New Hampshire’s small electoral vote totals (six and four, respectively) won’t be enough to compensate. The same idea applies for Clinton if Trump wins Pennsylvania or Michigan. But if Trump holds the Group 1 states and Clinton holds Group 2 along with the rest of her firewall, Nevada or New Hampshire (though not both) will be critical to produce a winning map.
Group 4: Clinton’s inner firewallColorado (Clinton is a 75 percent favorite; 7 percent chance of tipping election)Virginia (Clinton is an 83 percent favorite; 7 percent chance of tipping election)Wisconsin (Clinton is an 82 percent favorite; 4 percent chance of tipping election)These are secondary targets for Trump. Colorado was the tipping-point state in both 2008 and 2012, and Clinton’s campaign can perhaps be accused of having taken it for granted. Still, its highly-educated demographics are not a good match for Trump. The same goes for Virginia, but the race has tightened there more than most other states — Clinton’s lead has fallen from 10 points to 5 points in two weeks — possibly as parts of the Republican base have come home to Trump. Meanwhile, Trump did poorly in Wisconsin in the Republican primary, and Obama won it easily four years ago despite the presence of House Speaker Paul Ryan, who represents Wisconsin’s 1st Congressional District, on the Republican ticket. Still, our model says not to be totally dismissive of these states, where Clinton’s lead is only a point or so larger than in the Group 2 states.
Group 5: The old guardOhio (Trump is a 65 percent favorite; 7 percent chance of tipping election)Iowa (Trump is a 73 percent favorite; 1 percent chance of tipping election)Obama was leading in the polls in Ohio and Iowa four years ago. Clinton isn’t, which is a big reason her Electoral College map is less robust than his was. While the changes are easy enough to understand based on demographic patterns — both states have lots of white, working-class voters — they’re a sign that the map isn’t necessarily going back to normal even if Clinton wins the election.
But it’s not so much that Clinton’s out of the running in these states — she’s more likely to win Iowa than to lose Pennsylvania, according to our forecast — as that it’s hard to see her winning them unless she’s doing well elsewhere in the Midwest. And if she’s doing well elsewhere in the Midwest, she’ll find it hard to lose the Electoral College. Thus, Ohio and Iowa rank poorly according to our tipping-point index, which accounts for these correlations.
Still, Ohio might have one or two things that make it a good target for Clinton, such as Trump’s frosty relationship with the state’s Republican Party and slightly tighter polls in the past week. Iowa, by contrast, might go the way of Missouri, a state that went from bellwether to off-the-swing-state-map without really pausing in between.
Group 6: The four-years-too-soon statesArizona (Trump is a 71 percent favorite; 3 percent chance of tipping election)Georgia (Trump is an 81 percent favorite; 2 percent chance of tipping election)These states, on the southwestern and southeastern corners of the map, could be the cornerstone of Democrats’ 2024 coalition. But what about this year? As the race has evolved, Clinton’s numbers have held up better in Arizona than in Georgia — which is consistent with her potentially beating Obama among Hispanics while underperforming with African-Americans. Arizona’s vote is also potentially more elastic than Georgia’s, meaning that there are more swing voters, whereas in Georgia Democrats have a path to 48 percent of the vote but maybe not to 50-percent-plus-one.
But again, the question is not whether Clinton can win these states, but whether they could plausibly be the tipping-point in this election. Arizona, for instance, could play a role in maps like the one below, in which Clinton sweeps the western swing states but struggles in the Midwest:
Unlikely? Yeah, unlikely. But when the electoral map changes — as it did in 1992, for instance — the changes sometimes come all at once. If the polls don’t necessarily have an overall bias, but have substantial errors among certain demographic groups, you could wind up with some funky outcomes like these.
Group 7: The “wait, really?” statesMinnesota (Clinton is an 84 percent favorite; 3 percent chance of tipping election)New Mexico (Clinton is an 80 percent favorite; 2 percent chance of tipping election)Trump has made late visits to both states, earning a lot of mockery as a result — but the fact is that our model sort of agrees with his decision. Our polling average in New Mexico shows Clinton up by only 5 percentage points. It’s hard to fathom that result given New Mexico’s demographics, but Libertarian Gary Johnson, the state’s former governor, may be claiming most of his votes from Clinton.
Minnesota would probably have required more of a concerted effort from Trump to really put it into play, but the model marks it as somewhat uncertain because there’s been relatively little polling there. If Clinton is having so many problems in Iowa, is it totally implausible that she could be struggling in the state just on its northern border?
Group 8: The wild cardsAlaska (Trump is a 77 percent favorite; less than a 1 percent chance of tipping election)Maine’s 2nd Congressional District (Trump is a 52 percent favorite; less than a 1 percent chance of tipping election)Maine statewide (Clinton is a 79 percent favorite; 1 percent chance of tipping election)Nebraska’s 2nd Congressional District (Trump is a 62 percent favorite; less than 1 percent chance of tipping election)Utah (Trump is an 84 percent favorite; less than a 1 percent chance of tipping election)Finally, we come to the states that would matter only in the event of a very close election — particularly, in those cases where Clinton loses Nevada and New Hampshire but wins the rest of her firewall, leaving her stuck on 268 electoral votes. Note that it’s 268 electoral votes instead of 269 because Clinton’s firewall doesn’t include the northern, rural, 2nd Congressional District of Maine, whose demographics are almost perfect for Trump — although recent polls there have shown the race tightening from a previous Trump lead. The two statewide Maine electoral votes could also be in play, although Clinton will almost certainly win the 1st District, which includes Portland.
Nebraska also splits its electoral votes by congressional district, and the Omaha-based 2nd District (which went for Obama in 2008) leans toward Trump according to the handful of polling conducted there. But the 2nd district has a ton of college-educated voters and it could be a good target for Clinton’s analytics team. In Utah — and yes, it’s remarkable that we’re even talking about it at as a potential swing state — independent Evan McMullin’s support has stalled out in the high 20s after once threatening Trump, while Trump leads Clinton by around 10 percentage point in recent polls. Of the two candidates, McMullin is more likely to upset Trump than Clinton, since third-party candidates’ vote shares are more unpredictable. If a lot of Clinton supporters decided to take a chance on McMullin, he could surge at the last minute, for instance.
But my favorite wild-card state is Alaska, where Clinton actually led the most recent telephone poll. The state has been competitive all year in a variety of partisan and nonpartisan polls. The demographic component of our model is skeptical, projecting that Trump “should” win Alaska by 10 percentage points given where the polls are in other states. Still, if Trump is at 268 electoral votes and Alaska hasn’t been called yet, you can’t quite take anything for granted.

November 6, 2016
How Much Did Comey Hurt Clinton’s Chances?
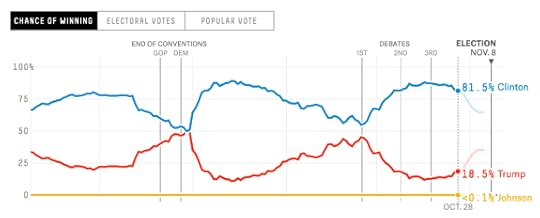
When FBI Director James Comey told Congress on Oct. 28 that he was reviewing additional emails pertinent to the case of Hillary Clinton’s email server, Clinton had an 81 percent chance of winning the election according to our polls-only forecast. Today, her chances are 65 percent according to the same forecast. The change corresponds with Clinton’s drop in the national popular-vote lead: from a 5.7-percentage-point lead in our estimate on Oct. 28 to a 2.9-point lead now — so a swing of about 3 points against her.
How much of that can be attributed to Comey? And now that Comey told Congress on Sunday that the emails on former Rep. Anthony Weiner’s computer won’t change his earlier conclusions about Clinton, should we expect her numbers to rebound? The cause and effect is hard to sort out. Clinton’s poll numbers were arguably a bit inflated in mid-October amid a very rough period for Donald Trump. And even before Comey, the media seemed eager for one last twist in the news cycle, so Clinton may have been due for a period of greater scrutiny one way or the other — for example, over emails from the Clinton campaign released by WikiLeaks.
Trump should get some credit, as well, for having been comparatively disciplined on the campaign trail. He’s gained about 2 points in national polls since Oct. 28, while Clinton lost 1 point.
Still, if you look at our win-probability graphic, while Clinton’s chances were slightly declining already after she came off her post-debate peak, the rate of decline began to accelerate a couple of days after Comey, once we began to receive some post-Comey polls. Now the decline has leveled off, and her lead has held steady over the past several days. One advantage of having a model like ours that’s pretty quick to detect changes in the polls is that we can potentially make better inferences about the cause of polling shifts. And while it isn’t proof of anything, the pattern is at least consistent with a “shock” caused by a burst of negative news for a candidate, as opposed to a more gradual decline.
In fact, the shift looks pretty similar to a period in July after Comey reprimanded but did not charge Clinton for her email server and testified before Congress about it. That period produced about a 2-point swing against Clinton.
The news may also have had an effect down-ballot. Democrats’ chances of winning the Senate were generally hovering around 70 percent in late October. Today, they’re 50 percent. It doesn’t take a lot to swing the numbers in the Senate forecast because of the large number of competitive races — even a 1-point swing toward Republicans because of higher turnout could affect the odds significantly.
So will the latest Comey letter help Clinton? That’s also hard to say, and any change will really come too late to be picked up on by most polls. It’s also plausible that the headlines themselves aren’t particularly helpful to Clinton, even if the news itself is. The Washington Post’s current web headline, for instance, is “FBI Director Comey says agency won’t recommend charges over Clinton email,” which reminds readers that Clinton was being investigated by the FBI for her email practices. Still, betting markets show Clinton’s probability of winning the election improving by about 3 percentage points on the news.

Election Update: Don’t Ignore The Polls — Clinton Leads, But It’s A Close Race
Two weeks ago, I noted the unusually wide spread in national polls, which showed margins ranging from a 14-percentage-point lead for Hillary Clinton to a 1-point lead for Donald Trump. Now, the results have shifted toward Trump, but the range has narrowed. Of 14 national polls since Oct. 28, when FBI Director James Comey put Clinton’s email server back in the news, all but one show somewhere between a 5-point lead for Clinton and a 1-point lead for Trump.
Here’s the data for all fully post-Comey national polls. For a twist, I’ll sort the polls by their FiveThirtyEight pollster ratings so we can see if the higher-quality polls show a different outcome than the more dubious ones do.
POLLSTERTYPEGRADEMARGINABC News/Washington PostLive telephoneA+Clinton +5Marist CollegeLive telephoneAClinton +1Fox NewsLive telephoneAClinton +2NBC News/Wall Street JournalLive telephoneA-Clinton +4IpsosOnlineA-Clinton +4IBD/TIPPLive telephoneA-Trump +1CBS News/New York TimesLive telephoneA-Clinton +3YouGovOnlineBClinton +3Gravis MarketingAutomated + onlineB-Clinton +2CVOTER InternationalAutomated + onlineC+Clinton +1Rasmussen ReportsAutomated + onlineC+tieMorning ConsultOnline—Clinton +3The Times-Picayune/LucidOnline—Clinton +5USC Dornsife/Los Angeles TimesOnline—Trump +6Recent national polls show a 2- to 3-point Clinton lead, on averagePolls conducted after Oct. 28.
On average across the 14 polls, Clinton’s lead is 1.9 percentage points. Chuck out the Los Angeles Times poll, which has been an outlier all year, and her lead is 2.5 percentage points. Or you can take the median instead of the average, which is also 2.5 points. Use only polls rated A-minus or higher? Her lead is 2.6 points. Use live-telephone polls only? It’s 2.3 points. Use only polls used to determine eligibility for the presidential debates? That gets you to 3.5 points. Use only the very recent surveys, which conducted all of their interviews in November? Her lead averages 2.3 points in those.
The point is that however you slice the data, you end up with a Clinton lead in the range of 2 to 3 percentage points. Our national polling average, which weights the higher-rated polls more heavily, is slightly toward the higher end of that range, showing her up by 2.8 points.
For all of the debates about modeling strategies, this is a pretty basic sanity-check. If your model is based on public polls, does it match the consensus of what recent polls are saying? National polls can be a good diagnostic for this, since they’re conducted frequently and often have large sample sizes — the 14 polls I mentioned above, for example, surveyed a combined 23,032 people, which yields a margin of error of only 0.6 percentage points. A national polling average should probably be showing somewhere in the range of Clinton +2 or Clinton +3, or it may be making some strange assumptions.
What about state polls? In order to estimate the national popular vote, FiveThirtyEight’s model combines two different calculations. The first is the technique I described above — a national poll average. The second calculation takes a polling average in each state and then weights the polls based on each state’s share of the national turnout. That estimate also shows Clinton up by 2.8 percentage points. National polls and state polls are telling pretty much the same story, in other words.
How about polls of swing states in particular? Right now, the tipping-point state in our forecast — the state that would provide the decisive 270th electoral vote if the polls got things exactly right — is New Hampshire. There, Clinton leads by only 1.7 percentage points in our adjusted polling average, as several recent polls show Trump tied or slightly ahead, along with others that still give Clinton the lead. Thus, Clinton’s doing a little bit worse in the tipping-point state than she is overall — a sign that she might win the popular vote but lose the Electoral College.
Of course, the polls probably won’t be exactly right. Instead, with so many competitive states, the order could be scrambled (perhaps Clinton will win in Nevada by several points but lose New Hampshire, for instance). So what’s Clinton’s position in the average swing state, weighted based on how likely that state is to be the tipping-point state? She’s ahead by an average of 1.5 points.
You can also see that Clinton’s swing-state advantage is slender based on some of the higher-quality state polls to come across the wire in the past 24 hours:
Clinton is tied in Florida and down 1 point in Ohio, according to YouGov.A Columbus Dispatch poll — conducted entirely by mail! — has Clinton up by 1 point in Ohio instead.Clinton trails in Iowa by 7 points, according to the Selzer & Co. poll for the Des Moines Register.Clinton is up 4 in Pennsylvania, according to a Muhlenberg College poll.And Clinton has only a 5-point lead in New Mexico, according to a poll for the Albuquerque Journal.That isn’t a great set of results for Clinton. The Iowa and New Mexico polls in particular show a significant underperformance compared with President Obama — and the Iowa poll comes from perhaps the best pollster in the country. The Pennsylvania result is fine for Clinton, and the Ohio numbers aren’t bad — but remember, Ohio is a state Obama won by 3 points four years ago, so we’re really lowering our expectations for Clinton to count polls showing a rough tie there as a good result for her.
All of this data is nevertheless consistent with Clinton being an Electoral College favorite. She has a 64 percent chance of winning the Electoral College in our polls-only model and 65 percent in polls-plus, putting her somewhere in the range of being a 2-1 favorite.
At the same time, it shouldn’t be hard to see how Clinton could lose. She’s up by about 3 percentage points nationally, and 3-point polling errors happen fairly often, including in the last two federal elections. Obama beat his polls by about 3 points in 2012, whereas Republicans beat their polls by 3 to 4 points in the 2014 midterms. If such an error were to favor Clinton, she could win in a borderline landslide. If the error favored Trump, however, she’d be in a dicey position, because the error is highly correlated across states.
There’s also reason to think a polling error is more likely than usual this year, because of the high number of undecided voters. In national polls, Clinton averages about 45 percent of the vote and Trump 42 percent; by comparison, Obama led Mitt Romney roughly 49-48 in national polls at the end of the 2012 campaign. That contributes significantly to uncertainty, since neither candidate has enough votes yet to have the election in the bag.
To be honest, I’m kind of confused as to why people think it’s heretical for our model to give Trump a 1-in-3 chance — which does make him a fairly significant underdog, after all. There are a lot of ways to build models, and there are lots of factors that a model based on public polling, like ours, doesn’t consider. But the public polls — specifically including the highest-quality public polls — show a tight race in which turnout and late-deciding voters will determine the difference between a clear Clinton win, a narrow Clinton win and Trump finding his way to 270 electoral votes.

November 5, 2016
Election Update: The Campaign Is Almost Over, And Here’s Where We Stand
We’ll take this opportunity to pause for breath — there have been surprisingly few polls released so far today — and regain perspective on the presidential campaign. So grab a seat on the couch and call Bobby and Mabel in from the yard: It’s time for 10 questions about where where the race stands. We published previous editions of this feature on July 15, Aug. 15, Sept. 6, Sept. 25 and Oct. 16, in case you want to see how smart or stupid our thinking was at various points of the campaign.
1. Who’s ahead in the polls right now?Hillary Clinton is ahead in most national polls, as you can find every number from a 1-percentage-point Clinton lead to a 6-point lead in recent national surveys. There are also a couple of polls that still show a tied race or — in one case — Trump ahead. Overall, the range of national polls has narrowed a bit, although it remains wider than what we saw over the past few campaigns, with Clinton ahead by about 3 points on average.
One could argue about whether Clinton’s still ahead in the Electoral College, however. New Hampshire, Florida, North Carolina, Nevada and the 2nd Congressional District of Maine are all extremely competitive in recent polls. (Our forecast still has Clinton ahead in New Hampshire — by about 2 points — but there’s plenty of polling to support the notion of a small Trump lead there instead.) That means Clinton has 268 electoral votes in states where she’s clearly ahead in the polls — two short of the 270 she needs.
Thus, while Clinton’s a 76 percent favorite to win the popular vote according to our polls-only forecast, her odds are more tenuous — 64 percent — to win the Electoral College. (Her chances in the polls-plus forecast are identical.) It would not necessarily require a major polling error for Trump to be elected, though he would have to do so with an extremely narrow majority in the Electoral College.
2. What’s the degree of uncertainty?In some ways, our fundamental hypothesis about this campaign is that uncertainty is high, with both a narrow Trump win and a more robust Clinton win — in the mid-to-high single digits — remaining entirely plausible outcomes. The polls-plus model, which gives Trump a 36 percent chance, is basically the same one that gave Mitt Romney just a 9 percent chance on the eve of the 2012 election, so it isn’t inherently so cautious. But the still-high number of voters not committed to either Trump or Clinton — about 13 percent of the electorate says it’s undecided or will vote for a third-party candidate, as compared with just 3 percent in the final 2012 polling average — contributes substantially to uncertainty.
So does the unusually broad swing-state map, with the outcome in at least a dozen states still in some doubt. And it’s important to remember that the outcomes in each state are correlated with one another, so that if Clinton underperforms her polls in Wisconsin (for instance), she’ll probably also do so in Minnesota. Forecasts that don’t account for these correlations are liable to be overconfident about the outcome. It isn’t hard to find examples of candidates who systematically beat their polls in almost every competitive state, as President Obama did in 2012 and as Republican candidates for governor and senator did in 2014.
And that’s before accounting for some of the factors that the model doesn’t consider: the disagreement in the polls, the unusual nature of Trump’s candidacy and the demographic changes it is producing, Clinton’s superior turnout operation, the possibility of “shy Trump” voters, the fact that the news cycle is still somewhat fluid headed into the final weekend, the declining response rates to polls, and the substantial number of high-profile polling misses around the world over the past few years. We think this is a good year for a forecast that calls for more caution and prudence.
3. What’s the medium-term trend in the polls?Clinton’s popular-vote lead peaked at about 7 percentage points at around the time of the third presidential debate, but Trump has closed the deficit to 3 points now. Most of the change has come from Trump gaining ground rather than Clinton losing ground, so one should give Trump some credit for managing to stay out of his own way over the past couple of weeks and adopting a more disciplined message (relatively speaking), making it easier for Republican voters to come home to his campaign.
4. What’s the short-term trend in the polls?If you look at the polls over the past few days as opposed to the past few weeks, however, it isn’t as clear who’s gaining ground. In that sense, things have become slightly less scary for Clinton. We can debate until we’re blue in the face how safe a 3-point lead is, but a steady 3-point lead is a lot safer than 3-points-and-falling.
5. Which states shape up as most important?The map is much broader than it was in 2012. Clinton’s “firewall” has crumbled to some extent with the tighter polls in New Hampshire, although Nevada — where early-voting data portends a much more favorable outcome for Clinton than polls do — could potentially replace it. Thus, Trump would need to flip another blue state, with Pennsylvania, Michigan and perhaps Colorado being the best candidates. Clinton could hedge against any potential incursion by winning either Florida or North Carolina, however. Florida, especially, would make a Trump win almost impossible because of its 29 electoral votes, which is why it remains the top state in our tipping- point index. To the extent our forecast assumes there to be high uncertainty, however, states more on the periphery of the discussion — such as Ohio, Virginia and perhaps even Arizona — shouldn’t be totally forgotten about, either. Sometimes the tipping-point state is a surprise: It was very nearly Pennsylvania in 2012, for example, despite a lot of smart takes that excoriated Romney for campaigning there.
6. Does one candidate appear to be doing better in the Electoral College than in the popular vote?Yes, Trump. Our model has thought so all year, and it’s because Clinton’s gains relative to Obama are concentrated among demographic groups — Hispanics, college-educated whites, Mormons — that are under-represented in swing states relative to their overall share of the population. Now that has become more apparent in the polling, and roughly a third of Trump’s 35 percent chance of victory reflects cases where he just barely gets over the hump in the Electoral College despite losing the popular vote.
Could the reverse happen instead — Clinton winning the Electoral College despite losing the popular vote? Our model considers it to be a remote possibility — an 0.5 percent chance — but it doesn’t account for the prospect that Clinton’s ground game or her late advertising blitz could improve her margins in swing states relative to the country overall. So a split either way is plausible, but it’s a lot more likely to be in Trump’s favor.
7. How do the “ fundamentals ” look?Curiously enough, a narrow Clinton win — or a narrow Trump win — would be consistent with literature from political science that suggests that economic conditions have a heavy influence on voting behavior and that candidates matter less in an extremely partisan environment. Our economic index has fallen slightly over the course of the campaign and now suggests that a “generic” Republican would beat a generic Democrat by about 1 percentage point, given economic conditions. On the brighter side for Clinton, Obama’s approval ratings are pretty good and could sway some undecideds into her column.
8. How do FiveThirtyEight’s forecasts compare against prediction markets?In general, FiveThirtyEight’s forecasts — especially our polls-plus model — have moved in tandem with betting odds while other models have diverged from them. There’s been an uptick in Clinton’s odds at betting markets over the past 48 hours, however, perhaps based on what seem to be favorable signs for Democrats in early voting. Thus, betting markets — which give Clinton a 77 percent chance as of this writing — are somewhere in between the FiveThirtyEight model and other polling-based models, which have her chances as high as 99 percent.
9. What would keep me up late at night if I were Clinton?She’s probably thinking: I’m certainly not thrilled about how the last week or two have gone, and particularly about my campaign’s inability to redirect the focus back to Trump’s many vulnerabilities after the FBI news broke. But that’s water under the bridge now. I can imagine a few ways that I might lose: If African-Americans don’t turn out in large numbers, if there’s a large turnout for Trump among white non-college voters, or if some whites with college degrees — traditionally a Republican-leaning group — come home to Trump. If one of those three things happens, I should be fine. If all three of them do, I’m probably toast. If it’s two out of three, that’s where we could be headed for a very long night and a possible popular vote-Electoral College split.
10. What would keep me up late at night if I were Trump?We get a lot of questions about why our model doesn’t account for early-voting data. One answer is that it does, to the extent that early voting is reflected in the polls. Another is that the whole point of building a model is to take a more disciplined approach toward evaluating evidence instead of just throwing a hodgepodge of indicators together. Our model does a great job of reflecting what the polls say and translating that into probabilities. So you can take it at face value or use it as a departure point if there are some other factors you might want to consider.
That’s a long preamble to the following point: In every one of these updates, we’ve pointed out that Trump’s lack of a turnout operation could be a problem for him in the event of a close election. We still don’t have a good way to estimate how big the effect might be. Furthermore, there are lots of ways to read too much into early-voting data. But there are the makings of a coherent story here about how turnout either salvages the election for Clinton, or allows her to turn a narrow win into a more emphatic one and beat her polls. It’s not just that Clinton is turning out her voters early, but also that some of them are so-called low-propensity voters who weren’t necessarily making it through likely voter screens. Furthermore, Clinton’s coalition is broader than Trump’s to begin with, so if she gets a good turnout she’ll probably win, even if Trump does also. So if I’m Trump, I’m not happy about the early-voting numbers, and I can imagine myself losing despite picking off a state like Michigan because of problems in Nevada, North Carolina or Florida, where early voting plays a large role.
The FiveThirtyEight Elections podcast is doing daily shows right up until Election Day.

Video: The Legacy Of 2016
Before the final votes are cast and the conversation becomes mostly about who won and who lost, we asked our political reporters — Nate Silver, Clare Malone, Farai Chideya and Harry Enten — to reflect on the 2016 campaign, and what they learned about the state of American politics.

November 4, 2016
Election Update: National Polls Show Clinton’s Lead Stabilizing — State Polls, Not So Much
We’re a couple of days removed from the point when almost every poll showed Hillary Clinton on a downward trajectory. Instead, polls over the past 24 hours have been more equivocal. National polls tend to suggest that Donald Trump’s momentum has halted, and that Clinton may even be regaining ground. But Trump is getting his share of good results in state polls, which both show competitive races in some of Clinton’s “firewall” states and favorable trend lines for Trump.
Starting with those national polls: Clinton has regained ground over the past couple days in the national tracking polls conducted by ABC News and the Washington Post, The New Orleans Times-Picayune and the Los Angeles Times (although the LA Times poll continues to show Trump ahead, as it usually does). There aren’t really any national tracking polls that are still moving toward Trump at the moment, in fact, although some — like the IBD/TIPP tracking poll — show a steady race. We’re notably lacking in the major, one-off national polls conducted by news organizations such as CNN or NBC News. Those should begin to be released over the weekend, and they’ll have a lot of influence on the forecast. For the time being, however, the impression conveyed by the national polls is of a race in which Clinton bottomed out a few days ago — perhaps after the FBI news last Friday — and has now begun to recover.
But those state polls? Not a lot of good news for Clinton. There’s more data showing a tied race in New Hampshire. And Clinton’s lead in Pennsylvania is down to about 3 percentage points in our forecast. Polls in Michigan have also been tightening, with an unusually large number of undecided voters. Polling in New Mexico has been tight enough that we’re now considering it a “state to watch,” although that may reflect an abundance of caution. Clinton’s numbers have held up better in Wisconsin and Virginia, while the data has been very mixed in Colorado.
Just so you think I’m not cherry-picking, here’s every swing state poll we’ve added since our last Election Update at 7 p.m. last night. It includes the latest state-by-state tracking polls from SurveyMonkey, Ipsos and Pulse Opinion Research.

One thing you’ll notice is that there were very few traditional, live-caller polls in this bunch, so if you’re a Clinton fan who doesn’t trust online and automated polls, you might not have as much to worry about. We’re also seeing a fair number of automated polls from Republican-leaning firms with middling pollster ratings. Our model tries to adjust for that by weighting polls based on their pollster ratings and adjusting for “house effects” (persistent partisan leans toward one party or the other).
At a minimum, however, the map is getting messier for Clinton, changing a firewall of states that once seemed locked in. Nevada, for instance, could fairly easily leapfrog New Hampshire in her pecking order, especially given the early voting statistics there. You also shouldn’t rule out cases where Florida or North Carolina wind up being the tipping-point state as a result of a late decline for Clinton in Michigan or Pennsylvania.
Overall, Clinton’s Electoral College chances are 65 percent in the both the polls-only forecast and polls-plus forecasts, not much changed from yesterday. And she maintains about a 3-percentage-point lead over Trump in our national popular-vote forecast. It’s not clear that things are getting any worse for Clinton, but it’s also not clear that they’re getting better — and we’re at the point where even a 1-point swing in either direction would be a big deal, since a 4-point lead for Clinton would be quite a bit safer than a 2-point one.

What X Factors Could Affect Tuesday’s Vote?
In this week’s politics chat, we go looking for surprises. The transcript below has been lightly edited.
micah (Micah Cohen, politics editor): Welcome to a special, extra politics chat — our last before the election. (It’s been fun :crying_cat_face:.)
Today we’re talking X factors!
clare.malone (Clare Malone, senior political writer): Isn’t that a reality show?
natesilver (Nate Silver, editor in chief): I think that’s “Ex-factors,” Clare, which would be a good name for a dating show — like, two couples date one another’s exes or something like that.
clare.malone: In this chat, we’ll discuss all our former flames!
micah: That’s a terrible idea. But, what else should we be looking at, besides the polls, that could affect who wins on Tuesday?
harry (Harry Enten, senior political writer): Well, I think the early vote, obviously. Our model doesn’t take that into account. And while it’s tough to discern trends based on the early vote in most states, it looks good for Hillary Clinton in Nevada, for example, even though the polls in that state paint a far closer race.
micah: But beyond Nevada can we really say anything? African-American turnout for Clinton seems weak, maybe?
natesilver: We could really use a voter-list-based poll of Nevada, indeed. And one of Michigan. Those are the two states where I think we have the least idea what’s going on, and they’ve both had high polling errors in the past.
clare.malone: So those states in and of themselves are X factors?
harry: Right. The question I wonder about re: Nevada is if the polls are off there is it a sign they are too low on Clinton in other states? Or is it a one-off?
natesilver: My general view of the early voting numbers is that they basically tell us the same story as the polls. Clinton’s coalition has shifted more to Hispanics and upscale whites, but with probable underperformance relative to President Obama among African-Americans and young voters. You can see that in the state polls too.
micah: Have you gotten that sense in your travels, Clare?
clare.malone: I think the Latino community is probably the most interesting of these growing support groups — they haven’t really been very active as a political bloc, we don’t really think of them as having the same sort of institutional political organization as say, black communities, but I think this election could be the beginning of a more politicized Latino community. They’re being given an emotionally galvanizing election, and no matter the result this year, I think the Democrats are going to really start working on their outreach.
Because Latino communities aren’t just growing in the Southwest and California — they’re growing in big Eastern Seaboard areas, they’re working in agriculture in places like North Carolina.
natesilver: It’s also interesting that Democratic early voting numbers seem to be strong again over the past couple days in states like Nevada and Florida after slumping earlier this week — which is also sort of consistent with the enthusiasm swing in the polls.
harry: It’s also consistent with what happened in Nevada in 2012 — a strong finish for the Democrats.
micah: OK, so Latino turnout is an X factor. Early voting is an X factor.
What else?
natesilver: Well, we should probably mention that Donald Trump is very, very lucky that he didn’t pick Chris Christie as his running mate. What with his aides being convicted on all charges in the Bridgegate trial just now.
harry: His bridge to the presidency would be fully shut, if that were the case. (I’ll show myself out.)
natesilver: Harry, remember when you thought Christie was gonna make a comeback in the Republican primary? He was your Marco Rubio.
harry: My “Rubio” crushed your real-life Rubio.
natesilver: WTF? My candidate won Minnesota, DC and Puerto Rico.
clare.malone: Wait, what does that have to do with Election Day X factoring? Are we just bringing up a news event?
natesilver: Obviously, there’s the chance something unexpected could happen. You had a news alert this morning about potential al-Qaida activity. You see people worried about hacking and chaos of various kinds on Election Day. Obviously, we hope something like that doesn’t happen, but people are going to be on high alert.
clare.malone: Well, I hate to say this, but voter misinformation might be something to keep an eye on. The White House and other law enforcement agencies are getting prepared for the possibility of Russian cyber actions.
natesilver: It seems too late for an oppo dump or a major investigative story to break, on the other hand, but who knows?
clare.malone: There’s stuff like this, which ProPublica’s Electionland is keeping an eye on — misinformation directed mostly toward Democratic communities telling voters stuff like “you can vote via text!” Making people think the presidential election is like “American Idol.”
harry: I’d like to think that doesn’t have much of an effect. I’d like to think that ‘cause I’d like to think people aren’t that naive.
micah: There are also four more days for Trump to say something crazy (or, you know, for people to remember the thousands of crazy things he’s already said).
clare.malone: He hasn’t said anything crazy lately, you’re right. That’s pretty crazy.
natesilver: Yeah, I think an underrated story is that he’s managed to remain relatively composed since the final debate. That has helped the media to stay more focused on Clinton.
harry: I think it’s the story, no? He’s allowed Clinton’s own faults to be spotlighted without interruption.
micah: I find it pretty amazing that in the last week of this campaign, the dominant story may end up being about Clinton.
What about GOTV?
clare.malone: Is that a public access station? KIDDING!
harry: If get out the vote means anything, then obviously Clinton is much better prepared than Trump.
clare.malone: I think the Republican side is the more interesting one on this particular angle. If they can get low propensity voters to actually turn out in certain states, that would be interesting.
micah: Trump isn’t really doing much GOTV, but the Republican National Committee is.
clare.malone: Per that Bloomberg piece, the Trump team’s strategy is voter suppression of Democratic groups more than GOTV.
But from that Washington Post article Micah just mentioned: “The late field surge gives the party a larger footprint on the ground than it had at any point in 2012.”
natesilver: I’m skeptical that any of that is going to matter much. They’re relying on firms like Cambridge Analytica that, if we can be frank, may be more pseudo-science than data science.
harry: Didn’t Ted Cruz’s campaign pretty much think Cambridge Analytica did nothing for them?
clare.malone: I think the RNC has, to a certain extent, tried to learn its lessons from 2012 — they just were confounded by Trump’s attitude toward traditional campaigning.
Yes, the Cruz people spent a lot of money and were disappointed. But sort of quietly.
harry: Of course, Republican voters are older and vote more regularly (see the difference in turnout between midterm and presidential elections), so Republicans don’t need as big of a ground game.
natesilver: The thing is, there aren’t any magic tricks to GOTV. It just requires a lot of effort and a lot of people and a lot of money over a long period of time.
harry: This is a presidential general election. People usually don’t need motivation to vote. If GOTV moves things, it’ll just be a couple percentage points at most. That can mean something in a close race, but we shouldn’t expect something shocking.
micah: Other X factors? Clinton’s surrogate advantage?
clare.malone: Obama has been on fire. That guy is really campaigning out there!
harry: He has been. It’s quite the difference between having Obama out on the campaign trail versus Rudy Giuliani.
micah: Are you implying that Giuliani isn’t an effective surrogate?
clare.malone:
harry: I’m implying Giuliani hasn’t held office in 15 years, and it’s amazing to me that he’s still relevant at all.
clare.malone: Trump’s surrogates are actually spectacularly inept, so it’s a testament to his candidacy’s power that it can withstand them. Ben Carson, in particular, is … weak.
micah: Are we missing any important X factors?
harry: I mean the polling stuff like “shy Trump” voters.
micah: Shy Trump! We should tackle that.
clare.malone: Well, if we are being literal, maybe there is a Marla Maples/Ivana Trump bombshell left in this campaign.
Shy Trump is more pertinent, though.
harry: In the primary, Trump mostly hit or underperformed his polling. And a new Morning Consult study shows there is perhaps the slightest bit of a shy Trump, but it’s really not significant at all.
Still, there’s always the possibility of a polling error.
clare.malone: But we should note that college educated men who sort of left him during the sexual harassment stuff are probably coming back on board with Trump. But they’re not shy about saying they’re coming back. The polls show it.
natesilver: How about “shy Clinton” voters?
harry: Also a possibility.
micah: Who would be a shy Clinton voter?
harry: Married women, I’d think. But could be anyone.
natesilver: Republican married women whose husbands are voting Trump, sure.
People who live in very pro-Trump areas where it’s socially unacceptable to express support for Clinton.
clare.malone: This is why it’s a secret ballot, folks! Interestingly, a lot of people I talked to in Ashtabula County, Ohio, did not want to tell me who they were voting for. That hasn’t happened a lot in this election, and I thought it was really interesting. Don’t know quite what to make of it — but they’re totally right. Secret ballot.
natesilver: I think we ought to have a strong prior belief that the polls are equally likely to be wrong in either direction. It’s very hard to predict the direction in which the polls might be biased.
If anything, it seems to go in the opposite direction of what the conventional wisdom expects. Although this year the conventional wisdom is a bit split between “Clinton ground game” on the one hand and “shy Trump” on the other.
micah: So polls could be off in Trump’s favor (he wins), they could be right (Clinton wins) or they could be off in Clinton’s favor (Clinton wins). She wins two of three — nicely matching the odds our models give her.
natesilver: Yeah, that’s not the worst way to think about it.
micah: Nate, rein in that effusive praise.
natesilver: My highest praise is “pretty good.” Pretty good is higher than very good.
harry:
natesilver: Clinton can afford a *minor* polling error in Trump’s favor, BTW, although as we’ve stressed repeatedly her situation gets iffy in the Electoral College if the race tightens much at all. But that’s why if she ticked back up to a 4-percentage-point lead instead of a 3-point lead at the end of the race here, it would be a pretty big deal. And it would be a huge deal if Trump narrowed it to a 2-point lead.
harry: I’m going to be watching the polls over the last few days because I got a feeling that some of the movement we saw to Trump was non-response bias. We already see our Now-cast, which is more aggressive about chasing down polling trends, moving somewhat back toward Clinton.
micah: Yeah, that seems like one of the big unanswered questions. Internal polls have reportedly been far more stable.
natesilver: I’m also curious whether we’ll see convergence/herding in the big national polls that come out this weekend.
harry: Always happens.
micah: Final thoughts?
natesilver: If Clinton’s up 3.5 points in the average, you’ll probably see some polls ranging from a tie to Clinton +7 or thereabouts. I wonder if a big national pollster would have the guts to publish a Clinton +11 or Trump +3 result at this stage.
harry: Some would.
clare.malone: Stories tend to break over the weekend in this election, so make of that what you will as we head into this final weekend.

Nate Silver's Blog

- Nate Silver's profile
- 730 followers

