
Harry S. Dent Jr.'s Blog, page 34
January 11, 2019
We’re on Shaky Economic Ground
I don’t really need to tell anyone that stock volatility has been off the charts. While they have moved lower over the past few weeks, they have also seen several sharp moves back to the upside.
It’s a regular rollercoaster.
Treasury bond volatility, however, was relatively steady up until last week.
Long-term bond yields peaked in early November at 3.46% and have since fallen without any sort of higher retracement in sight. Although last Friday’s Treasury bond action changed that recent trend. The long-term Treasury yield dropped to 2.9% Thursday and rebounded to 2.96% in short order.
Yesterday, the long bond stood at 3.02%.
As I noted many times over the past year, the housing sector has faltered. The increases in mortgage rates, rising and falling prices, and the decline in sales are to blame for that.
November new home sales data wasn’t released due to the partial government shutdown. But the existing November sales showed a surprising swing to the upside on the month. On the year though, sales fell 7%.
A decline in home prices should follow. Especially if other economic indicators show weakness.
All About the Jobs
According to the Challenger jobs report last Thursday, the number of construction layoffs announced in December closely mirrored job losses following the Great Recession in February of 2017.
And despite the government shutdown, the December employment report was released last Friday. The Labor Department seems to remain funded, for now…
Consensus analyst forecast no change in the unemployment rate of 3.7%, with a slight increase in new non-farm jobs and a healthy increase in hourly earnings of 0.3%.
The jobs increase to 312,000 was a big surprise. The initial expectation of 184,000 increase was blown out of the water! Wages also ticked higher than the expected 3%, rising 3.2% on the year.
Participation rates also increased above 63% for the first time since early 2014. The only bad news in this report is that the unemployment rate jumped to 3.9% from 3.7% in December.
Yields bounced higher in response to the surprise report.
Except for slow wage growth, U.S. employment has been robust. Wages are picking up steam, but how long will that last?
The recent Challenger jobs report showed a total of 43,884 layoffs in December. That’s nearly 29% higher than last year. The 538,659 job cuts announced in 2018 were also nearly 29% higher than 2017.
And just this past Tuesday, the Job Openings and Labor Turnover Survey (JOLTS) showed a quarter million less job openings in November than the month before. The number of total hires also dropped by 218,000.
Despite conflicting data between the December employment situation – shown in last Friday’s jobs report – and the JOLTS and Challenger reports, it’s certainly worth keeping a close eye on.
Manufacturing Update
Last week’s December Institute for Supply Management (ISM) Manufacturing Index showed surprising weakness.
Even though manufacturing has expanded over the past year or so, I’ve been keeping an eye on the overall trend as it seems to have plateaued.
The ISM index is important and “market-moving” because it’s a forward-looking indicator. The composite index is calculated from five components based off a survey from about 300 manufacturing firms nationwide that looks at new orders, production, employment, supplier deliveries, and inventories.
The December index fell by more than five points, from 59.3 to 54.1, which is the lowest it’s been since November 2016, and over two points below analysts’ estimates.
New orders slowed by 10 points, hitting lows not seen since August 2016. Production also slowed by more than six points, and employment dropped by two points.
Tariffs and the trade war with China are starting to take its toll on the manufacturing sector. Falling oil prices have certainly effected firms related to the energy sector.
If these factors persist, this could get ugly.
Stay tuned…

Lance


January 10, 2019
1 Thing You MUST Do In This Wild Market
It’s time to get to work.
We’ve learned a thing or two since early October…
When oil is low, it can go lower.
President Trump remains unpredictable.
The Fed can be wrong. And it can hurt stocks.
Equities can fall even when the economy is growing.
Buy and hold can make investors feel like they are Superman holding Kryptonite.
We had the worst December in the equity markets since the 1930s… the worst Christmas Eve trading session in history… the largest point gain on the Dow in history the day after Christmas… and then another fall and rise after New Year’s.
Pick your poison as to why…
It was the trade war.
Or maybe the Fed.
It could have been the transitioning Congress.
It might have been the President.
Maybe the markets had simply gotten too far ahead of economic growth.
Or, more likely, it’s a combination of all the above.
What’s an investor to do?
We’ve spent the last 10 years getting punished for selling the dips. The Fed had our investing backs. If we simply held on, we were rewarded.
That’s so yesterday.
Now the Fed is draining liquidity and every day brings, well… we don’t know what will happen.
Today we need to rediscover our old friend, security selection.
We have several in our stable at Dent Research, from income investing with Charles Sizemore to the portfolio in our flagship publication, Boom & Bust. But today I want to focus on John Del Vecchio’s work.
He brings a unique perspective to investing, and so he comes up with unusual investments, which is exactly what you need in an environment like this.
John earned his stripes by calling out bad actors in the corporate world. Through forensic accounting, he identified companies that were cooking the books, either legally or illegally. Maybe they booked sales when they shipped on consignment, or perhaps the bought back shares to hide a falling P/E ratio. Whatever the case, he’d warn off investors and even sell short.
Finding the good guys…
But that same methodology that identified offenders cast a spotlight on the good guys at the other end of the spectrum.
John can identify companies with high quality earnings, meaning revenue and profits earned by growing their businesses through increased market share and sales instead of takeovers and one-time write-offs.
The best part is that John doesn’t have to focus on the big companies that are included in the major stock indices, which means that his investments can move independently of the market.
That’s a bigger problem than you might think.
The old saying that a “rising tide lifts all boats” also means that a falling tide leaves everyone run aground.
If your investments are included in the stock market averages and also in several exchange traded funds, then when investors get nervous and sell their generic holdings, your stocks will suffer. It doesn’t mean they’re bad, they just got caught up in the crowd.
Which brings me back to the main point.
It’s time to dust off your security selection process and reaffirm why you own your current stock or, if you don’t have a clearly defined strategy, find one with the potential to thrive in a difficult stock environment.
The end of 2018 gave us a preview of what’s to come. It looks like 2019 will be a crazy year. Buckle up!

Rodney

January 9, 2019
How the Nasdaq Could Reach 10,000 in 2019
Who would have thought I would be forecasting that the Nasdaq could zoom to 10,000 this year?
Two things have changed my perspective in recent months: The Q4 2018 crash didn’t approach the typical 40% loss in the first two to three months, as was typical of most major bubbles… and my newer 90-Year Bubble Buster Cycle.
That 90-year Cycle is a “double variation’ of my proven 45-Year Innovation Cycle. It has marked the greatest bubble peaks and “resets” since the Industrial Revolution (1837 to 1842 and 1929 to 1932).
If the current correction doesn’t crash down much harder by early February – which doesn’t look likely at this point – then a final blow-off rally would be most consistent with past major bubbles, especially the ones that hit on this 90-year cycle.
What I’ve Been Looking At…
I’ve been looking at the finally bubble rallies on all the key indices: The S&P 500, the Dow, and especially the Nasdaq because it’s the lead bubble of the lot.
What I am noticing is that the best support on the final rallies since early 2009 come from a linear trend-line through the bottoms, but the best rally and upside targets come from exponential trend-lines through the tops.
Here’s my best chart for the leading Nasdaq…
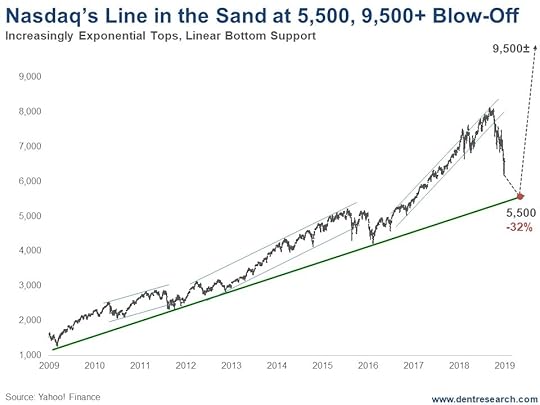
What This Chart Is Telling Us…
First note that bottom linear trend-line. It comes through at around 5,500 in early February.
The same trend-line on the S&P 500 comes through around 2,300 currently and will be hit first, and hence, be the first warning, if broken, that this Nasdaq support line could be hit. Again, the Nasdaq is the trump card here.
Next note the progressive nature of the rally.
The first wave into 2011 was more normal.
The next wave into 2015 was more exponential.
The most recent wave into late 2018 was more exponential again.
The markets are making similar point-gains in 38% of the time in each successive wave – that is THE definition of exponential and bubbles are the most exponential scenarios.
What Does This Mean?
So, if the markets can hold key support ahead, especially by early February, the next rally would project to around 9,500 on an exponential trend, or as high as 10,000 if it makes similar point gains to the last rally in 38% of the time. That takes us into late 2019/early 2020.
From the recent lows of 6,190, that’s a 53% to 62% gain.
From the bottom trend-line of 5,500 if reached, that’s 73% to 82%!
If we can hold the 2,300 level on the S&P 500 in the next month, this bullish scenario becomes much more likely.
Should we hold the bottom trend-line on the Nasdaq, around 5,500 currently, it could still follow this extremely bullish scenario.
If the S&P breaks 2,300 substantially suggesting a top in late 2018, then it could just retest its highs, while the Nasdaq rings the big bell with major new highs, assuming it holds 5,500. That would also be consistent with past bubble tops.
I cover the most basic bullish and bearish scenarios in the latest January edition of Boom & Bust. Don’t miss that issue and keep it handy as I’ll refer to it in updates in the weeks and months ahead.
One way or the other, 2019 looks to be very different than what many on Wall Street expect. It’s very likely to either be very bullish or very bearish. Not the middle ground they’re suggestion. And I’m still favoring the bullish scenario unless proven otherwise.
We will keep you updated.

Harry
Follow me on Twitter @harrydentjr

January 8, 2019
Are Markets About to Explode Upwards?
Look… the crash of a lifetime ahead is inevitable.
But, it’s looking increasingly like we’ll see a last-hurrah short boom of a lifetime first. Something I like to call the Dark Window because it’s unexpected and most miss it.
Will you?
I hope not.
I hope you’ll be ready for it because, today I’m going to give you a few insights into what to watch for…
First, a Warning…
Most analysts see a deep correction here and then modest gains and only slight new highs in 2019.
Jeremy Siegel, the perma-bull, sees a “good” 2019 for stocks if we don’t have a recession, which neither he or I think is likely in the near term. By good, he means a 5% to 15% rally. But 15% wouldn’t even retest the markets’ recent highs.
Expect the Unexpected…
In the January Boom & Bust newsletter that we published yesterday, and the Economy & Markets email I plan to send you tomorrow, I show the most bullish scenario for the Nasdaq in 2019. You’ll be surprised.
But it doesn’t compare to the most extreme topping pattern we saw in 1999 to 2000. Look at this…

The whole bubble from late 1994 into early 2000 was up 622% in 5.2 years; then investors endured a 78% crash in 2.6 years, taking the index back near to its bubble origin, classic for my bubble model.
Look at that 34% flash crash in mid-1998. Painful. Ten percent more painful than the current crash thus far for the Nasdaq, at 24%.
The thing is, look what happened next…
The Greatest Surprise of All
When everyone was expecting the see their asses handed to them, the markets turned around and produced a blistering 282% rally into March of 2000 in 1.4 years…
That didn’t occur in 1929 or any other bubble of the last century. The only other time we’ve seen that was in the Tulips bubble and the South Seas final run into 1720.
And from the looks of the way markets are behaving now, there’s a good chance we’re about to see a similar Dark Window open again.
This means there’s the chance to make unimaginable gains before that inevitable crash sets in. And like I started out today by saying, there WILL BE a soul crushing crash, very likely worse than what we saw on the Nasdaq into 2002 and more like the Dow from late 1929 to 1932.
When the fat lady eventually stopped singing in early 2000, Nasdaq investors lost 41% in just 2.5 months (one of the biggest reasons you shouldn’t wait until a bubble is definitively over before you try to get out).
Within a year and a half, they’d given up 73%!
By the time the bottom was in, they’d bled to the tune of 78%.
And this wasn’t even the most extreme crash investors have had to endure because it didn’t happen into a “Great Depression” like the next crash will and 1929 to 1932 did.
Still, it was by far the most extreme for that final Dark Window, blow-off rally.
And if this Dark Window occurs again exactly 90 years after the infamous 1929, on my most powerful Bubble Buster Cycle, even the most bullish forecasters on Wall Street won’t see it coming.
Tomorrow, I’ll show you how high the Nasdaq could go this time around, if we don’t break some critical support levels in the next several weeks.
Stay tuned…
Harry
Follow me on Twitter @harrydentjr
P.S. For some historical precedence on this Dark Window, watch this. It contains every bit of my research as it relates to the possible opportunity ahead, and then some. And check your email tomorrow for the next email from me.

January 7, 2019
Puerto Rico Debt Teaches Us An Investment Lesson
It takes two and a half hours to fly from Miami to San Juan, Puerto Rico, but the island might as well be on the other side of the planet.
Even though it’s a U.S. territory and it’s a shorter flight from Miami to San Juan than to L.A. or even Washington, the place is the epitome of out-of-sight, out-of-mind.
When’s the last time you considered the tough conditions on the island?
Hurricane Maria flattened the place more than a year ago, and quickened the pace of migration from the island to Florida, leaving behind the vulnerable population.
It took months to restore electricity, and thousands of structures remain in shambles.
FEMA desperately wants to disperse funds and get out of Dodge, but they can’t prove who owns what. Either land has been passed down through generations, or homes were built illegally without documentation.
And good luck finding building supplies.
The Island Has a Bigger Problem
But in some ways, the hurricane devastation isn’t Puerto Rico’s main concern…
The island has huge financial issues that are getting worse.
Way back when, in another universe during the Obama administration, the Puerto Rican government wanted to go bankrupt, but couldn’t. There’s no provision in U.S. law for territories or states to use the bankruptcy code. The Puerto Rican government came knocking on Congress’ door for help, which is ironic.
In the 1980s, Puerto Rico demanded fiscal freedom. The commonwealth told the U.S. Congress that it should be able to chart its course without federal interference.
Congress agreed, but only after noting that Puerto Rico should be fiscally conservative so as not to find itself in trouble, because the U.S. government would come to its aid. But hey, that was more than 30 years ago, so who remembers such things?
To prove they were serious, the Puerto Ricans noted in the first line of their constitution that debt payments, both principal and interest, would come before any other expense, period. Obviously, that didn’t hold, either.
Where It Is Now
Now Puerto Rico is $74 billion in the hole, before counting its $50 billion pension liability (with no pension assets), and it showed up to Congress demanding help.
Our representatives agreed to assist, giving Puerto Rico a way to access bankruptcy proceedings in exchange for relinquishing financial oversight, which now rests with the Financial Oversight and Management Board for Puerto Rico that includes seven members appointed by the U.S. president and one by the Governor of Puerto Rico.
After two years and a lot of wrangling, the commonwealth government has settled its first negotiation with bondholders.
Those holding the $4 billion of bonds issued by the Government Development Bank will receive $0.55 on the dollar, which will reduce Puerto Rico’s outstanding debt from $74 billion to about $70 billion, but also adds $2.6 billion of new debt. The new bonds will pay 7.5% and mature in 2040.
But that’s only if the Puerto Rican government pays the principal and interest.
The island has been mired in a recession for 12 years. Of the roughly 900,000 workers in Puerto Rico, almost one-third work for the government, and they receive two months of paid time off every year.
With so many people leaving the island and so much property in shambles, it’s hard to see who will pay taxes in the years to come.
Pay Attention to Where This Leads
Hurricane Maria didn’t make this mess, but it laid bare the issues, and we’d be wise to pay more attention to where this leads.
Puerto Rico has a people problem. The government owes too much money to retirees and workers, as well as to investors, that it cannot pay. When things get ugly, the government will take care of the people, completely disregarding anything written in the constitution or other law, or anything promised by previous administrations.
If the choice is between a worker or retiree and an investor, the investor loses every time.
Detroit proved this in 2013, and will prove it again when the city must begin making pension payments again in 2023.
Puerto Rico proved it when the commonwealth defaulted in 2016. The state of Illinois and city of Chicago aren’t far behind.
Their governments will make speeches and big promises, and they might even believe them. But in the end, creditors will eat all of the pain.
If you don’t feel hungry for a loss, do yourself a favor. Check your investments and make sure that you’re not exposed to cities, counties, or states with questionable finances.
We might not be paying attention to Puerto Rico, but it stands like a lighthouse, warning us not to come near. It’s our job to see it.
Rodney

January 4, 2019
Are Markets Repeating 2008?
I know I keep talking about this, but it’s important.
If stocks had followed at least a similar path to the ones the last seven bubbles travelled, it would be clear by now if this correction was a crash or just the pause (albeit it a painful one, with markets down about 20% across the board) that refreshes.
As I’ve told you for the last several weeks, there are several possible scenarios that could unfold. Right now, one is that markets are tracking the 2008 crash.
But, I still favor the bullish scenario. I still think this may be nothing more than a sharp correction and that Wall Street could be caught off guard when the markets pull one more blow-off, orgasmic rally into mid- to late-2019.
So, if the markets do surprise, what exactly do I think we’ll see in 2019? Listen to my latest video installment to find out.

Harry
Follow me on Twitter @harrydentjr

January 3, 2019
Good Riddance to the Tesla Tax Break
As I’ve written before, Tesla (Nasdaq: TSLA) has many problems, including quality control (it now ranks 27th out of 29 vehicle makes, according to Consumer Reports) and a quick burn rate.
But one issue hit harder on New Year’s Day than all the others.
Because the car company reached the milestone of selling 200,000 electric vehicles in the second quarter of 2018, the tax credit associated with buying a Tesla was cut in half on January 1, from $7,500 to $3,750, and will decline again before disappearing completely in early 2020.
Cry me a river.
A little unexpectedly, General Motors (NYSE: GM) reached the same threshold last quarter, so GM clients buying new electric vehicles would also see their tax credit slashed starting in April and then disappear over the next 15 months.
I say that they “would” because, well, GM just put its electric vehicle on the chopping block, so it’s not clear what electric vehicles GM buyers would purchase, although the company notes that it has several electric models set for debut in the next three years.
Again, I’m not too sympathetic.
People are free to choose electric vehicles, but that doesn’t mean that other taxpayers should foot part of the bill.
It makes even less sense when we see who buys these cars.
The website Teslarati reports that the average income for those buying Tesla Model 3, S, and X vehicles is $125,000, $260,000, and $500,000, respectively.
Do these people need a tax credit to put them over the edge in their car buying decision?
More importantly, then what happens?
They drive them.
I don’t say that sarcastically. I mean that they take their multi-thousand-pound vehicles and run them across the roads just like everyone else. Except that electric car owners bypass fuel stations, and thereby skip fuel taxes.
The 18 cents federal tax on gasoline is used to maintain the U.S. Highway Fund. California levies an additional 29 cents per gallon of gasoline and uses the money for an assortment of purposes.
Electric car buyers pay for none of this.
So, I’ve got an idea.
Instead of a tax credit, we should charge electric car buyers an additional tax that covers their use of roads, bridges, etc. that they don’t otherwise pay for. It shouldn’t be too onerous, given that they save on fuel.
At 15,000 miles per year and assuming 25 miles per gallon on an equivalent luxury car, the average Tesla owner saves roughly $800 per year on fuel (including the cost of electricity and the fuel tax not paid).
If we send them a nice note with an invoice for $280 to maintain our roads and bridges, they still come out ahead by more than $500 per year.
And this doesn’t even include a charge for the unquantifiable, and yet undeniable, VS, or virtue signaling.
By driving a Tesla, high-income earners get to go fast, skip the gas station, enjoy a tax rebate, and smugly signal to the world that they’re helping save the planet. Surely that’s worth something.
Obviously, this is written in jest.
What won’t happen…
I don’t expect the U.S. to levy an additional tax on electric vehicle owners anytime soon. But I am glad to see the tax credit fade away.
If vehicle buyers must be bribed to purchase a product, then obviously that product isn’t yet ready for prime time. We should let the market decide what products fit the bill and which ones (I’m looking at you, Chevy Volt) should be kicked to the curb.
I’m guessing that people earning $400,000 per year would buy a Tesla Model X at $125,000 instead of $117,500 if they were drawn to it in the first place. They don’t need my money, or yours, to help them make that decision.
Rodney

The post Good Riddance to the Tesla Tax Break appeared first on Economy and Markets.
January 2, 2019
The Insanity of San Fran Starter Home Prices
Bubbles ultimately die of their own extremes, although it always helps to have a trigger like the subprime crisis in 2006.
But the San Francisco area takes the cake when it come to the U.S. real-estate bubbles! (That Canadian honor goes to Vancouver and in Australia it’s Sydney and Melbourne.)
And prices have started to fall, albeit slowly, despite no slowdown in the economy and only modestly rising interest rates thus far.
Why?
Because of the insanity of home prices there! They’re massively overpriced, especially in the large and critical starter-home market.
They have become, literally, unaffordable!
The biggest investment most people make is that first home, which they buy between the ages of 27 and 33 (with the average buying age at 31). The second one, if they get another, is an upgrade that they can usually afford with higher income sometime between the ages of 37 and 41. And for the upscale, into age 65 buyers invest in a vacation home that they rarely use.
So, forget that the median home price in San Francisco is a whopping $1.3 million, pushing on 13 times median income.
The real kick in the head is for starter homes…
 The median starter home is $895,000. The median income for such families is only $35,425.
That’s 25 times income!
That’s insane!
How could a bank possibly lend against that when the traditional norm is three to four times income?
It takes 41% of their income to pay for that home. 30% is considered high and creates “mortgage stress.” To afford that starter home, you can just forget dining out at all those great restaurants in San Francisco.
The six most overvalued areas for starter home affordability are in California. Even Fresno, for crying out loud! That’s in the middle of nowhere in the desert. Last time I was there it was 120 degrees in the summer and felt like an oven.
San Jose isn’t quite as bad as San Fran, but only because they have higher starter family incomes thanks to the tech jobs. The median starter home there is $759,250 against incomes of $38,645… a mere 20 times income!
Oakland is 15 times and L.A. is 18 times.
Then there’s my past stomping grounds: Miami.
I was there for the last bubble, when high-end condos on South beach were pushing $1,000 a sq. ft. Now they’re $2,000 a sq. ft., with the very top-end, like Setai, Apogee, and Faena House at $4,000-plus a sq. ft. Double the bubble!
That’s the biggest reason I ended up in Puerto Rico (not the tax advantages, as one journalist would have you believe).
My condo is 25% of the cost, and I deal with far less traffic, enjoy more good restaurants nearby, and suffer far fewer prima donnas per capita. Heck, in Puerto Rico I probably qualify for that label myself.
The everyday person in Miami has those low-end service jobs that David Stockman always harps on about growing the fastest. The town’s starter home household only has a median income of $17,952 (that’s $1,496 a month or $9 an hour). They need 10 times that income to afford a lower median price of $185,000 for starter homes.
Then there’s Las Vegas, which didn’t bubble as much this time around as it did into 2006. It’s coming late to the party, with the highest price rise for a major city in 2018 over 2017. It now weighs in at near 8 times income, as does Newark, New Jersey.
Now this bubble is slowing down in many leading cities here and around the world, most so in San Francisco and Manhattan. Mostly because property is too expensive, especially for the biggest and most price-sensitive buyers, the new families.
Now what…?
When the bubble goes belly up, it’ll be worse than the last property crash because the most-bubbly areas are stretched beyond any reason!
And this bubble is leading the stock bubble in bursting, just like it did last time, by about two years.
We may have one more year in the stock bubble at best, but the real estate bubble is already saying “Game Over,” as it did from early 2006 forward and as we warned in late 2005.
Harry
Follow me on Twitter @harrydentjr

The post The Insanity of San Fran Starter Home Prices appeared first on Economy and Markets.
January 1, 2019
5 Crazy Possibilities for 2019
It could happen. That’s a common phrase that every parent hears, and even sometimes utters, when talking with children.
Sure, Santa could bring you a motorcycle. If there were a Santa. And he wanted you to die a grisly death in the middle of the highway.
Sure, you could make an A on that exam. If you actually read the book. And studied. And, you know, tried.
But hey, we’re Americans. We take risks well beyond what is reasonable for the expected return.
This adventurous spirit is part of what keeps our age of death lower than other developed nations. It also keeps us at the forefront of innovation.
Before we can take a chance, though, we must think about what’s possible, even if it’s not probable.
So, given today is New Year’s, let’s consider a few things that might happen over the next 12 months. They’d be unexpected but still fall in the realm of “the possible.”
1. President Trump Releases His Tax Returns
Bowing to pressure from a newly-seated Democratic majority in the House of Representatives, President Trump agrees to disclose his much-maligned tax returns.
The documents reveal a head-spinning web of entities that work with and through each other to exploit tax loopholes in real estate law. But they also show something else.
By virtue of his membership payments (written off as a business expense), we find out President Trump is a member of MENSA, the genius club.
Republicans rally, noting they’d always suspected there was something canny about his dealings with China, the deregulation push, and his exit from both the Paris Agreement and the Iranian Nuclear Agreement.
Democrats immediately call for an investigation of MENSA.
We also find out that Trump secretly donated millions to the Sierra Club, which immediately disbands in shame.
2. Trump Resigns
Claiming that he’s met every goal set during his campaign, President Trump resigns.
Vice President Mike Pence takes the helm and appoints Nikki Haley as his Vice President, then immediately recruits Generals Kelly and Mattis to rejoin the administration.
Trump goes on a speaking tour with the Obamas while the Chinese immediately agree to every trade demand made by the Pence White House because, as they openly admit, they have no idea how to deal with a principled man bent on reshaping the world based on Western morals. It scares them.
On the bright side, the markets jump 20% as investors expect a boring, unchanging rule of law and anticipate Pence/Haley will be elected in 2020.
Meanwhile, Senator Warren, seeing the U.S. Presidency slip away, decides to run for president of any Indian nation that will have her as a member.
3. Plastic Reverts to Fuel
The use of Earth Wake, the device that turns recycled plastic pellets into a mixture of diesel, gasoline, fuel gases, and a bit of wax, becomes common.
At $60,000 apiece, neighborhoods and corporations around the world immediately purchase the devices and put them into use, dramatically reducing plastic waste in the environment and adding a new source of fuel to the global economy.
The development provides cheap energy to developing nations while cleaning up their public lands.
The Boy Scouts of America gain new life by making recycling-to-fuel their cause celeb, and fan out across the nation to pick up used water bottles and plastic bags.
4. Social Credit Hits the U.S.
Based on the Chinese social credit system that monitors your daily life and rewards “good” behavior while punishing “bad,” Facebook rolls out a social measure that coordinates with all internet-connected devices to rate your daily activities.
Adding to the vast amount of data it already has on you, the company considers information from your smartphone about where you go, how you drive, whom you see, and what you say, plus what you watch on your smart TV, and what you buy with your credit cards, and of course how you behave in public, as captured by security cameras, traffic cams, and all other outward facing devices across the land.
The outcome is a “score” that shows up as a thumbs-up or a sad face, which is then used by companies to offer you better terms on purchases and better perks.
To simplify the process, Facebook immediately tags everyone in the Southeast with a sad face, except those living in Miami and Austin.
To be fair, the company also gives everyone in New York and San Francisco a thumbs-up because they are worried about lawsuits.
5. Britain leaves the EU and nobody cares
No, really. Wouldn’t it be awesome if Britain just called it a day on March 29 and nothing happened?
Seriously, Though
I am looking forward to 2019, even though we expect it to be a wild year in the markets.
Equities might bounce and then fall, as Harry predicts, but we could also see dramatic developments that could enhance our standard of living.
From a breakthrough in battery storage to new medicines derived from marijuana, the world is full of possibilities.
And if we do get the washout that Harry is looking for, then we’ll able to buy great assets on the cheap!
Happy New Year!
Rodney

The post 5 Crazy Possibilities for 2019 appeared first on Economy and Markets.
December 31, 2018
The Devastating Global Debt Trend
It’s no secret that our Federal debt has more than doubled since the onset of the last recession in late 2007.
It’s gone from $10.1 trillion to $23.6 trillion. That’s an 134% increase in just 11 years!
And now Trump’s business tax cuts are pushing that debt higher still. It’s now at 114% of GDP. It was only 69% of GDP in late 2007.
In fact, government debt has been roughly doubling every eight years, or two administrations.
It was $11.7 trillion at the end of the Bush era (early 2009); $21.4 trillion at the end of the Obama era (early 2017).
At a similar, near-doubling rate, it could be as high as $39 trillion at the beginning of 2025, when Trump would be out of office if he serves two terms, which I think is unlikely.
Doesn’t seem possible, does it? $39 trillion!?
But when you consider the impacts of the large corporate tax cuts in the deep depression I expect we’ll see between 2020 and 2023/2024, that dizzying figure doesn’t seem all that impossible after all.
What if deficits start running $2.0 trillion to $2.5 trillion a year?
And there’s a lot of off-balance sheet debt that comes in. Debt has always gone up faster than the cumulative deficits.
Consumer debt has only come back to slight new highs at $14.2 trillion and the financial sector debt has declined $2.1 trillion since its peak in 2008.
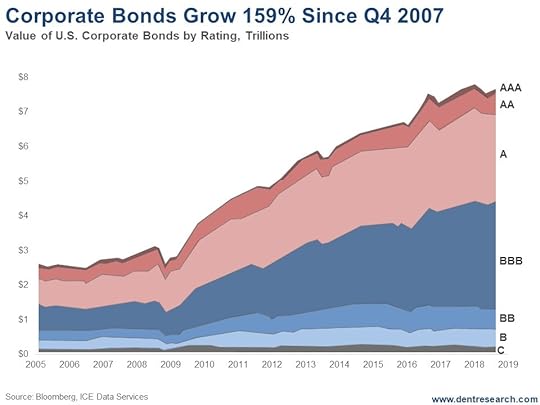
Corporate debt has gone up the fastest – 49% – in the Fed-engineered, low-rate environment. It’s gone from $10.1 trillion, or 68% of GDP, to $15 trillion, or 73% GDP. $7.35 trillion of that is loans. $7.65 trillion is corporate bonds.
But the big factor has been the corporate bonds stimulated by massive QE and lower than market rates…
Up more than government debt…
Most people aren’t aware that these have gone up more than government debt. They’ve gone from $2.95 trillion at the beginning of 2008 to $7.65 trillion in late 2018, heading towards $8.0 trillion-plus. That’s 159% as of now, greater than the growth of the Federal debt.
The worst part is that much of that has been used for leveraging earnings through stock buybacks that shrink shares rather than grow capacity and sales/earnings – and not for expansion of capacity.
The corporate tax cuts also didn’t increase capital spending as was projected!
It’s the same phenomenon around the globe – from China to Turkey – with corporate debt growing the fastest thanks to low rates and the plentiful dollars and euros printed to bail us developed countries out of our last debt crisis.
 The fastest growth in the U.S. in recent years has been in near-junk or BBB-rated bonds. Why not, when investors see little risk of a recession after a 10-year expansion, the longest in history without a recession.
Inevitable…
History would say the odds are not just high, but inevitable, that we’ll get that recession in the next year or two!
BBB-rated bonds are now the biggest single sector at $3.2 trillion or 42%.
The second largest is A-rated, the lowest level of investment grade, at $2.5 trillion or 33%.
BBB-rated bonds have risen by 26% or $900 billion since early 2016. They, and lower-rated bonds are now the majority, at 56%. They were just 46% at the beginning of 2008 and the beginning of the great recession.
The only good news is that the junk bonds at BB, B, and C – at $1.05 trillion – are now only $0.5 trillion, or 14%. They were $1.4 trillion (or 35%) in 2008. We at least learned something from the last recession and debt bubble.
What consequences from this recklessness?
Last time around, between defaults and bond values falling due to rising risks, corporate bonds lost 35% of their value or about $1 trillion.
This time I think bonds will peak at around $8 trillion and then lose about $3 trillion in value. That’s 38%.
Failing U.S. subprime loans triggered the last global debt crisis. This next one is likely to come from failing emerging market corporate debts, followed by U.S. and developed country defaults and bond devaluations…
Just another “brick in the wall.”
Harry
Follow me on Twitter @harrydentjr

The post The Devastating Global Debt Trend appeared first on Economy and Markets.


