
Harry S. Dent Jr.'s Blog, page 31
February 22, 2019
1998 to 2000 All Over Again
Do you remember what happened in the markets between late ’98 and early 2000?
Well, it’s happening again.
And it upsets me that so few people are going to miss it because Main Street is blasting stories of a weak market with the potential for a red year or only a mildly green one.
No! The Dark Window that has opened before us this year shows a very likely and wildly different story…
Let me explain…
 This is why I want to give you a detailed look at what’s happening here, why Wall Street is getting it wrong, and what you should do next.

Harry
Follow me on Twitter @harrydentjr


February 21, 2019
What’s Wrong With Amazon’s Tax Bill
Amazon is the best of this bubble, and in some ways the worst!
Yet again, it’ll pay zero taxes to the IRS for 2018!
No taxes on sales of $233 billion and profits of $10.8 billion last year.
Not a dime.
Nada!
This is just wrong.
And it’s one of many things that are wrong with this bubble!
I just had to record a video to talk to you about it.
 Amazon got up to a $1 trillion valuation at its peak in 2017. At that time, it was 5.6x sales. That’s crazy. A normal valuation is 1x, maybe 2x for a growth company.
So, we’ve got companies making record profits and enjoying tax cuts. AND they’ve had a QE tailwind for years…
All of which they’ve used to buy back their own stocks.
Yeah! That’s a recipe for trouble.
First though, they’ll present Dark Window profit opportunity this year!
Harry
Follow me on Twitter @harrydentjr
P.S. Opportunities will abound during the Dark Window we’ll enjoy this year. Some of the best could well come from stocks $10 or cheaper. The trick is how to find those tiny, but mighty, gems. Tune in to John Del Vecchio’s webinar next Tuesday, February 26. It’s called The $10 Trader: How to Build a $523,000 Fortune With Some of the Market’s Cheapest Stocks. He has some tricks up his sleeve for you, but to hear them, you must register to watch.

February 20, 2019
Rising Debt and Falling Spending Will Wreck the Economy
It’s probably a good thing the government partially shut down in December. It delayed the exposure of some dreary economic updates in the face of a falling stock market.
Retail sales figures for the important holiday month were finally updated last week, and they were terrible.
Excluding auto and gasoline, sales were expected to rise 0.4% but dropped 1.4% on the month!
That was the sharpest drop since September 2009 when the U.S. economy was in a recession.
Traders sold stocks in reaction to the dismal sales figures. But the hope of a trade deal with China kept stocks afloat and they ended the day on a mixed note. Treasury bond yields dropped slightly before steadying. At time of writing, long-term bonds were still hovering around 3%.
Still catching up…
We still don’t know when the updated retail sales figures will be released for January, February, or March.
I’m guessing the Census Bureau and the Bureau of Economic Analysis (BEA) will be all caught up with the delayed economic reports by the end of next month.
The BEA will update fourth quarter 2018 gross domestic product (GDP) on February 28. It was originally scheduled for January 30, and it will now include the first and second estimates of the data.
And those dismal December retail sales figures will surely impact fourth quarter GDP. I’ll be watching for that release and considering the impact it could have on the markets.
Growth rate adjusted way down…
Last Thursday, the Atlanta Federal Reserve’s GDPNow forecast was adjusted from a fourth quarter growth rate of 2.7% down to 1.5% after retail sales were factored in. Although it’s not an official forecast, it’s still worth looking to for running estimates. And with this forecast… ouch!
Remember, consumer spending drives nearly two-thirds of GDP. And retail sales make up about half of all consumer spending. So, December’s dismal retail sales will have a major impact on fourth quarter GDP.
Moving forward, the question will be: How will traders and investors look at the impact?
They could dismiss the poor figures, writing them off as a byproduct of the government shut down, or it could turn sentiments sour as investors see the drop as a sign of a slowdown…
Consumer spending is a leading indicator as to what direction our economy will go. When it slows (as it’s now doing) things look to head south… But the rising consumer debt shows that consumers are willing to spend what they don’t have.
Consumer debt hits record level
How much debt can consumers pile on?
Seriously, there’s a limit to the debt. I’m not saying we’re at or near that limit. But according to the Federal Reserve Bank of New York, overall debt rose to $13.5 trillion in the fourth quarter. That, folks, is a new record high!
We saw the previous high in Q3 2008.
Consumer debt is now 7% higher than it was during one of the worst financial crises in history.
What’s more troubling is that, as overall debt levels rise, the quality of debt falls.
Student loan balances are higher by $15 billion.
More than a 10th of the $1.46 trillion in total student loan debt are delinquent. The New York Fed stated that the actual level is likely higher because of deferments and forbearance.
And then there’s the record number of auto loans that were three or more months late. Auto loans that are delinquent rose by 2.4%, reaching over seven million.
That’s not a good sign of things to come…
Smaller tax refunds…
So, if consumers can’t borrow more – hitting their personal debt threshold – how can they spend more?
Well… they’ll usually spend the tax refund they start getting this time of year, right?
For those taxpayers getting refunds, between 2014 and 2018, the average refund was around $2,700.
To me, getting a tax refund just means you’re giving Uncle Sam an interest-free loan on your money. For many others, it’s a way to force yourself to save throughout the year.
It’s still early, but, so far, the average refund has dropped by a little over 8% this year to $1,865. That number comes straight from the IRS.
Because of the government shutdown though, returns processed are down nearly 26% compared to last year. There’s still time for the average to shift around. I’m thinking it’s going to move down further though due to the new tax laws.
Which brings me to the question Teresa asked in the Saturday Economy & Markets about the smaller tax refunds this year.
One reader, Kathy, wrote in saying this:
While I haven’t done my taxes yet, I would wonder if the lower tax returns that are disappointing people are the result of slightly higher paychecks throughout the year? I didn’t adjust my number of exemptions after the new tax law came into effect and I noticed my paychecks jumped a bit for the year. Since it was due to less money being withheld from my paycheck for taxes I fully expect to get a lower refund this year. No sweat!
For my work colleagues who changed their exemptions so that same amount was withheld they stated that their returns were roughly the same as last year. And since we live in one the states to get hit the worst by the tax reforms (heavily Democrat state and the tax reform limits what we can claim for state tax), I anticipate that others are ending up slightly better off than we are. It was my impression that it is primarily high-earning two-income families (most of your readership, perhaps?) who are the least likely to benefit from the reforms.
That’s right on the money, Kathy.
While some are blaming the Tax Cuts and Jobs Act passed in December of 2017 for their lower refunds, according to Mark Mazur, director of the Tax Policy Center, two-thirds of individual filers will get a tax cut, and 8% to 10% will get a tax increase.
Those getting a tax cut may have seen a larger paycheck in 2018. And they will see a smaller refund this year because they didn’t adjust tax withholding. So, it seems your work colleague adjusted accordingly to the changes made, which is why they saw roughly the same amount returned to them.
Worth noting…
But it’s worth noting that about five million people who received a refund last year won’t be getting one this year. More than 30 million taxpayers will owe the IRS. That’s up 18% from last year.
In 2018, the federal deduction for state and local taxes (SALT) was limited to $10,000. According to Bank of America, the lost deduction will result in an additional $3,000 in federal taxes on average. So, if you live in a place with high SALT, which was completely deductible in 2017, it now has a cap on it and that cap will greatly impact tax returns.
Though for some, the tax cuts are a bit of welcomed income, especially for some small-business owners. One such owner, Karen, wrote in to share this:
I’m a small business and I like the tax cut. I am getting a nice reduction in my taxes for my business income. I won’t owe any additional taxes and my refund will pay my estimated tax deposit for April…
Folks, it’s not all doom and gloom this tax season.
The bottom line…
Consumer spending drives two-thirds of our economy. The economy has been humming on all cylinders, but how long can that last if the consumer can’t or won’t spend more?
If the impact of the tax cuts passed in 2017 resulted in lower refunds, the usual jump in spending this time of year will be muted. If consumer debt is at a record high and delinquencies are rising, how much more can consumers borrow?
Is this party just about over?
Things seem to be winding down, but it’s still too early to say…

Lance

February 19, 2019
Will Electric Bikes Save Harley?
My father had a Harley in the mid-1980s, which I would ride from time to time. It was an ’83 Sportster, and it leaked oil, and the electrical system would cut off when you turned a corner.
Back then that was called “character.” Today, we’d call it sloppy workmanship.
Insiders bought the company from conglomerate AMF in the early 1980s, and by the end of the decade they’d returned the storied brand to its historical place – a well-made American icon.
Harley Davidson (NYSE: HOG) rode through the 1990s and early 2000s like a company on a mission. It sold a zillion “hogs” to aging professional Baby Boomers (like my father) who longed to connect with some distant part of their DNA that called for rebellion.
The Boomers were the right age, their early 40s, and Harley had the right product.
Then came 2006…
Note that I didn’t say, 2008 or 2009, referring to the financial crisis. Harley’s problem came sooner.
In 2006 the highest number of Boomers reached the prime motorcycle-buying age of 45. Our research suggested that Harley was going to struggle after that, which is exactly what happened.
Since then, Harley has tried to move mountains to regain its pace in selling motorcycles, but to no avail. In its latest earnings report, Harley noted it sold fewer bikes in 2018 than it did in 2017, and expect to sell fewer again this year.
But they have a plan. Harley will introduce the LiveWire Electric Bike later this year, and two electric scooters by 2022.
Unfortunately, it won’t work…
Harley riders don’t come in many shapes in sizes. Most are aging men. Yes, there are plenty of exceptions, and Harley works hard on expanding its appeal to women and younger buyers. But they’ve had limited success.
The brand’s history speaks to rebellion, power, and national pride. Those aren’t bad things, but they don’t exactly scream “young, female, globalist, urban-dweller with a cat that attends the Women’s March.” Again, those qualities aren’t inherently good or bad either, they just don’t come to mind when someone says, “Harley.”
Go ahead. Picture a Harley on the street in your head. Who’s riding it?
And then there’s the problem of the motorcycles themselves…
Most Harleys are big. The smallest traditional bike is the Sportster 883, which displaces 883 cubic centimeters (cc’s) and weighs 564 lbs.
The newer Harley lineup of Street bikes includes the modest Street 500, which displaces 500 cc’s and weighs a mere 492 pounds. Remember, these are the smallest, and the Street series has been plagued by maintenance issues.
You can get a new Honda CB300, which displaces 281 cc’s and weighs 313 pounds, for a couple of thousand dollars less than the Street 500. For the Millennial crowd that’s carrying student loan debt and isn’t interested in channeling Marlon Brando, James Dean, or their dad, that’s a pretty good option.
Now, about those electric bikes…
I’m a fan of the LiveWire. I followed the press releases when Harley took the prototype on a national tour a few years ago. Apparently, the company added a sound that makes the bike approximate a jet engine turbine.
Since Harleys are known for their roaring exhaust, it makes sense that they would ensure the electric bike had a song of its own. I’m not sure if the engine noise made it to the production bike, but for the price tag, the motorcycle should come with a live band.
Harley set the price at $30,000.
For a motorcycle.
With few moving parts.
The thing is fueled by a souped-up version of your cell phone battery. It has a “range” of 100 miles or so in urban driving. Highway miles sap the batter faster.
The thing looks cool, but it’s hard to say it’s worth it.
I can see Millennials thinking the LiveWire is nifty, but then surfing the net for less than five seconds and finding Zero Motorcycles, which has been making electric bikes with zero emission for more than a decade.
Zero offers a range of bikes, including the decked out ZF 14.4 with an additional power tank, which has a range of 200 miles in the city and costs $16,900, or just over half of the new Harley.
So, it costs half as much and goes twice as far. Hmm.
Maybe the new city scooters due out in a couple of years will save the company? I almost couldn’t write that because it sounds so preposterous.
The scooters, which Harley unveiled at the X Games in January, look like someone took a Honda Ruckus (which are pretty awesome, as scooters go) and made it boring. The scooters will be 49 cc’s, so they won’t require a motorcycle license, but they will require that you surrender any sense of style to get on one.
OK. That’s a bit harsh. Perhaps Harley will tweak the design before they offer the bikes for sale. I hope.
There is a different path available to Harley, but it’s difficult…
During the late 1960s and 1970s, Harleys fell out of favor. The company subsisted by selling fewer bikes and offering lots of branded items such as shirts and lighters to keep the cash rolling in. They held on until the rising generation aged into the sweet spot to buy their bikes. Maybe this could happen again.
As the Millennials age, they’ll eventually feel their rebellious oats and want to strike out against The Man on the weekend even as they toil away at professional jobs during the week. As long as Harley hasn’t hurt its brand too much with offerings like the urban scooter, it could fit the bill.
The payoff could be huge, since there are more Millennials than there are Boomers. The trick will be remaining relevant long enough, with its mystique intact, to take advantage of the opportunity.
Such a strategy won’t make shareholders happy, but it would allow Harley to maintain its well-deserved image as a quality American product.

Rodney

February 18, 2019
Presidents Day: Revolutions and Great Leaders
Who do you think of when you think about the great presidents? Washington, Jefferson, Lincoln, and Teddy Roosevelt on Mount Rushmore…? Or Franklin Roosevelt, Kennedy, and Reagan?
Bill Clinton once remarked: “I didn’t have enough of a crisis to go down [in history] as a great president.”
You bet he didn’t.
Boom time…
He walked into the best eight years in U.S. history; a boom time I forecast, including the balanced budget, in The Great Boom Ahead… before he was inaugurated.
He’s right though. Great presidents DO come out of crises and political/social revolutions. The American Revolution, the Civil War, the Great Depression.
This chart, from Zero Hour, shows how we’re in the biggest social/political revolution since the advent of democracy itself in the late 1700s (Washington/Jefferson), and the most polarized society since the Civil War (Lincoln).
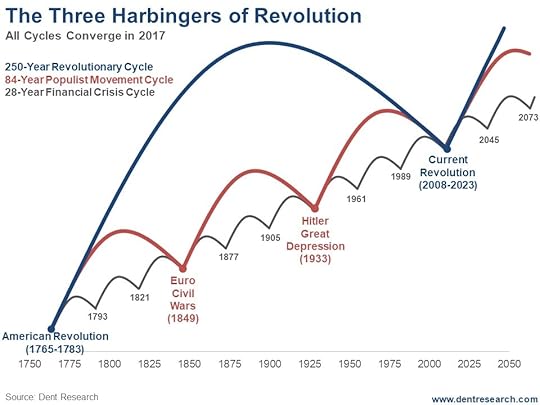 The last 84-year populist cycle hit in 1933 with Hitler becoming Chancellor of Germany.
The previous 28-year financial crisis hit in 1989 with the S&L crisis.
The last major 250-year revolution hit between 1765 and 1783 with the American Revolution.
All three of these cycles have converged again today.
We living in an historic period…
We won’t realize how historical this period will become and how much change will come from it until decades down the road.
Economic and social progress have been on a tear since the late 1700s and that progress mushroomed the most from the late 1800s forward when Teddy Roosevelt emerged as a great leader.
My most powerful 500-year mega innovation cycle says we’re only half way through this unprecedented economic explosion. So, by all my cycles, the most critical part of this major political revolution, that started with the backlash against globalization and Trump’s populist revolution, is likely to come between 2020 and 2024… in the next administration.
The next great leader in history is very likely to emerge then.
Who wins the 2020 election and which party carries Congress will be critical.
Harry
Follow me on Twitter @harrydentjr

February 15, 2019
Debt Is Back with a Vengeance
In this, the second week of February, we got news that the Federal debt just hit $22 trillion!
Can’t say this is news to us.
The Federal debt has been doubling about every two administrations (about every eight years): $5 trillion to $10 trillion under President Bush… $10 trillion to $19 trillion under Obama.
If this trend continues (and it looks like it’s well on track to do so), that would mean, for the term after this one, we could see Federal debt at $36 trillion to $40 trillion.
And that’s whether or not Trump gets a second term.
How is that possible?
I tell you in today’s video. Watch now…
 Consumer debt is also at record levels, at $13.5 trillion!
Auto loans have surged past mortgage loans… and subprime has made a comeback, this time in the auto lending industry. It seems lenders learned something from the mortgage crisis… but not much.
Guess how many car loans are already in default… and we’re not even in a recession yet?
Student loans are seeing increasing numbers of default as well…
Listen to today’s video for all the shocking details.
Harry
Follow me on Twitter @harrydentjr
P.S. This building debt crisis is worrisome. It’s leading us down the path to the great reset I’ve been calling for. But we’re still about a year our before these dominoes trigger the end. Before then, we’ll enjoy a Dark Window opportunity in the stock market. Make sure you don’t miss it. And then stick with us to protect yourself from the downside when things start to turn bad into 2020.

February 14, 2019
The Unexpected Opportunity Outside of Stocks!
I just gave my second keynote for a major, top-secret crypto conference. It was SO secret, the organizer didn’t disclose the location on the website and only let us know where to travel to at the last minute.
These techno visionaries want a bottoms-up world like me, but with total transparency and total privacy! And that’s what Blockchain technologies are all about. In fact, I see that as the next revolution to follow the internet.
And it’s bubbling like the internet did initially as well!
But remember…
That’s why it’s important that we remember that the internet, in the very late 1990s started with an extreme bubble that exploded into February 2000 and then collapsed 93% before beginning a real bull market that’s only peaking now.
Breakthrough new technologies always start with a “hype” phase during which their potential is dramatically overstated in the short term.
Then, when that bubble collapses, the technologies are underestimated until the “real” bull market becomes evident after a few decades.
I am clear about one thing. If stocks have this “Dark Window” final blow-off rally that looks increasingly likely to me, bitcoin and cryptocurrencies will almost certainly have their own dramatic blow-off rally as well.
Recall that bitcoin exploded from $1,350 in May 2017 to $19,780 in just seven months! That makes it the most dramatic bubble in history, greater than even the infamous tulip bubble into 1637.
My projection…
Here’s my projection for Bitcoin if stocks see a final blow-off rally and top:
 I can look at the entire bitcoin bull market since 2011 through the Elliott Wave filter. When I do that, it looks like the classic 5-wave rally.
The first wave peaked in late 2013 and crashed 87% into early 2015.
The next wave peaked in December 2017 and crashed, thus far, 84% into its recent low around $3,200.
If it repeats the 87% crash previously, that would be put it as low as $2,600 just ahead.
Then, if stocks take off soon, as I expect they will, bitcoin could easily rally to new highs.
The target…
My best estimate, and it could be higher, would be $32,000.
That target would be proportionate to the internet final wave up into February 2000 after the late 1998 mini-crash – the internet and Nasdaq Dark Window final rally back then…
But this would occur ONLY if stocks see that final bubble into late 2019/early 2020.
And like last time, bitcoin is likely to peak about a month before stocks, just like it did in late 2017 and as the internet did in early 2000 before the Nasdaq and stocks peaked.
Stay tuned for a very interesting and very bubbly 2019.
Harry
Follow me on Twitter @harrydentjr

February 13, 2019
These Potential Landmines Signal Something Dark…
A border deal has been reached… in principle. Will President Trump sign it? Who knows.
U.S. trade negotiators are set to meet with the Chinese while China’s economy is taking a turn for the worse.
And the Brexit debacle will eventually conclude, one way or another, despite Theresa May’s attempts to delay, delay, delay.
With all these potential landmines, investors seem to be trading on hope. The markets bounce every time there’s a glimmer of hope of a trade deal with the Chinese… or some dovish comment out of a central bank… or even positive insight from an in-the-know politician.
We’ll see how all of this plays out in the weeks and months to come… but it seems Harry’s Dark Window scenario may be upon us.
In the meantime, the Census Bureau and the Bureau of Economic Analysis are still playing catch-up after the shutdown. That means there haven’t been any market-moving economic releases.
A few Fed officials had scheduled speeches last week, with more to come this week. But none of them said anything of great importance, so far.
As for the stock market?
It was down over the last week but bounced on Tuesday. For the most part, investors have ignored bad news, bad earnings, and the worsening economy to keep the bubble inflated.
The Federal Reserve is allowing its balance sheet to shed Treasury and mortgage-backed securities by $50 billion per month. It’s been doing so for more than a year now. And it still sits at over $4 trillion.
So why the big worry back in December?
Analysts blamed the market crash on the balance sheet reduction. Fed Chair Jerome Powell commented that the reduction was on “auto-pilot” until it was normalized to a point where it’s much smaller than the current size, but larger than before quantitative easing (QE) after the 2008 financial crisis.
He and his cronies didn’t notice any reaction when those securities matured and weren’t replaced, starting over a year ago. So, what changed?
According to former Federal Reserve Bank of New York President, Bill Dudley, he was “amazed and baffled” at the attention the wind-down is getting. He wrote in a Bloomberg Opinion column this week: “The Fed’s balance sheet isn’t the threat market participants sometimes make it out to be…”
Dudley continued by saying, “Market participants would be better off focusing on the economic outlook. This is what will drive monetary policy and the Fed’s decisions… if the outlook changes, so will the Fed’s thinking.”
Dudley contends, “…economic growth and corporate profits looked set to falter in 2019, as the effects of corporate tax cuts waned and the labor market tightened. Demand for scarce labor should increase its share of income, crimping profits.”
So, that’s why the market took a dive in December…
Thanks for the insight, Mr. Dudley!
Fed Chair Powell walked back his comment about the balance sheet reduction on “auto-pilot” shortly after the drop. Then again during his policy statement last month. In short, he said the Fed will use the balance sheet if the economy falters, and that the Fed needs ammunition beyond lowering the federal funds rate. In other words, if we see another crash like we did in 2008… expect QE again.
There’s a reason the Fed needs a much larger balance sheet than before the crisis in 2008. Member banks are required to keep larger reserves. And the Fed, by law, is required to pay interest on those reserves.
Well, I guess that explains everything…
Except for why the Fed cronies were patting themselves on the back when they expanded the balance sheet through QE, creating wealth by inflating asset prices…
Which raises the question: Why does the Fed think that by reversing this policy experiment it won’t have the opposite effect?
Hmmm…
Oh, well. It’s probably nothing. As Dudley suggests, don’t worry about the balance sheet. Rather, pay attention to the Dark Window and the opportunities it has in store for you this year.
Bond market volatility has dropped for now, but that will likely change soon. When volatility is in the normal to high range, my Treasury Profits Accelerator subscribers are more likely to see opportunities to profit! And history shows us that volatility is the norm!
Lance

February 12, 2019
Where Investors Are on the Eisenhower Decision Matrix
Dwight D. Eisenhower isn’t talked about much these days, but I still think about him from time to time. The General who would be President is responsible for many things, good and bad, that continue to influence our lives.
In the military, he notably led the invasions of Africa and France in World War II.
As president, he ended the Korean Conflict by threatening to use nuclear weapons. He shut down Joseph McCarthy by invoking executive privilege. He started NASA after Sputnik and famously oversaw the Interstate Highway System. And he signed the Civil Rights Act of 1957.
He also started our involvement in Vietnam and took part in coups to overthrow elected governments in Iran and Guatemala. Interestingly, between the military and the presidency, Eisenhower served as the President of Columbia University.
But, other than when I drive on an interstate (the highway system that Eisenhower signed into law), those things don’t bring him to my mind.
More often, and unprovoked, I think about the Eisenhower Decision Matrix.
The Eisenhower Decision Matrix…
The simple diagram has four boxes combining the words Urgent and Not Urgent with Important and Unimportant.
Eisenhower famously used this tool to determine how he would spend his time, which kept him focused on important items that could help him achieve his long-term goals.
The matrix shows up in Stephen Covey’s “7 Habits of Highly Effective People,” and I first saw it in class while pursuing my MBA. In the years since, I’ve often divided my tasks accordingly.
The same approach helps me filter information as it rushes at me through the internet and across the airwaves. And right now, some warning bells are going off.
The Not Urgent, Important information is showing weakness, even as the Urgent, Important data moves the markets higher.
It’s all about growth and earnings, and it’s what Harry has been calling the Dark Window.
Urgent AND Important
During the fourth quarter of 2018, we were cautious. We pointed out the threats to the market that included the Fed, weakening earnings, and fading effects from the tax reform. The trade war was an unexpected headwind that made matters worse.
As investors began figuring out how bad things might get, they sold off equities, hard. But the damage came too quickly, as if signaling that the U.S. had suddenly lurched toward recession, which isn’t the case. Consumers were still spending. Companies were still raking in profits.
The problem wasn’t, and isn’t, a short-term imbalance. It’s a long-term gap between the economy and the markets.
Since the financial crisis, the U.S. economy has grown at roughly 2% while the equity markets have tripled. Granted, the markets were wildly oversold at the bottom in 2009, but still, up 200% based on 2% growth? That’s a bit excessive.
It looked like the markets were long in the tooth at the end of 2017, but then the president and Congress passed tax reform, handing Corporate America a profit windfall. Many speculated it would fuel massive investment and companies would bring home trillions of dollars in offshore profits.
We were skeptical.
Why bring back money when borrowing was cheap?
With interest rates near zero for a decade, companies could borrow to fund most anything. Giving them more profits didn’t change the number of viable investments on the table. And as for overseas profits, well, companies don’t just sit on those funds. They use them to invest in foreign opportunities, or even pledge them against activities back home, such as borrowing to pay dividends or buy back stock.
Tax reform did boost economic activity in 2018, but the run up, and the hype, began to die off by the fourth quarter, which is why GDP slumped from 4% back to 2.5%. With the Fed raising rates and shrinking its balance sheet, the economic picture clouded over.
But now we know that companies posted double-digit earnings for the fourth quarter, and that annual earnings expanded by more than 20%. The numbers have given investors something to cheer about as they’ve driven stocks out of correction territory and up 10% so far this year.
All of this is urgent because it is near-term information, AND it’s important.
This is the exact thing Harry has identified as he’s called for short-term opportunities before things take a turn.
Which is where Eisenhower’s Decision Matrix, and the Not Urgent but Important information comes into play.
Not Urgent but Important
The Fed expects the U.S. economy to grow by just 2.3% this year, a definite slowdown from last year’s 3% average pace. This is part of the reason that the central bankers decided to hold off on raising rates and suggested they were flexible in how quickly they shrink their balance sheet.
On the corporate front, the companies in the S&P 500 index are expected to grow earnings by 1% in the first quarter, and by a paltry 5% for the year. And that’s if all goes well.
Looking outside of the U.S…
The ECB expects the economies in the economic bloc to grow by just 1.5%, held down by falling exports from Germany and slow growth in France. With both the U.S. and the EU in the slow lane, that just leaves China among the big three economies. And the Middle Kingdom has already signaled slower growth this year.
Just as Harry has suggested, this points to the current window of opportunity closing as the year goes on.
Which brings me back to the decision matrix…
It’s not urgent that I update my stop-loss levels. Or that I plan how to allocate cash when and if my stop-losses get hit. But it’s very important.
The time to plan for a storm isn’t when the wind is blowing 40 miles per hour and the rain is lashing sideways. It’s when the weather is pleasant but the forecast shows trouble on the way.
Think about your activities today, from research, to work, to hobbies and leisure. Where do they fit into Eisenhower’s matrix? If you have items that fall into the Not Urgent, Not Important category, consider using some of that time to make sure you’re well positioned for when the current window of investment opportunity closes.
Rodney

February 11, 2019
What to Expect if Markets Correct Next
I hate to be so cynical, but the markets love to fool as many people as possible, bulls and bears alike. This is especially true at key turning points and even more so in extreme bubbles like the one we’ve been in since late 1994, with this final phase – and it’s unprecedented QE and tax cuts – since early 2009.
This final rally (since 2009) is all “hot air.”
This recovery has been the weakest ever in real GDP, capital spending, employment growth, and productivity (I’ll talk about this in more detail in the upcoming February edition of The Leading Edge).
The Fed has created what I call “markets on crack” by printing free money and pushing short- and long-term rates down artificially.
Earnings per share have grown 119% faster than corporate profits due to companies’ ability to buy back their own stocks with cheap money from the Fed. Such free money policies always create or amplify bubbles that only burst dramatically!
Be warned…
There are NO soft landings to such extreme bubbles. (I challenge you to find just one in history.)
After the January 2018 peak, that looked like a potential final bubble top, we didn’t get that classic 40% sharp crash in the first two to three months. We haven’t seen that since the slightly higher high on October 3, but that didn’t look like a classic bubble top.
So, what’s the most likely scenario now?
A final blow-off rally… what I call a Dark Window.
But – and this is me being cynical here – first we’ll see a scary crash.
That’s exactly what occurred in the last great bubble peak into March 2000. The Nasdaq crashed 34% sharply into late 1998, then turned around and made the greatest final blow-off rally in history into March 2000.
I love it because it fakes out the bulls first, and then kills the bears, just before the crash of a lifetime, like 1929 to 1932, into 2020 to 2022.
Here’s the chart for that ultimate scenario that would still be in play even if the Nasdaq crashed down to as low as 5,500 in the coming weeks, down 32% from its all-time high ahead of most markets in late August… just like the late 1998 scenario.
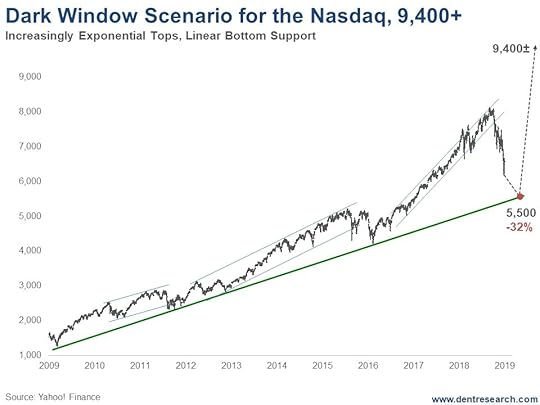 This isn’t carved into stone yet, but is still the most likely scenario so take it seriously because the greatest short-term profits would precede the greatest long-term crash and create the most profitable trades of a lifetime.
I will be watching this correction very seriously and will keep you updated! In the meantime, tomorrow Rodney will share with you an investment to add to your portfolio in preparation of this Dark Window. And on Friday I’ll share some examples of how powerful the opportunities ahead can be.
Stay tuned.
Harry
Follow me on Twitter @harrydentjr


