
Harry S. Dent Jr.'s Blog, page 33
January 25, 2019
China: A Clear and Present Danger
Something important just happened in China…
China just surpassed the U.S. in retail sales by hitting $5.64 trillion compared to the U.S.’s $5.53 trillion!
Of course, China isn’t the poster child for accurate numbers reporting, but still… the country continues to be a paradox… obviously it’s the up and coming country, but it also faces some severe problems.
I explain what these are, and how China compares to the U.S. in its growth trajectory, in my latest Friday video.
 While China now leads U.S. in retail sales, it also leads the emerging world in another area… but one that is a clear, present, and extreme danger.
Listen to my latest video for the details…

Harry
Follow me on Twitter @harrydentjr


January 24, 2019
The 27 Cities With a Mortgage Problem
Look at this insanity…
 I would never have thought this many major cities would have 11%-plus mortgages underwater… especially not at the top of a second real estate bubble.
How bad will it be when we move into the next recession depression?!
Look at Hartford, Connecticut: 43% of mortgages there are under water!
How could that be?
It’s similar to three of the other top five in that it’s more an industrial city, so it could be that it’s suffering the fate of those rust belt places, which tend to be the worst without major real estate bubbles thanks to weak incomes and demand.
In short, they’re just slowly dying.
Jacksonville is #2, with 39% of mortgages underwater. It’s an old-line insurance city, not the vacation or retirement mecca of other major Florida cities that are booming and bubbling.
Detroit, Cleveland, and Newark fit that rustbelt stereotype with 36%, 31%, and 29% of mortgages, respectively, underwater.
The next nine, from Milwaukee to Kansas City also lean toward the industrial classification.
My two previous home cities, Miami and Tampa, have 13% and 11% of mortgages underwater respectively, despite a rising real estate market.
But who’s not on this list?
The big bubble cities like San Francisco, L.A., New York, San Diego, D.C., Boston, and Seattle. Sure, they have sky high property prices, but that doesn’t put you underwater as it only increases your equity.
Of course, while they don’t have such a dangerous mortgage situation developing now, they’re still red-hot danger cities because the bigger the bubble, the bigger the burst.
Now, as data is increasingly revealing, real estate is slowing down fast. And like 2006, it’s leading the way for a broader slowdown. On November 12 last year, I showed how the U.S. Home Construction Index has been leading stock market tops by about 26 months.
My Dark Window scenario indicates we’ll see that final top in the markets later this year into early 2020. The long lead time of that index adds yet more supporting evidence.
This is just another trend that clearly warns of a recession/depression ahead, but only after we likely witness the rare Dark Window opportunity that few see coming… one last bubble to end all bubbles!
Harry
Follow me on Twitter @harrydentjr

January 23, 2019
This Government Shutdown is Blinding Investors
The partial government shutdown is obviously affecting federal employees that aren’t getting paid, but for the most part, life goes on.
These federal workers might be in a pinch right now, but eventually they’ll get paid back for doing nothing during the longest shutdown ever.
I agree with Fox contributor John Stossel who opined, “During shutdowns, government tells ‘nonessential workers’ not to come to work. But if they’re nonessential, then why do we pay 400,000 of them?”
There’s so much government waste that taxpayers probably wouldn’t notice a change if many of these agencies permanently shut down!
However, the closure is impacting Treasury markets…
Investors aren’t getting important updated economic data from agencies that aren’t funded.
Housing and other data from November and now December are delayed because the U.S. Census Bureau, Department of Commerce, and the Department of Housing and Urban Development are closed.
Even Statistics Canada is blaming the U.S. shutdown on its ability to publish international trade data. I’m just wondering why they can’t track their own data…
For now, we’ll look at December’s existing home sales, which came out yesterday.
Existing home sales is a much larger number, but they don’t give the economy the boost from associated sales of appliances, furniture, and the like as new home sales do. Nonetheless, it’s a good indicator of where overall home sales are headed.
December existing home sales disappointed in a big way!
Sales were down 6.4% on the month and fell below 5 million units annualized. On the year, sales fell 10.3%. The median sales price fell to $253,600, or down 1.4%.
Mortgage rates fell in December. That should have helped sales. It didn’t.
Of course, the shutdown delayed closings for those getting FHA mortgages and other government guaranteed loans.
Look for housing to get worse before it gets better.
Aside from home sales, another update missing this week was December’s retail sales figures.
Retail sales data is important.
It represents over half of all consumer spending, which comprises two-thirds of our economy. December is especially important, as that’s when holiday sales occur.
For the most part, stocks trade on their own fundamentals, but Treasury bond investors rely heavily on economic data to determine how yields should be priced. Supposedly, the Federal Reserve does as well.
Since some of the economic releases will be delayed, does the Fed just continue the path of quantitative tightening (QT) or shrinking its balance sheet?
Will the Fed hike rates again at next week’s meeting?
I doubt it. Not after having raised rates in December.
But remember, all Federal Open Market Committee meetings are “live,” meaning that there’s the chance they could take action and Powell will tell us about it during the press conference following every meeting.
The markets don’t expect a hike either. In fact, they’re not pricing in one for this year!
But, if we see continued market stability, I think we’ll see another hike in March.
Aside from delaying 800,000 federal workers pay, the partial shutdown isn’t stopping the White House preparations for negotiations with China.
Equity markets shot higher last Thursday after reports that Treasury Secretary Steven Mnuchin proposed lifting Chinese tariffs to calm markets and give the Chinese incentive to make deeper concessions.
Treasury yields barely moved but were slightly higher after the news broke.
U.S. Trade Representative Robert Lighthizer is resisting concessions ahead of negotiations that are slated to start on January 30. He thinks China could see the move as sign of weakness.
I could be wrong… but it doesn’t seem like a negotiating tactic President Trump would agree with.
In any case, the stock market reacted to the possibility that a deal might happen at some point in the future.
And so, the shutdown/trade war/rate hike watch continues…

Lance

January 22, 2019
Why We Should Love Oil Pipelines
The Keystone XL Pipeline remains the poster child for unwanted oil and gas pipelines.
This TransCanada Corp owned pipeline would shorten the distance between two existing points on the greater Keystone Pipeline, from Hardisty, Alberta, to Steele City, Nebraska.
The XL section drew protests and sit-ins, even though the owner had completed all environmental requirements. The fact that it would carry oil over a shorter distance than the original path didn’t matter either.
The Obama administration sat on the approval, which tacitly meant not approved. President Trump signed off on the pipeline early in his tenure, much to the chagrin of environmentalists.
Stories like this make the news, but they distort reality…
There are plenty of us who love pipelines. It’s not the thousands of miles of steel and concrete that attract us. It’s what all of it represents: jobs and industry.
Recently, the Gulf Connector Project, developed by Williams, was opened for business. The Gulf Connector taps into the 10,000-mile Transco pipeline that extends from South Texas to New York City. It delivers natural gas across the Southeastern and Eastern U.S.
We need these pipelines because Americans are using more natural gas, which is a good thing.
As our economy and our population grows, we use more energy. Natural gas burns cleaner than coal. Switching from coal to natural gas is much better for the environment. And it allows us to use an inexpensive, domestic resource.
And we’re not keeping all the good news for ourselves…
We’re becoming a major exporter of natural gas by shipping much of it through existing pipelines to Mexico. And now we liquify the fuel for transport on liquified natural gas (LNG) ships.
The newest addition to the Gulf Connector Project brings gas from the Transco Pipeline to the LNG export facilities at Corpus Christi, Texas, and Freeport, Texas. The Gulf Connector already delivers LNG for export to the Sabine Pass Liquifaction project in Cameron Parish, Louisiana.
The demand for natural gas from export facilities served by the Transco pipeline is expected to expand by 11 billion cubic feet per day by 2025.
Can you say, “Jobs?” Or perhaps, “Industry?”
On a separate but related note, through the first 10 months of 2018 ,the U.S. was on track to export more natural gas than it imports. That would make it the second year in a row that we’re a net exporter of the fuel. The energy department anticipates that U.S. natural gas production for 2018 will reach a record.
All that gas has to go somewhere…
We export more than five billion cubic feet per day to Mexico through a myriad of pipelines (there’s that word again!) that drape across Texas. Adding LNG facilities makes the energy pie bigger.
Two LNG export facilities operated last year: the one in Cameron Parish, Louisiana, and the Cove Point facility in Maryland. The Corpus Christi recently came online and the Freeport terminal should be online soon, and there are several others in the works.
All of this points to the domestic energy sector getting stronger, and to the U.S. solidifying its position as the largest energy producer in the world in the years to come.
This leads to energy independence and gives us greater control over our future.
As for investing in the sector, that’s generally done through MLPs, which Charles Sizemore typically covers in his Peak Income newsletter.
So, if you’re interested in this space, follow his work and he’ll let you know when these investments are back in favor, which might be soon as they’re trading at cheap levels right now.
In the meantime, you can smile when you see, or read about, energy pipelines, because you know they symbolize our nation’s growth, strength, and move toward cleaner energy.
And those are things we can all be happy about.

Rodney

January 18, 2019
The Stock Markets New Dumb Money
Well, it seems we have a new phenomenon in the stock market…
It’s called, “Who’s the dumb money?”
It used to be shoe-shine boys in 1929, when Kennedy stopped buying stocks and made his fortune buying them at the bottom.
I remember, during the tech bubble, taxi drivers were telling me what to buy.
It used to be that they were the dumb money… the suckers piling in at the top of the bubble only to have their feet swept out from under them.
Guess who’s the dumb money now…
I’ll tell you in today’s video.
 We began talking about this shift in dumb money in March 2018 already.
So, what created it?
What’s driving it?
And why is it so dangerous?
Listen to my video to find out.
Harry
Follow me on Twitter @harrydentjr

January 17, 2019
Why Trump’s Border Wall Could Be Catastrophic
Trump wants a wall.
Will he get it? Unlikely.
But he’s making federal workers pay a painful price while he fights for it.
Should we even be discussing it? Should a border wall even be on the cards when more illegals are going home than coming here in the last several years?
Look. I get it. Every country has specific immigration needs, or wants, and so their policies are all different.
Some countries need immigrants more than others.
Some will value the homogeneity of their culture more than others.
Others, like Singapore, the U.S., Canada, Australia, and New Zealand, are better at assimilating immigrants, being immigrant nations from day one. They also have the advantage of being English-speaking, which is compelling to aspiring immigrants, especially for their kids.
Regardless, a country’s immigration policy has a bigger impact on that nation’s success than most would think.
Why it’s important to get immigration right…
Countries, like the U.S., that attract lower-educated but highly motivated immigrants, benefit. Those that attract more educated immigrants do even better, like Singapore, Australia and Canada (and in this regard, Canada has us beat).
Refugees that come from very different cultures, and who often don’t speak English, are the most challenging for any country, and least likely to create positive economic benefits… ask Angela Merkel in Germany.
One thing is for sure: ALL developed countries are going to need more, high quality immigrants in the coming decades!
That’s because these countries are aging and will have an increasing shortage of younger innovators and workers.
Japan is the poster child for this situation… and a clear demonstration of the devastating effects of both low births and a BAD immigration policy!
What we should be doing…
Rather than trying to keep immigrants out, developed countries should be (and very soon WILL be) competing for the best immigrants from emerging countries, where populations are still young and growing.
Immigration has been a driving force in the rise of The Donald… and in this ridiculous border wall stand-off.
From a social perspective, I understand that many people worry that we’re diluting our culture and the opportunities for those in it. But there is no question that our overall economic growth and the accompanying job opportunities will be stronger if we attract more and better immigrants.
Singapore and Australia are the best at attracting the largest volume of immigrants, and higher quality to boot.
Talent poachers…
Canada is the greatest at attracting the highest quality.
More than 65% of foreign-born adults living in Canada in 2017 had a post-secondary degree, the highest in the OECD.
As Stefane Marion, Chief Economist of the Bank of Canada, says, “We are the biggest talent poachers. As a result, the country is better equipped to deal with globalization and technological change.”
Amen to that!
And this is another reason we’re fighting immigration…
Due to the “poorer quality” of (illegal) immigrants past and present, we aren’t as able to deal with progress.
Since 2006, Canada has not just beaten us in the quality, but also in the quantity of immigrants, compared to their population.
See for yourself…
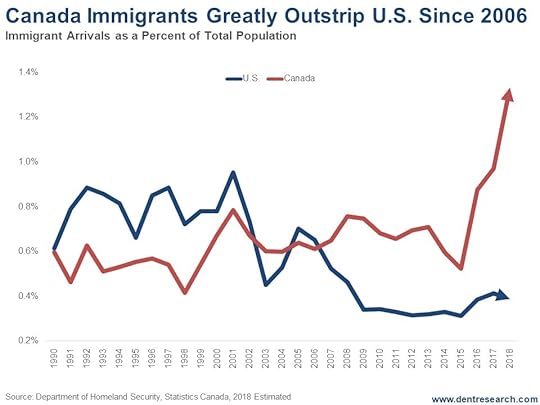
The most direct consequence of this: 2018 to 2023 population growth rates are forecast to be 0.98% in Canada, but just 0.64% in the U.S., 0.49% in the U.K., 0.46% in France, 0.01% in Italy, 0.0% in Germany, and -0.36% in Japan.
Canada’s population growth rates are 53% higher than ours.
The only thing we’re leading is the retreat from immigration, right into the jaws of our own demise!
Forget the wall, Trump. Instead, fix our immigration policies.
Harry
Follow me on Twitter @harrydentjr

January 16, 2019
Gov’t Shutdown, Trade War, and the Market
Deal or No Deal? That is the billion-dollar question on both sides of the Atlantic.
Despite what we’ve been led to believe, the Federal Reserve Bank of the United States is not a benevolent government agency set up to act in the interest of the public. Instead, it’s a private entity set to act as the means to fund the U.S. government with the mandate by Congress to provide for maximum employment and stable prices.
Stable prices, to the Fed, mean that the level of inflation that’s acceptable is around 2%. Banks want inflation to boost lending profits.
The Federal Reserve is simply an organization set up to make sure banks are profitable and the U.S. government has resources to fund its trillions of dollars in mostly wasteful spending.
We, the public, don’t need a central bank to help guide our economy and the idea that the Fed has the tools to do so, is ridiculous.
It Does More Harm than Good…
The Fed is more likely the cause of financial disruptions than it’s been helpful in avoiding them.
The Fed does have the power to move the markets through its actions, and traders like us will try and profit from those moves.
Federal Reserve Chair Jerome Powell has been steadily losing credibility with the markets since December’s rate hike.
Powell’s comments after the December policy meeting indicated that Fed policymakers lowered estimates for additional rate hikes in 2019 from three to two and lowered the estimate for the neutral rate from 3% to 2.8%.
Stocks have yo-yoed since the meeting.
After last Wednesday’s release of the meeting minutes…
Major news outlets have heralded the end of this historic bull market. Yet America’s
…it’s clear that there’s uncertainty about the timing of future hikes.
While many Fed officials are willing to be patient on any further hikes, a few officials favored not hiking in December, and others believe that downside risks have increased.
The confusion stems from the Fed saying that economic data is strong, but market data proves otherwise.
Is the Fed reacting to economic developments or is it reacting to financial market movements?
Powell said that the Fed can be patient on rates. They’re waiting and watching and willing to be flexible if need be.
And when Powell went on to mention that the Fed wants the balance sheet to return to a more “normal” level, and that it would be substantially smaller than now, but larger than before the crisis, stocks sold off.
What the Numbers Look Like…
The update on wholesale prices was a disappointment. The December Producer Price Index (PPI) fell 0.2% on the expectation it would remain steady on the month.
Excluding the volatile food and energy component, it also fell 0.1% on the expectation it would rise by 0.2% on the month.
Wholesale price tend to lead consumer prices and, last week’s consumer price update was also a disappointment.
Friday’s Consumer Price Index (CPI) fell 0.1% on the month and fell from 2.2% to 1.9% on the year.
The energy index fell 3.5% in December, while the gasoline index fell 7.5% last month. In November, it fell by 4.3%.
Core inflation (less food and energy), moved up 0.2% on the month and remained up 2.2% on the year, as expected.
Treasury yields fell after a significant bounce over the last week.
Even though the Fed’s contention that economic data is strong, inflation seems to be sagging. If we continue to get mixed messages from the Fed, expect market volatility to continue.
That’ll be good for us since market volatility tends to trigger trading opportunities more often.
A Brick in the Wall
It doesn’t look like President Trump will give in to Democrat’s demands regarding the border wall.
Monday marked the longest government shutdown ever seen.
As for the trade deal with China?
That’s another question mark in the mix…
The stock market tanked Christmas Eve, then recovered by 10% (mainly because of the hope a deal would be struck). It seems that the hope for a deal is now in troubled waters. Though the White House seems positive about the direction of talks, and China said the talks helped to establish a foundation to resolve differences, details of the actual issues were missing.
In any case, the U.S. and China agreed to maintain close communication on trade, unlike President Trump and Democrats on the shutdown.
In the face of the lack of a trade or budget deal, Treasury yields climbed, along with stock market, in the last week. After dipping to 2.9% a couple weeks ago, the long-term Treasury yield bounced back to 3.05% late last week.
I’m not too confident that the Fed will act to prevent another eventual downturn.
So, stay alert. And stay tuned!
Lance

January 15, 2019
The Market View from the Window
I love television. Not because of the shows or because I watch a lot, but because I can turn it off.
I don’t think twice about watching 15 or 20 minutes of a show, and then turning it off and moving on to something else. I do the same thing with CNBC, which I typically have on during the trading day.
When I’ve heard (or seen, if I have the sound off) the umpteenth person come on and tell me why the Fed/U.S. dollar/markets/Congress/China will or won’t do something, I have the power to simply shut them all out.
It’s like the world’s best window…
Whenever I want, I can simply pull down the sash and boom! It’s out of my life. This can be wildly gratifying, allowing me the mental freedom to take an afternoon off or simply focus on other tasks.
But unlike tuning out an old movie or a sitcom rerun, when it comes to the markets, turning off the television or ignoring my quote system doesn’t end the madness. I might get a reprieve from the latest talking head, but the action still takes place.
Just like a window in my house, I can close the blinds and ignore the rain or sun, but when I finally venture outdoors it’s still going to be hot or wet. And I’m better off if I know the weather before I go outside.
So, for better or worse, I keep my window on the markets open, at least a bit, and try to see past the distractions.
The storm on the horizon…
Right now, it looks like clear weather in the short-term, but there is definitely a storm system headed our way.
Over the next several weeks, U.S. companies will report fourth-quarter earnings. The numbers should be great, up 20% or more over the fourth quarter of 2017. The question mark surrounds guidance.
Will companies be cautious in the views of the future?
Analysts have been busy marking down their forward estimates, dropping their 2019 guidance from 10%-plus to maybe 6.5%.
I think that’s a bit disingenuous.
The 2018 tax cuts weren’t a one-time thing. They were permanent, so they give companies more free cash to invest, use for R&D, or to send back to investors through buybacks and dividends. Earnings will probably grow at half the rate of 2018, but that’s still 10%.
We should also get some resolution on the trade war.
This battle has lasted for more than six months and is hurting a lot of U.S. interests. Granted, it’s taking a greater toll on the Chinese, which is fabulous. I’d love to see them capitulate on the big issues of market access, tariffs, and intellectual property. Any compromise will be more than we had before the trade war started.
And then there’s the government shutdown. It’s hard to see how President Trump will let federal workers miss two paychecks. Whether the two sides reach a deal, or he uses emergency powers, we’ll likely see the shutdown end before the calendar rolls to February.
Finally, the Fed has capitulated…
Fed Chair Powell has declared the central bank to be data dependent, which is the equivalent of saying, “If the markets dip, we’ll step away from rate hikes.”
Taken together, these elements could drive the markets higher in the short-term. But the good times won’t last. The storm is out there… and moving our way.
Chinese economic growth is slowing, with officials now expecting GDP to increase 6% or so. Of course, that’s a fantasy number. Private estimates put the Middle Kingdom’s growth closer to 1%, which is supported by millions of empty homes and debt bursting at the seams.
The Chinese might be able to borrow and spend for a little while longer, but eventually their economy will contract, and it will be painful. China is now the second largest economy on the planet even though it’s still classified as a developing nation.
Here at home, GDP growth has eased back to the mid 2% range, just as we expected. That’s not going to kill our economy, but it will make investors think twice about how far stocks can run ahead of economic growth.
While the Fed has raised the data-dependency flag, it’s still reducing its balance sheet by $50 billion per month, which isn’t chump change.
Add to those economic headwinds the political fights coming out of Washington for the next two years, and you’ve got a recipe for an ugly downturn in the markets, if not an outright disaster.
Look through the Dark Window…
This makes it hard to decide between anticipating growth or preparing for a fall. Harry recently shared with you his idea of the “Dark Window,” the 90-year cycle which we’ll of course follow in our flagship publication, Boom & Bust, for the next several months.
But if you’re struggling with how to proceed and want more, check out Lee Lowell’s Instant Income Alert. He uses a great strategy that pays you cash, with the worst outcome being that you’ll own great stocks at cheap levels.
As we face a bit of sunshine ahead of what could be a major storm, this approach can give you peace of mind while still lining your pockets.
Rodney

January 14, 2019
Nasdaq: 3… 2… 1… Blastoff
Everything in life is exponential – or progressive – not linear.
But, just like the earth looks flat when we walk short distances or look to the horizon, most short-term progress looks linear. So do most stock booms and busts, for that matter.
Gain some elevation between you and that horizon, and suddenly the perspective changes.
The exponentiality in stocks becomes perfectly obvious when you take a longer view, and especially when you look at the rare bubble periods, like 1912 to 1942 and presently between 1995 and 2022 ahead.
That’s the thing: Bubbles grow exponentially (progressively), visible even in the short term.
See for yourself…
Here’s the best example in the leading bubble index, the Nasdaq since 2009.
 If the Dark Window scenario I’m forecasting comes to fruition – that is, stocks see a huge rally in the next several months – it would logically be a sharp, progressive move.
Note that the first wave up on the Nasdaq, from early 2009 into mid-2015, saw a 3,967-point gain in 6.2 years.
More importantly, note that the next wave up saw the same approximate point gain in just 2.6 years (almost 2.5 times faster). There’s that progressive (exponential) move.
That means the next move up could see a 3,924-point gain in 42% of the time, or 1.1 years. So, we could see the Nasdaq break 10,000 by January 2020 because bubbles follow this exponential path. That would be a 63% gain from the December lows.
Who on Wall Street is expecting that?!
If the markets make lower lows ahead, that would reduce the targets. If the Nasdaq falls all the way back to its strongest lower trend-line support at 5,500, I’d only expect the blow-off rally to take the index up to 9,400. Still, that would be a 71% gain from a lower start.
If we have this final blow-off rally, the odds are strongly that it won’t go out with a whimper, or a slight new high, as most bullish Wall Street analysts are predicting.
Instead, it will go out with a bang, bringing the largest one-year and most progressive run we’ve seen thus far.
If the S&P 500 can hold 2,300 in the weeks ahead, this final blow-off or Dark Window rally is even more likely.
If the Nasdaq can hold 5,500, a good bit lower, it’s still a clear possibility.
Harry
Follow me on Twitter @harrydentjr

How Nasdaq 10,000 is Possible in Just 1 Year
Everything in life is exponential – or progressive – not linear.
But, just like the earth looks flat when we walk short distances or look to the horizon, most short-term progress looks linear. So do most stock booms and busts, for that matter.
Gain some elevation between you and that horizon, and suddenly the perspective changes.
The exponentiality in stocks becomes perfectly obvious when you take a longer view, and especially when you look at the rare bubble periods, like 1912 to 1942 and presently between 1995 and 2022 ahead.
That’s the thing: Bubbles grow exponentially (progressively), visible even in the short term.
See for yourself…
Here’s the best example in the leading bubble index, the Nasdaq since 2009.
If the Dark Window scenario I’m forecasting comes to fruition – that is, stocks see a huge rally in the next several months – it would logically be a sharp, progressive move.
Note that the first wave up on the Nasdaq, from early 2009 into mid-2015, saw a 3,967-point gain in 6.2 years.
More importantly, note that the next wave up saw the same approximate point gain in just 2.6 years (almost 2.5 times faster). There’s that progressive (exponential) move.
That means the next move up could see a 3,924-point gain in 42% of the time, or 1.1 years. So, we could see the Nasdaq break 10,000 by January 2020 because bubbles follow this exponential path. That would be a 63% gain from the December lows.
Who on Wall Street is expecting that?!
If the markets make lower lows ahead, that would reduce the targets. If the Nasdaq falls all the way back to its strongest lower trend-line support at 5,500, I’d only expect the blow-off rally to take the index up to 9,400. Still, that would be a 71% gain from a lower start.
If we have this final blow-off rally, the odds are strongly that it won’t go out with a whimper, or a slight new high, as most bullish Wall Street analysts are predicting.
Instead, it will go out with a bang, bringing the largest one-year and most progressive run we’ve seen thus far.
If the S&P 500 can hold 2,300 in the weeks ahead, this final blow-off or Dark Window rally is even more likely.
If the Nasdaq can hold 5,500, a good bit lower, it’s still a clear possibility.
Harry
Follow me on Twitter @harrydentjr


