
Harry S. Dent Jr.'s Blog, page 30
March 8, 2019
The Difference in GDP Between Now and the Great Depression
Since my first book, way back in the 1980s, I’ve warned that we’d see an Economic Winter Season between 2008 and 2023. And since 2008, it looks like I was way off. We weren’t clearly in a depression, although we did get the worst recession since the 1930s. In fact, we seem to have grown – albeit slowly – thanks to the free money from central banks.
Yet…
When we compare the cumulative real GDP of the 11-year period from 1929 (the market top) through 1940 (the bottom of the Great Depression) to the most recent 11-year period from 2007 through 2018… the picture is very different.
It turns out that we’ve performed slightly WORSE during this Economic Winter Season than we did during the Great Depression!
We just haven’t felt it in the same way because QE efforts muted the effects!
I share all the numbers comparing the two periods, and explain what the hell has been going on, and why we are, in fact, in the Economic Winter Season, in today’s video. I also explain one key difference between the two crises in the Great Depression and the two in our modern Great Recession, with the worst crisis still ahead. In the 1930s, the worst crash and depression came first. This time that most deadly crisis comes last!
Listen now…

Harry
Follow me on Twitter @harrydentjr
P.S. My thanks to David Stockman, who will be speaking again at our Irrational Economic Summit in Washington D.C. this year. It was he who alerted me to these numbers and the shocking revelation they make.


March 7, 2019
65 Million Things You’re Not Hearing About China Trade War
China’s been playing hardball with the U.S. over trade talks. There’s good reason: they’re gunning for the title of Top Global Economic Power, above the U.S. and other players.
They’re embracing the short-term pain to win the long-term fight.
But…
They have growing problems, with slowing growth and exports, and we’ve heard much about this lately from Main Street. But those are only symptoms.
Deep down, they have a demographic problem, an overinvestment-in-infrastructure problem, and a real estate problem. Today, let’s talk about that last one.
I recently talked about Japan’s housing crisis. There, 8 million homes stand empty (that’s 15% of their market)!
Well, compared to China, Japan’s real estate problem is a minor crack in the foundation.
In China, 65 million homes stand empty!
That’s 22% of all urban homes there.
And it’s the worst in tiers 2 and 3. Check it out…
 A quick note on the Chinese city tier system: While the Chinese government doesn’t officially recognize this system, it’s become a popular way for people and businesses to differentiate between cities, which reflect differences in consumer behavior, income level, population size, consumer sophistication, infrastructure, and so on.
Tier 1 cities are the most developed in the country, with the most affluent and sophisticated consumers. They’re crammed full of people, and as urban metropolises, they have a huge economic, cultural, and political influence in China.
Tier 1 cities include Beijing, Shanghai, Guangzhou, and Shenzhen.
Now look back at that first chart. See how Tier 2 and Tier 3 cities share the largest proportion of empty homes? That’s where the greatest overbuilding has been as Tier 1 cities run out of space to build.
That’s a problem!
But Is China’s Problem Worse than Japan’s?
I said earlier that, compared to Japan’s empty homes problem, China’s is much more severe. Of course, we must consider that China is a much larger country than Japan, with 1.4 trillion people compared to Japan’s 127 million (I rounded up those numbers).
A fairer comparison would be between China’s 465 million households and Japan’s 49 million.
China’s empty homes as a percentage of urban households are 14.3%. Japan’s is 16.3%. But that’s not counting empty homes in China’s rural areas. I couldn’t find numbers of the rural empty-homes situation, but I’d be willing to bet it’s high enough to make the situation in the Red Dragon far more precarious than in the Land of the Rising Sun.
Besides, 75% of Chinese net worth is in real estate!
“Build it and They Will Come?” – Hardly!
Japan’s empty homes are concentrated in rural areas, where they’re worth much less. And while there was some overbuilding, Japan’s biggest problem is a dying population.
China, however, is home to so many empty homes… well… because the government simply overbuilt!
Of those 65 million empty urban homes in China, 23 million – or 35% – have been built just since 2011.
Vacant homes in Tier 2 cities have gone up the fastest as a percent: 18.8% to 22.2%.
Empty Tier 3 city homes have been the highest in numbers, but have grown a little less in percentage terms, from 19.0% to 21.8%. Home sales have fallen around 15% since May 2018 in these cities, thanks to the slowest demand. That’s a sure sign of the inevitable housing collapse ahead.
And the fact that home prices have surged since 2015 is another sure sign of trouble…
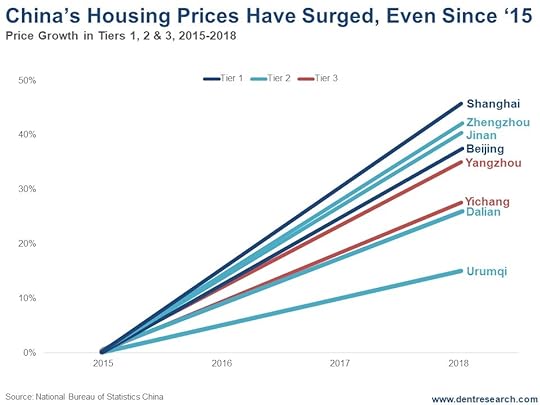 Home prices have been the strongest in Tier 1 cities like Shanghai, up 47% in the last three years, and Beijing, up 38.5% during the same time.
The top Tier 2 city has been Zhengzhou, up 42% since 2015.
And the top Tier 3 city has been Yangzhou, up at 37%.
But remember: The bigger the bubble, the bigger the burst.
China is the victim of the biggest overbuilding spree this century. As a result, it’s enjoyed the greatest bubble compared to income of any major country. Accordingly, it will suffer the worst when the dream crumbles.
My bubble model forecasts a Shanghai property price burst of 78%!
And it could take over a decade to play out.
That’s greater than the 67% real estate crash Japan endured in the 1990s, when it had overbuilt and bubbled into its 1991 peak. The U.S. only suffered a 34% decline in home prices during the 2006-2012 crash.
With 75% of Chinese net worth in real estate, this will cause the greatest evaporation of consumer wealth in history.
China’s playing the long game in the trade war with the U.S., but it may have overestimated its strength.
Mark my words: History will show that this trade showdown will be the wrecking ball that downsized the dragon from its real estate overbuilding “Achilles Heel.”
Tread carefully if you’re investing in real estate. Right now, the markets are walking a hair-thin tightrope with Chinese as the greatest foreign investors in English-speaking markets like ours.

Harry
Follow me on Twitter @harrydentjr

March 6, 2019
The Coming Volatility Explosion
Some of those shutdown-delayed economic reports are finally coming in. The Census Bureau and the Bureau of Economic Analysis (BEA) should have most economic reports updated by the end of April.
Last Friday, the BEA released the December Personal Income figures. With that, there’s some good news and some bad news…
Spending in December declined, as expected. It fell 0.5% – worse than the predicted drop of 0.3%. But income rose a healthy 1% compared to the anticipated 0.4% rise.
The bad news… January income fell 0.1% on the expectation of a 0.3% rise.
Then there’s the mixed bag of the sousing sector…
The housing sector was in a downtrend for a good chunk of 2018. And it’s likely to continue to falter as we move through 2019.
Housing starts and permits were updated for December. Like the poor existing home sales figures, housing starts collapsed by 11.2%. Permits increased by 0.3%, which was better than expected. Maybe that’s a sign that starts will be better in January? Only time will tell…
Year over year, housing starts tumbled 10.9%. That was the biggest drop since 2011.
Last week, January pending home sales had rebounded more than expected on the month, up 4.6% versus the 1% expectation. But on the year, pending home sales were still down 2.27%. This is now 13 straight months of declines.
Mortgage rates declined on the month, too. So, it stands to reason that sales should rise.
That’s some much-needed good news. Especially for an economic sector that’s a bellwether to the direction of the economy.
GDP better than expected…
The much anticipated fourth-quarter gross domestic product (GDP) report was updated last Thursday. It included information for the advance release and the preliminary release and was better than analyst expectations.
GDP grew at an annual rate of 2.6%. That’s better than the 2.2% consensus expectation.
The GDP update also showed that consumer spending grew by a strong 2.8%, despite a sharp drop in December spending.
But if spending doesn’t pick up the pace a bit, I expect GDP to slow down even further.
In fact, the Atlanta Fed’s GDPNow estimate that was updated Monday for the first quarter of 2019, stands at a measly 0.3% rate of growth.
Low volatility, fewer opportunities…
Since January, volatility has dropped off a cliff.
Until Friday’s jump in yields, the long-term Treasury yield bounced between about 2.99% and 3.07% in the last two months.
Lower volatility means that the market is getting, or is already, complacent. Sooner or later, when there aren’t expected to be any surprises in any market – not just in Treasurys – the market will get shocked. When it does, volatility will explode!
And we’ll be ready when that happens. Remember, for Treasury Profits Accelerator, volatility is our bread and butter.
It’s not like there isn’t anything going on in the world…
Here in the U.S. alone, political infighting is getting worse by the day.
Negotiations with the North Koreans to eliminate their nuclear weapons are going nowhere.
And the trade deal with China to open up its markets and eliminate unfair trade practices is coming to a close one day, then sparking another trade war the next.
Things are happening. Only they’re happening without decisiveness, and the markets seem to be reacting in a similar fashion.
The Treasury market isn’t so worried about trade or geopolitical risk. But it does move on economic data that has been delayed because of the government shutdown. What data that has come in suggests that the economy looks to be slowing and the Federal Reserve will not hike rates anytime soon. As I said, the delayed economic reports should be up to date by the end of April.
The MOVE index…
According to Bloomberg, the MOVE index – which tracks volatility of the one-month Treasury – volatility is at a 28-year low. On top of that, volatility measures for foreign exchange, stocks, and emerging markets have also dropped sharply since the end of 2018.
The market seems to be telling us there’s no chance of any big moves in the Treasury market, despite increasing geopolitical tensions and weakening economic data.
The central bank of the world, our Federal Reserve, has reinforced this idea with its continued easy money policies. Fed Chair Jerome Powell testified before Congress this week and said our economy is doing great… but monetary policy will be determined by incoming data. So far, inflation has been muted and jobs are plentiful.
The Fed Chair also noted that growth has slowed in some major foreign economies. Particularly in China and Europe. He also noted risks to the global economy because of the uncertainty in the Brexit outcome and trade negotiations with China.
The markets are getting complacent, if they’re not already, by betting that Fed policy will only accommodate those less than desirable outcomes to any possible risks.
I’m betting that this will end soon.

Lance

March 5, 2019
The Green New Deal Has Already Worked
If you have assets, income, or both, then you are responsible for every bad thing that has happened in the U.S. But don’t worry! The Green New Deal, co-sponsored by Rep. Alexandria Ocasio-Cortez and Sen. Ed Markey, will give you a chance to fix it.
All you have to do is sign over, well, everything to the central government, which will then use its wisdom to determine how we should live for the foreseeable future so that all outcomes are equalized and no one is left behind.
Good-paying jobs? Check.
Universal healthcare? Of course.
Free education? For everybody!
Pollution? Zero (after 2050).
Respect all indigenous people? You know it.
Consider every single environmental impact for every action ever undertaken? Duh.
After all, it’s your duty…
As you read the Green New Deal proposal, you’ll find that it says it’s not just a good thing to do this, it is the duty of the United States to go down this path.
The document would be laughable except for one thing. Few people are laughing.
More than 600 organizations signed in support of it, and so have dozens of individuals, including many Democratic Presidential hopefuls.
It’s hard to say any of them think this proposal, which is more of a college freshman’s dream or a description of Cuba or Venezuela from the good old days, is realistic, but that’s not the point.
As AOC, as she’s called, explained in her Instagram chat while chopping vegetables, the goal is to move the boundaries of the conversation far enough with the extreme Green New Deal proposals that a carbon tax would look like the moderate option.
America, you just got played…
The Overton Window
AOC and Markey used a tactic that recalls the Overton Window, a reference to a range of scenarios within two extremes that are considered possible.
The goal of the policy conversation isn’t to land on one particular thing, it’s to expand the window one direction so as to put more options on the table.
To be fair, the Overton Window was first described by political scientist Joseph Overton of the conservative Mackinac Center for Public Policy. This sort of gambit has been used by people of all political persuasions, and even parents when dealing with their kids.
The key to the conversation – don’t discuss the alternatives at the other end of the spectrum.
The entire Green New Deal has been priced out at $50 trillion to $90 trillion, but that includes stuff about healthcare, job guarantees, education, etc. Let’s focus on just climate change.
Beyond getting rid of airplanes and cows, the deal to reduce emissions by 40% to 60% by 2030 and completely by 2050 would require spending about $14 trillion, according to numbers from the American Action Forum (give or take a few trillion). That’s about three times the current spending plan of the U.S. government for all of 2019 (I didn’t call it a budget because there’s no balance).
And it won’t work.
It All Means More Taxes
The most generous estimates of how to limit climate change to 1.5 degrees Celsius (beyond which it doesn’t matter because the bad changes will happen anyway) all require nations around the world to participate – here’s looking at you, China and India – and some way to extract carbon from the air on a large scale.
The first one, participation, isn’t happening, and the second, carbon extraction, isn’t technically feasible today.
But forget that. As long as AOC and Senator Markey can make you feel good about reaching a “compromise” position that calls for widespread carbon taxes instead of these extreme measures, then hey, they’ve succeeded.
The carbon tax is just the tip of the melting iceberg. If that gets through, you can bet we’ll hear demands for all sort of other taxes to pay for all the “free” stuff. It’s amazing how things called “free” by the government end up being so expensive for taxpayers.
And of course, if the Intergovernmental Panel on Climate Change (IPCC) is correct on our changing planet, a carbon tax won’t do a thing to keep temperatures below 1.5 degrees Celsius. The changes brought about by such a tax would be a drop in the proverbial bucket. But they will take more assets from us and put them in the hands of the central government, which is clearly staffed by people who are smarter than us and know more than we do.
Notice something interesting…
Notice that Miami doesn’t show up in the national conversation. The residents of Miami aren’t waiting for some proposal on high. They passed an infrastructure funding plan and have begun to work on shoring up their town (pun intended) against the potential of rising sea levels.
But we can’t discuss mitigating the effects of climate change instead of fighting to eliminate rising temperatures in the first place, because that would be opening Overton’s Window the other direction and ruin the current narrative and take money away from the central government.
I can’t imagine a single national politician signing on to such a plan.
What do you think about the Green New Deal? Good? Bad? Otherwise? Email me at economyandmarkets@dentresearch.com.

Rodney

March 4, 2019
What Boomers Will Do to Real Estate and Nursing Homes
Recently we talked about why Millennials aren’t buying a house at the same rate as their Boomer and Gen X parents. Today, let’s talk about how Boomers and Gen Xers are actually contributing to the housing shortage, and so driving up prices and thwarting the ability of younger people to buy.
And…
Why that could start to change rapidly just ahead.
First, an interesting insight…
A recent Freddie Mac study estimates that 2.5 million homes are being kept off the market, mostly by seniors aging in place rather than downsizing or moving into nursing homes, etc.
One million of those people were born between 1931 and 1941.
300,000 of them were born between 1942 and 1947.
250,000 of them were born between 1948 and 1958.
That means that the majority of these “aging-in-placers” aren’t Boomers (according to how I count that generation).
Turns out, we can’t blame them for this trend!
But there is a massive Boomer retirement trend that started in 2000 and will last into 2024…
It will see more homes kept off the market as this great generation chooses to age in place. But it will also see a ton of homes hitting the market when others opt for downsizing and nursing home care.
The question is: which scenario will trump the other?
There are two big problems here.
One, Boomers are watching in horror as their McMansions are falling in value while the value of the smaller homes they could downsize into are holding up better. That makes trading down less attractive.
Two, nursing homes are increasingly expensive, with subpar service.
However, contrary to popular opinion, Boomers haven’t yet started their trek through the peak spending wave for this sector, which peaks at age 84-plus. That’s why there is some excess capacity. They only start this journey this year.
Just look at this…
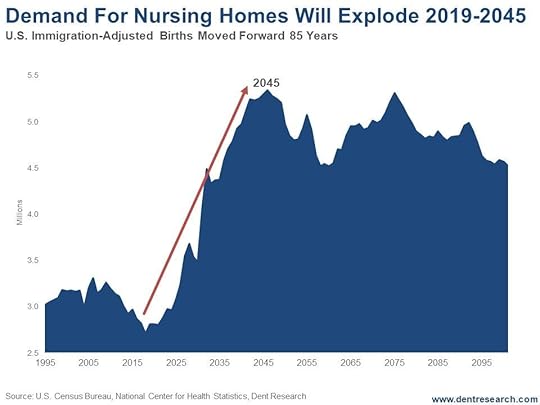 (Note that I’ve lagged the birth index 85 years in this chart.)
And I reckon that the number of Boomers who will chose NOT to age in place will quickly overwhelm the numbers that do.
Overall, I clearly see the nursing home trend flooding the property market with Boomer homes for sale. That’s what my “dyers versus buyers” indicator has said would occur in line with this trend into around 2040.
Real estate prices will buckle under the deluge.
Japan’s aging population and eight million empty homes, trending towards 15 million, would vouch for this trend.
So, don’t believe this housing shortage will continue, especially with the “Great Reset” in consumer and asset prices just ahead from 2020 into 2023 or so. It will reverse and likely rapidly!
Lower prices and Boomers moving rapidly into nursing homes will make homebuying more affordable again and raise ownership for Millennials.
But, this younger generation seems to buy less and rent more regardless of affordability. They’re more interested in spending money on “experiences.” So, Millennial home buying won’t save the property market.
Mark my words: real estate will never be what it was before the 2006-2012 crash.
Most important: Look for the great opportunity in nursing homes ahead.
The companies that can deliver lower costs and more responsive service via room sensors and other technology will make billionaires in this industry in the next 25 years!
Harry
Follow me on Twitter @harrydentjr
P.S. Again, thanks to Andrea Riquier at MarketWatch. It was her writing that inspired me to present my demographic perspective on this issue. You can follow her on Twitter @ARiquier.

March 1, 2019
Insights from Tony Robbins Platinum Conference
I’ve been at the Tony Robbins Platinum Group conference all week and, despite the cold, this is one of my favorite events of the year. Attendees – who are creative, successful, fun entrepreneurs, not corporate bureaucrats – learn from me and I learn a lot from them and other speakers!
So today I want to share with you some of the insights I gained this week. I can’t tell you everything, of course. Attendees pay a lot of money to be here and it wouldn’t be fair to them if I just divulged all the details.
One of the highlights for me was this Bubble Game that Tony played. He held up a $100 note and explained that we were going to bid for that money. Who ever bid the highest would get the cash. The runner up would have to PAY their bid, no matter what it was.
Listen to my video today to find out how that turned out… and to hear the other insights I can share.
 Peter Diamandis talked about exponential technology and what technology we can expect in the next 10 to 15 year…
Ray Dalio talked about the ideal portfolio…
And so much more. Listen now.
Harry
Follow me on Twitter @harrydentjr

February 28, 2019
Millennials Are Not Buying Homes Like Boomers Did
Andrea Riquier, my favorite commentator on the housing market, grabbed my attention again with her 2018 MarketWatch article entitled “Missing Millennial Homeownership Endangers the American Dream.” You can follow her on Twitter @ARiquier.
She pointed to a report from the Urban Institute’s Housing Finance Policy Center that suggests the “story of Millennials and homeownership is in many ways a story of inequality in America – and one that might be getting worse,” as she put it.
Let’s look at this from my demographic perspective…
Boomers bought real estate at unprecedented speed and price, thereby inflating a housing bubble from 1983 into 2005. Demand drove up price. And that made them richer, especially the ones born earlier.
We saw this coming just by looking at simple demographic trends. Those same trends also warned of the looming bubble burst and I called the top of that first bubble in late 2005, just months before prices topped out in early 2006.
We are near the end of a second bubble in real estate, one equally as inflated as the last, but created with different forces. This second bubble has arisen more from falling supply than rising demand.
The demographic hiccup here is that, while Millennials rival Boomers in terms of numbers, they don’t and won’t have the same impact their grandparents had on the economy. Their numbers are spread out rather than concentrated in a sharp wave.
A pig-smoothie versus the real pig…
Think of Millennials like a pig-smoothie passing through a python while the Boomers were the actual pig!
And, at this point in their spending wave, they’re only becoming homeowners at eight to nine percentage points lower rates than Boomers and Gen Xers did at their age.
I should note, real quick, that traditional demographers define the Millennials as those born from 1981 to 1997. I define them differently because I’m less interested in their social associations than I am in their economic impact. I split the Millennial generation into two distinct waves. The first group was born between 1976 and 1990 and the second from 1997 to 2007. But back to the story…
Millennials whose parents were renters have the lowest buying rates, at a mere 14.4%. In comparison, Millennials of parents who owned their home have a buying rate around 31.7%. More than double their counterparts, but still lower than younger Boomers did at younger ages.
These numbers also vary sharply according to ethnic groups…
What Ethnicity Does to Home Ownership
Here’s the breakdown of total ownership by ethnic groups showing the importance of home buying to wealth building…
 As you can see, white households have the highest home ownership, at 83.7%, and a high net worth at $230,000 (Note: Australian net worth is more like $450,000 from higher ownership and prices).
Asian ownership rate is 69.1%, but with a higher net worth, at $243,000 – higher incomes and savings rates contribute here.
Hispanic ownership is 64.4%, with much lower net worth at $27,000.
Black ownership is only at 47.7%, with the lowest net worth of the lot, at a mere $11,000.
So, What Does This Mean for Millennial Home Buying?
Well, as far as I see it, there are several reasons why Millennial home buying is significantly lower than their parents or grandparents at the same age. One of these is, you guessed it, ethnic makeup. The Millennial generation is more multiracial, and thus has lower buying rates from the minorities.
But, of course, there are other reasons…
They are delaying marriage and having kids because of less income security.
They have much higher student debt that eclipses down payments and mortgage qualifications.
They prefer living in more expensive cities and downtown areas at their younger age.
They saw the effects of bad lending and the first major real estate crash since the 1930s so they’re “gun shy.”
They see less opportunity and more risk in buying.
And they face tighter lending standards after the great crash.
What’s to be Done?
What can we do to relieve the rising costs?
Educate Millennials that down payments aren’t as high as they think. They’re back to 5% on average. That said, it still wouldn’t be my advice to buy now.
Relax zoning requirements that favor older owners’ quality of life and home values. This would free up land and lower costs to build for the younger ones.
But there is another trend that will greatly relieve the supply pressures that are making homes more expensive as seniors are increasingly “aging in place.” I’ll cover that on Monday. Stay tuned.
Harry
Follow me on Twitter @harrydentjr

February 27, 2019
Home Sales Warning to the Economy
Remember back when the housing bubble burst?
It happened well before the financial crisis in 2008. In fact, the air started leaking out in 2005. And it really took a blow in 2006.
Back then, I tried to sell off the handful of rental properties I owned in Tampa before the bubble did burst, but was too late.
That was right before I met Harry.
Why didn’t I listen…?
Of course, Harry had been forecasting the housing crash years before I met him, but I didn’t want to believe it. And, well… let’s just say I learned a valuable lesson, as many of us did. Housing prices don’t always go up!
Housing was one of the first sectors in the economy to turn around after the financial crisis in 2008. It was a beneficiary of the zero interest-rate, easy-money policy of the Federal Reserve.
According to the National Association of Realtors, the median price for an existing home rose to $247,500, up 2.8% compared to January of 2018. That makes 83 straight months of year over year gains!
I learned in 2006 that home prices don’t always move higher. But I worry that new home buyers might have forgotten that lesson, if they learned it at all.
Cracks are widening…
Despite home prices rising for nearly seven years straight, the pace is starting to slow. It makes sense though with sales slowing dramatically.
December existing sales fell over 6% on the month, and fell over 10% on the year. Analysts were expecting a slight bounce in sales in January.
January sales fell another 1.2% on the month, and 8.5% over the 2018 year. Ouch!
Existing home sales don’t pack the punch of new home sales when factoring in the ripple effect it has on the economy.
In other words, people who buy new homes tend to buy new appliances, furniture, and many related home items that are not related to just the construction and real estate transaction. Existing home sales make up about 90% of all home sales so we can expect new home sales to follow the trend of existing homes.
Granted, mortgage rates have been climbing since late 2016. But historically, a 4.5% mortgage is still pretty low. And it doesn’t help that mortgage rates have actually fallen over the past few months.
Catching up…
New home sales figures are behind schedule due to the government shutdown back in January, but we’ll see updated December sales figures on March 5. They’ll also announce when January through March figures will be updated.
I’ll wager that we’ll see the same ugliness in new home sales that we’re seeing in existing sales. We’re already seeing price discounting, even though average sales prices are rising. When that turns lower, we could see prices drop even further…
For now, the Federal Reserve seems to have put further rate hikes on hold. And looking at interest rate futures contracts, traders are actually pricing in rate cuts later this year. If mortgage rates drop, that could give a boost to home sales. On the other hand, it might be too late.
Housing is a bellwether for the rest of the economy. If the housing bubble bursts like it did in 2006, we could find ourselves in a real pickle.
Lance

February 26, 2019
A Counterintuitive Reponse to a U.S.-China Trade Deal?
Midnight on March 1 was President Trump’s drop-dead date for a trade deal with China, but now that hard-and-fast spot on the calendar has become mushy.
The president tweeted Sunday night that “substantial progress” has been made in talks with China. He’s delaying the proposed increase in tariffs — on $200 billion worth of goods from 10% to 25% — that were scheduled for this Friday.
It looks like the market hysteria and death of certain industries in both countries won’t be happening, at least for now. Markets zoomed higher on Monday morning in China and the U.S. after the promising news.
The sunny headlines are great, but brace yourself for the darker reality that is sure to come our way.
Brace yourself…
When – not if, but when – the trade deal with China is done, expect the markets to breathe a sigh of relief. International companies will shoot higher, and drag everything else along with them.
But this won’t mark a sign to buy. Counterintuitively, it will be the time to sell, at least for the short term.
Lifting the trade tariffs with China will boost demand for many U.S. goods and ease the pricing of many Chinese items. That’s great, and certain companies, like Apple (Nasdaq: AAPL), Ford (NYSE: F), and Caterpillar (NYSE: CAT), will breathe a collective sigh of relief.
But that won’t cure what ails the U.S. markets, which will be the focus after this deal is on the books.
The next focus will be on…
Retail sales for December fell the most in 10 years, while Corporate America posted another great quarter… but painted an ugly picture of the future.
Seven million Americans are 90 days or more behind on their car payments. And we’re getting smaller tax refunds because more of our tax reform boost was included in our paychecks.
Unemployment remains low at 4%, but wages aren’t rocketing higher.
And then there’s GDP growth. After shooting above 4% in mid-2018 based on tax reform, the Atlanta Fed now estimates fourth-quarter GDP expanded by a measly 1.5%. Ugh.
The Fed recently announced it will hold off on automatically raising rates this year. And could also end its balance sheet reduction program. Those announcements sent the markets higher. But that doesn’t make a lot of sense.
The Fed was raising rates and normalizing its balance sheet because the economy was strong. The central bank isn’t taking a break because the economy is growing so nicely. It’s taking a break because things have slowed down.
When we look overseas, the issues get worse…
European GDP is expected to grow by just over 1% this year. China has slowed down significantly, although no one can be sure of their numbers.
Germany barely escaped recession when its fourth-quarter GDP came in flat. And Japan is, well, still Japan. They print money like it’s toilet paper and pretend it’s valuable while their central bank gobbles up equity ETFs and anything else it can find.
With so many issues staring us in the face, expect traders to use any positive announcements surrounding a U.S.-China trade deal as a signal to step aside for a while.
The good news is, if that happens it should give investors a chance to pick up solid stocks at lower prices before the next leg up. Following Harry’s Dark Window forecast, we should see the markets eventually move higher this year before we get a strong selloff.
I don’t think the fundamental story of low growth and trouble overseas will change, but investors can be fickle. A move back down to recent support levels on the major indices should be enough to draw investor support.
What to do…
For investors with new money to invest, it could pay off to wait until the hype surrounding a new trade deal fades. And for those like me who are invested, we need to make sure our trade stops are up to date, as well as our new entry levels.
This round trip could happen very quickly.
Rodney

February 25, 2019
Unemployment Rate a New Leading Indicator
I’m always on the lookout for leading indicators that can give us an edge over erratic, irrational markets.
There are a lot of them.
Some are complicated, like the popular composite index from the Conference Board. It includes average weekly hours by manufacturing workers, initial applications for unemployment, new manufacturing orders for consumer goods, speed of delivery from suppliers to vendors, new orders for capital goods, new residential building permits, S&P 500 stock index, inflation-adjusted money supply (M2), spread between long- and short-term rates, and consumer sentiment.
Yes, complex AND a mouthful!
And not necessarily the best indicator to rely on.
Often, simpler indicators work best…
For example, Philosophical Economics found a new one that seems the most accurate: The change in the unemployment rate, when it’s just crossing zero towards negative, is a warning sign.
Or more precisely, when the latest unemployment rate crosses over its simple 12-month moving average… it’s telling.
Here’s the chart…
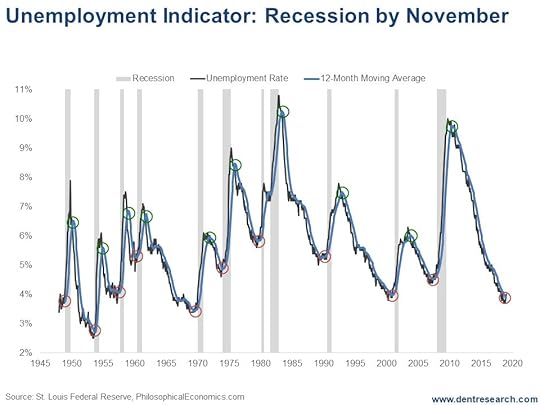 This indicator works at tops AND bottoms, as you can see in the red and green circles on the chart.
Today, we’re focusing on the red circles, which would project a recession in the months ahead.
The lead time for picking the next recession varies between zero and nine months. The average since 2009 has been 3.45 months.
But recent years have tended to be longer…
The December 2017 recession onset was preceded nine months by the warning signal from the end of March reported in early April.
We just got a new signal in early February from the January figure. It’s warning that we could see a recession start by November, at the latest… maybe earlier.
That means stocks could peak a little ahead, as they did in 2017, around September… and that is the exact anniversary of the 1929 crash on my Bubble Buster 90-Year Cycle!
All of which is right in line with my Dark Window time table.
There’s also my favorite indicator – the Dow Jones Home Construction Index – that I talk of often. It was the best predictor of the 2007 top and crash, leading the collapse by a whopping 26 months.
Well, it suggests a stock top in very early 2020…
So, my range of estimates for the ultimate bubble peak of our era has been September 2017 to March 2020, with January 2020 as the most likely…
But with this new unemployment indicator, September looks more likely to be when we see that market top!
I showed a new revers head-and-shoulders pattern in stocks in today’s 5 Day Forecast, which would project a modest correction back to 24,000 on the Dow before a surge up to new highs around 30,000 by June. Then a final wave up to follow.
Could our Dark Window blow-off rally see a Dow of as high as 33,000, or a Nasdaq as high as 10,000 by September? Absolutely!
And that will shock everyone, even the strongest bulls.
Harry
Follow me on Twitter @harrydentjr


