
Harry S. Dent Jr.'s Blog, page 32
February 8, 2019
Europe Under Pressure
The big news this week is that Europe came in weaker than expected. China’s already been weakening, but everyone expects that. After all, you can’t really trust the big reported numbers from the Red Dragon because they overstate things.
But Germany?
Germany just reported a decline in December retail sales of 4.3%!
Year over year in 2018, retail sales have declined 2.2%.
It shows that their consumer sector, which is driven by demographics, is weakening.
Most people don’t see that. We’ve seen this coming for decades.
Then there’s Italy. It fell into a technical recession… and I explain what that means and why you should care in today’s video. Listen now.


Harry


February 7, 2019
Rent to Live… Buy to Rent
Did you read Andrea Riquier’s two articles on Market Watch last year about real estate strategies?
Definitely worth it!
The first was “The new housing play: helping priced-out renters become long-distance landlords.”
It was a strategy aimed at people living in unaffordable areas like San Francisco, Los Angeles, Miami, or New York.
Rent in those areas to avoid the high purchase costs and a major bubble burst (when it inevitably comes). Then use your freed-up borrowing power to buy a house in an affordable area where renting for income is more lucrative, and far less risky. We’re talking places with high percentages of single-family rentals, like Detroit, Las Vegas, or Kansas City and a few more listed below.
 Except for Baltimore, these cities aren’t on the expensive coasts. Rather, they’re more towards the center of the country.
They have more struggling middle- or lower-income families who can’t afford to buy, even in these less over-valued areas. And besides Denver – to a degree – none of these are bubble cities that are likely to crash and crucify you.
Pick your poison…
In her second article called “Pick your poison,” Riquier showed that there are two ways to make money in real estate.
Look at this chart that rates areas by quality of life.
 The “A” areas appreciate the most at 21% annually. That’s about twice as much as the “B” and “C” areas.
The worst – “F” areas – have slightly negative appreciation rates at -0.4%.
While “F” areas are NOT places you want to buy, “A” areas are the worst at this time because they’re out of reach of most buyers and will get hit the worst when this second real estate bubble bursts.
Now, look at the average rental returns…
They’re the highest in the poorer “F” areas, at 10.1%, which is damn good.
Rentals don’t vary as much as appreciation and are still good at 7.9% in the “A” areas. But there, again, your risk is that the property value falls by 30% to 50% while you own it and wipes out many years of rental gains.
The rental appreciation rates are also higher in the lower quality areas.
There are now online companies – Roofstock, Home Union, Investability, and OwnAmerica – that help you identify, purchase, and manage such long-distance rentals.
One of the best sites at this point appears to be Roofstock.com. They charge a 2.5% brokerage fee to the seller, and 0.5% to the buyer. That’s cheaper than the standard 6% commission.
The ultimate strategy…
But here’s the ultimate strategy, and you should do this NOW, before the next crash, while it’s easier to borrow.
In the crash, rentals will tend to hold up. Housing prices will fall.
Use your equity and cash flow from owned rentals to buy the far cheaper foreclosures (often by just taking over the payments at a discount), then rent them out for even more profits.
This is what the smart money did during and after the 2008 crisis.
Hedge funds and individual investors bought single family houses for cheap, then rented them out for strong, positive cash flow.
And it gave them the potential to both buy more as the downturn progressed and to sell down the road when the market was better.
Single-family rentals attract older, more family-oriented renters that stay twice as long as they would in apartments (three years compared to one and a half years on average). And they’re less likely to default or burning down the house!
You can choose to sell the houses in a better market later down the road, and your renters may become the buyers.
Or you can just keep renting them out at stronger returns and then buy the house of your dreams in a once-expensive city of your choice when its bubble finally bursts!
Harry
Follow me on Twitter @harrydentjr

February 6, 2019
Catching Up on Critical Updates Post Shutdown
The Department of Labor tracks and updates the monthly jobs report, and since the partial shutdown, we’ve kept current on this important economic update.
But the Census Bureau and the Bureau of Economic Analysis (BEA) weren’t funded and are quite behind on other critical updates. As they play catch up on updates, we wait in the dark.
The backlog includes:
December new home sales.
Personal consumption.
The Fed’s preferred inflation index (PCE).
Retail sales.
And preliminary fourth quarter GDP.
The January Institute for Supply Management (ISM) Manufacturing Index was released on schedule Friday.
Remember, the December release of the important forward-looking and market-moving manufacturing report was quite disappointing.
The good news…
New orders rebounded by a sharp seven points after a drop of 11 points last month. Production rebounded by 6.5 points, while cost inflation flattened. Export orders slowed dramatically to the lowest in two years.
Overall, the January index surprised by showing strength and bounced 2.5 points higher than analysts’ expectations and December’s disappointment.
November’s U.S. factory orders were updated Monday.
October’s orders dropped 2.1% on the month and November orders were expected to rebound slightly. Instead, they fell another 0.6%. And, excluding the volatile transportation figures, dropped 1.3%. December’s figures are still delayed and aren’t scheduled to be released just yet.
Jobs Galore!
The non-farm jobs gained in January rose by 304,000, nearly doubling what was expected. Yet the supposed gains in December were revised lower by 90,000.
The unemployment rate increased to 4%, which is higher than the 3.9% expected. More importantly, wages only grew by 0.1% on the month when a 0.3% gain was expected. Despite that, wages still maintained a 3.2% year over year gain.
Overall, the January employment report was strong.
The stock market had its best January in 32 years and the gains will most likely continue after the better than expected jobs report.
Caution Ahead…
Treasury yields didn’t react much after the jobs report. Maybe that’s because of the large revision to December. Or maybe because wage growth was muted. The long-term Treasury yield fell back below 3% and has again flattened following the Fed meeting earlier in the week.
Look at the yield curve just after December’s meeting to last Thursday, following the January Fed meeting:
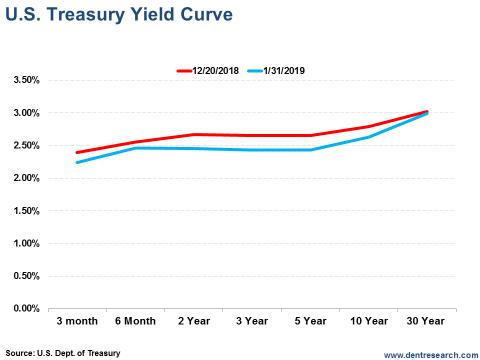 Notice how rates have dropped and more of the curve is completely flat? That tells us that the bond market isn’t as excited about the economy or the financial markets as the stock market is.
So, take this as a warning and proceed with caution!
Bond market volatility has dropped for now, but that will likely change in the near future. When volatility is in the normal to high range, my Treasury Profits Accelerator subscribers are more likely to see opportunities to profit!

Lance

February 5, 2019
Schumer and Sanders to Investors: We Want Your Money
Senators Bernie Sanders and Chuck Schumer have proposed legislation that would stop public companies from paying dividends or buying back their shares unless they first meet certain conditions.
The senators aren’t worried about viability (companies are financially stable before they send cash back to their shareholders). Instead, they want to verify that companies have done enough to support employees before they give anything back to investors.
That’s not so subtle code for, “Make sure you redistribute wealth before giving anything back.”
The senators make their case by pointing to last year’s tax reform and how much of the corporate windfall was spent on stock buybacks (almost $1 trillion), even as companies refused to invest, closed locations, and fired employees.
But in making their point, Sanders and Schumer…
Miss the point!
Companies don’t choose to buy back shares or pay higher dividends because investors demand it. They take those actions because they think it’s the best use of investor money. And that’s the crux of the issue.
Who owns the cash? Is it yours as an investor, or do workers have a claim on it, as Sanders and Schumer suggest?
When I save some of my income and invest it in corporate stocks, I’m pretty sure that it’s my money. It doesn’t magically become partially owned by someone else just because I chose to invest.
And these senators are part of the reason that most people must invest in equities. They’re part of the system that increases government deficit spending and eats away at the dollar, all while the Fed holds interest rates near record lows.
We can only get ahead if we can beat inflation, which pushes us to equities, where Senators Schumer and Sanders want to chip away at our cash from a different angle.
As for workers, the senators claim in their New York Times opinion piece that companies and workers lived in a loving, kumbaya world from the mid-20th century until the 1970s, a time of joyous symbiotic goals and dreams between owners of capital and employees.
That’s a load of bull, and it only covers a paltry 25 years (1950 to 1975), which is less time than many politicians have been in office.
They’re Missing the Whole Story
We’ve discussed this at Dent Research many times. The situation wasn’t born of some enlightenment or appreciation for one another’s feelings.
The only reason workers had power in the mid-20th century is because America played an away game in World War II while the rest of the developed world was essentially bombed back to the Stone Age.
When it came time rebuild, the world needed everything from us: factors of production, food, capital, etc. We simply didn’t have the manpower to provide everything the world needed, and our labor force was the bottleneck.
As other nations brought their factories and equipment back online, they didn’t need us as much. In fact, other countries eventually outstripped us in terms of efficiency, which caused us to lose ground in manufacturing.
But this short-sightedness is typical. Everyone looks back to the time when things were best for them, instead of considering how that period might have been just a passing phase.
Back to Sanders and Schumer.
They want to recreate the value proposition of workers from that small window in time, but without any of the other characteristics of the time.
If companies were desperate for workers, they would pay more. If America was the most efficient, growing producer in many areas, we’d need more workers… and would pay more. But that’s not the way it is, so Schumer and Sanders want to force it by simply demanding higher pay, no matter what the business environment.
Companies aren’t closing locations because they’re so profitable, and they aren’t declining to invest because they have so many wonderful opportunities. We’ve had near zero interest rates for almost a decade. If a company saw a great investment, it could access plenty of cash to chase it.
As we noted last year, corporate tax reform leveled the playing field between the U.S. and many other nations in terms of what we charge companies to do business, but it didn’t change economic dynamics. We’re still stuck in a low growth environment.
What To Do Instead
I agree that many public companies are terrible stewards of investor capital, but my beef runs up and down the corporate ladder. I can’t imagine that any CEO is worth $20 million, or even $10 million. And there are plenty of employees who’ve been contributing to corporate profits for years without enjoying the benefits of their company’s success.
It would be much more American to slash executive compensation and put all employees in a profit-sharing pool voted on by investors than to have the government require some minimum level of payment.
Obviously, those at the top would share at a higher level, but everyone would be part of the ebb and flow of business. This is not about stock options, which can be gamed by stock buybacks and other sleights of hand. Profit sharing should be based on true, GAAP accounting profits.
This is a problem created by the incestuous relationship among Corporate America and their boards. Those who run one company serve on the board of another, and they all play the same game of guaranteeing outrageous payouts at the top. If we shook up corporate boards, we might get better results.
I also think we should do the same with politicians, such as Senators Schumer and Sanders.
They’ve been part of a government that has run deficits for many years, and have been part of government shutdowns where they still drew paychecks and have guaranteed pensions.
How about they feel the financial effects of their mismanagement? Or better yet, why not just yield their positions through a term limit system, and forgo their government pensions altogether?
But that’s a topic for another day.

Rodney
P.S. What are your thoughts on this matter? Do you have any suggestions for Schumer and Sanders? Let me know at economyandmarkets@dentresearch.com.

February 4, 2019
Dalio, Tax Cuts, AAA, the Fed…?
I would like to take more time every few weeks to address some of the questions we get. And I want to hear more from you. Share your successes with me. Share you concerns. Ask questions. Challenge my arguments. That’s the only way we grow. That’s the only way we can use our unique demographic and cycles research to help you achieve your financial and investment dreams. Remember, this isn’t a one-way street. This is a conversation. So, speak up.
Speaking of, here are some questions I’ve gotten lately. You might find the answers useful…
Why Does Dalio See the Opposite of What You See?
Steven G. emailed wanting to know why I see a deflationary scenario like 1929-33 ahead while Ray Dalio sees an inflationary one like 1935-40.
That’s a good question!
Here’s the thing…
With rare exceptions, debt bubbles, which also create financial asset bubbles, end in deflation as loans and financial assets are written down and money and wealth disappear.
My long-term models show that we should have been in a deflationary mode from around 2008 through 2023. It’s a time I call the “Economic Winter Season.” But, QE was designed specifically to thwart that.
But think about that for a second. “We” printed $12 trillion and only got 1% to 2% inflation. What would we have gotten without that unprecedented QE policy?
Yup: deflation!
That’s the real trend.
Many economists also think you can just skip stages like deflation and deleveraging. History begs to differ.
I’ve spent 30 years studying economics, demographics, cycles, history, and bubbles. But, I’m not an investment manager.
Ray Dalio is one of the very best investment managers. But he hasn’t spent three decades studying economics, demographics, cycles, history, and bubbles. He should stick to his area of expertise, just like I’ll stick to mine.
Next up…
Wrong About the Tax Cuts?
John B. and John B. (two different last names) recently argued that I’m wrong about the tax cuts because small businesses like theirs needed them. They are looking to invest more. And hey, I need a gift from the government too.
The thing is, any positive impact the tax cuts could have had on small businesses like theirs and mine don’t hold a candle to what impact they had on the massive corporations, who then turned around and used them on stock buybacks, etc.
There are 14 million small businesses in this country, but most are very small. For two people to tell me that they re-invested the returns from the tax cuts doesn’t make for a very good sample size.
And while small businesses may create most of the jobs, they’re very fragmented and don’t drive the economy as much as many think.
All I can look at is the macro figures and they say companies are not re-investing like expected. That makes sense to me as we have had a low interest rate and growth environment for a long time now and businesses DO, like everyday investors, tend to over-invest when things are good for too long…
John’s, you might be right, but I’m not seeing it and can’t make financial or investment decisions on something I can’t see. Over-all we and the world don’t need a lot of new capacity currently, so why not buy back your own stocks or speculate in the markets instead.
Will You Tell Us When?
Another question came from Cynthia H. She asked, “Will you be telling subscribers when to buy AAA corporate and Treasury bonds.”
Cynthia, yes, this is a major trend I’ve been monitoring and will do my best to give the green light when the time comes. At this point, it’s more likely that bond yields go back up near recent peak yields of 3.46% on the 30-year Treasury and that would be the time to buy. Currently bond yields are trending down a bit and I would like to see them go higher first. My best estimate right now is we could see that happen in early 2020.
What’s to Stop the Fed from Printing Even More?
The last question for today is from Ian S. He asked if I see a trigger that will start the decline and what will stop the Fed from printing more money again.
Ian, the initial broader trigger appears to be corporate bonds around the world at record levels of GDP, with defaults beginning especially in emerging countries.
The biggest problem is that the economy has been stretched so far that it could melt down even faster than it did in the second half of 2008. Back then, the Fed and central banks responded too late. They’ll be late to respond this time around as well.
Also, think about this: If we printed all this money on a scale that no one would have thought possible, and we go into a deep crisis… is the public going to let central banks do it all over again, but at much higher levels?
$30 trillion?
$50 trillion?
$100 trillion?
There is now over $300 trillion in financial assets that could melt down. It could take $100 trillion-plus to offset that level of deflation.
And when (not if) China finally blows… how much money can you print here to offset that tsunami as it reverberates around the world, especially in global growth and real estate prices?
Thanks for the questions and comments. Keep them coming to economyandmarkets@dentresearch.com.
Harry
Follow me on Twitter @harrydentjr

February 1, 2019
What Is the Fed Thinking?
So, the Fed caved on Thursday, January 31, 2019.
But did they really?
Yes, Fed Chair Jerome Powell’s comments yesterday may have pleased the Donald. But they have good reason to “cave.”
And I explain exactly why in today’s video.
 None of the reality that may have influenced the Fed’s decision is news to us. We’ve seen it coming for years!
Italy.
Germany.
Emerging markets.
Real estate.
There is really only one question left… find out what it is now.
Harry
Follow me on Twitter @harrydentjr

January 31, 2019
The Fed Data Dependent, But Without All the Data…
Despite the jump in stocks after the Fed’s decision yesterday, Treasury yields held pretty steady. They’ve been steady since the government shutdown began last month and have remained steady since it reopened.
The long-term yield fell to 2.9% the first trading day of the year, but rebounded to 3.1%.
Yesterday afternoon, the 30-year yield still stood at about 3.06%.
As expected, the Fed held steady on the federal funds rate at 2.25% to 2.5%. That’s the overnight interest rate the Fed charges member banks to borrow for reserve requirement shortfalls. The Fed tries to control long-term rates by manipulating the federal funds rate.
In its statement, the Fed said that: “In light of economic and financial developments, and muted inflation pressures, the Committee will be patient as it determines what future adjustments to the target range for the federal funds rate may be appropriate to support these outcomes.”
The Fed noted that economic activity is rising. Jobs are strong. Spending grew stronger. And investments increased moderately. Inflation remains near the 2% target.
In other words, everything is just peachy!
The stock market received its late holiday gift from the Fed yesterday since it implied that future rate hike will be on a “wait and see” basis. The case for raising rates has weakened, even though a couple more hikes this year are still on the table.
The market was hoping for clarification about future balance sheet normalization.
Fed Chair Jerome Powell noted that the balance sheet will continue to be reduced, as per the current plan. But it will be larger than initial estimates. The Committee will finalize the end of balance sheet reductions at future meetings and is prepared to adjust normalization. That’s just what the market was looking for.
Treasury bonds have recently moved based on stock price fluctuations and global yield trends. They’ve lacked important economic data that has been delayed because of the government impasse. The Census Bureau will be releasing updated data starting this week for November, though they have yet to say when Decembers’ economic releases will be out.
What wasn’t being funded during the shutdown were the Bureau of Economic Analysis (BEA), and the U.S. Census Bureau, among other agencies. These two agencies provide research for a variety of public and private organizations, one being the U.S. Federal Reserve.
Even though the above agencies didn’t update over a month’s worth of data in two days to provide the Federal Reserve with the information it needed to make its decision, the Fed did still meet and didn’t hike rates. This time, anyway…
About Those Houses…
I was wondering how the Federal Open Market Committee (FOMC) could vote or even discuss policy with a lack of updated new home sales data, retail sales figures, and durable goods orders from the Census Bureau.
Or talk about gross domestic product (GDP) updates. Or how the Fed will review its preferred inflation gauge – the personal consumption expenditure index (PCE Index). And not to mention how they’ll review personal income and spending figures, all of which come from the BEA…
Remember… the Fed is data dependent in its policy decisions and will be in the future, according to Fed Chair Jerome Powell.
There were a couple economic releases not affected by the shutdown last week.
One being December existing home sales. Existing home sales is a much larger number, but they don’t give the economy the boost from associated sales of appliances, furniture, and the like as new home sales do. Still… it’s a good indicator of where overall home sales are headed.
Sales were down 6.4% on the month and fell below 5 million units annualized. On the year, sales fell 10.3%. The median sales price fell to $253,600, or down 1.4%.
What should have helped…
Mortgage rates fell in December. That should have helped sales. But it didn’t.
Of course, the shutdown delayed closings for those getting FHA mortgages and other government guaranteed loans.
U.S. pending home sales, out yesterday morning, fell 2.2% on the month and to the lowest level in five years. Sales were expected to rebound 0.5%.
Look for housing to get worse before it gets better. Even though new home sales figures have been delayed for two months, I expect it’s followed the existing home sales trend lower.
Don’t worry though, the Fed has your back! Mr. Powell assured us on a couple of occasions yesterday, that all the Fed cares about is using its policy tools correctly on behalf of the American people.
That’s reassuring…
Lance

January 30, 2019
How QE Perverted Our Economy
Thanks to those who answered my question on Monday about the tax cuts. I’ll share some of those answers below, but first I’ve got to get something off my chest.
When showing people my Spending Wave chart, I now must do so in two phases: the first with the market correlation to the 46-year lag for peak spending before the idiotic, insidious, irresponsible QE phenomenon took flight, and the second one after.
This is the second phase with the markets highlighted in yellow after QE (aka “Quickest Egress from reality)…

Look what those damned central bankers did to my beautiful chart!!
And worse, what they’ve done to our economy and free-market system!
The Spending Wave was my first breakthrough indicator in 1988 and, until March 2009, it was the best tool for projecting the economy and stock markets.
It is that fundamental.
It’s based on people driving our economy, not B.S. politicians who are rewarded for giving free lunches today and kicking the can down the road.
The markets are now just over double what they should be by my most fundamental indicator.
And this final bubble has occurred in the worst recovery in history on all counts: real GDP, wage growth, productivity and capital spending.
What central banks figured out is how to leverage earnings and stock prices (and all financial assets): Set short-term interest rates to zero and then create trillions ($12 trillion since 2009 thus far) to buy your own bonds and push even long-term, risk-free borrowing rates down to zero adjusted for inflation…
FREE MONEY!
Something for nothing on steroids!
And then, the Donald adds major corporate tax cuts when major businesses are enjoying the highest profits in history as a percent of GDP… and when they have more capacity than they need.
That’s how they created this unprecedented stock bubble out of a financial crisis and a weak recovery…
 The biggest single driver of stock prices is growth of earnings per share, and these central bank schmucks figured how to goose that.
So, here’s the summary:
GDP (not adjusted for inflation) grew a measly 44% since 2009.
Profits grew an astounding 175% (thanks to ultra-low borrowing and interest costs).
Earnings per share (EPS) grew an even more staggering astounding 384% (119% more than profits because companies used cheap money and free tax cut cash flow to buy back their own stock and restrict the shares to lever up).
Stocks grew a little less than EPS, at a mind-blowing 338%.
If this bubble continues another year, which looks likely with my Dark Window scenario, stocks will likely catch up with earnings and we could see the Dow go as high as 33,000.
This is B.S.
It’s like magic: now you see it, now you don’t. We see the miraculous effects of QE now. In the blink of an eye, it’ll all be gone.
Before signing off for today, I just want to share some of the feedback you sent to my tax cuts question on Monday…
Tax Cuts: Good, Bad, Ugly?
John B. told me that my view of the tax cuts is just plain wrong. He said: “Small and medium-sized businesses, where 35% tax is a headwind to investment and growth, needed those tax cuts. The FAANGS didn’t need them, but the little guys were stimulated to invest in growth of assets, marketing, and people.”
And another John B. (seriously, not the same person), also commented about the impact of tax cuts on small business: “For many small businesses like mine, the impact of the tax cuts isn’t felt until our taxes get done in April. I think capital spending decisions come later for many of us small businesses. However, I made the largest purchase of equipment in the last 10 years in 2018 because of the tax cuts and a general optimism under a pro-business administration.”
Thanks for that point of view, guys. However, I still believe Trump’s tax cuts were a free lunch for business that mostly didn’t need them, and it has only goosed the stock market bubble even further beyond reality. Even though some businesses like yours did do the right thing and invest in growth, the macro statistics clearly show that most didn’t.
There were a couple of other questions posed, and I plan to address some of those on Monday, so stay tuned. And let the questions and comments roll in. Send them to economyandmarkets@dentresearch.com.
Harry
Follow me on Twitter @harrydentjr

January 29, 2019
[Video] This Could Be the End of Tesla
I’ve said for years that Tesla, the electric car company, had its share of problems.
Most recently I wrote about them here, here, and here.
They’ve been selling “cool.” That may have worked for a little while, but now Tesla’s murky future, in my view, has reached entirely new depths.
I’ve been saying competitors would eventually catch up to their ideas, and execute them in better way. And now it’s happening.
Porsche, you know them, has recently put an electric car on the market, the Taycan, that blows anything Elon Musk has out of the water.
I want one myself, and it seems so do a lot of other people.
And this demand really could mark the end of Tesla.
Here’s why:

Rodney
P.S. Have a question or comment for me that you want to see answered or addressed. Email us at economyandmarkets@dentresearch.com.

January 28, 2019
Most Expensive Home Ever Sold in U.S.
What do you think of these apples?
More than a year ago I suggested that the most expensive new listing on South Central Park – Billionaire’s Row – was going to be listed at $250 million.
At the time, that seemed outrageous. I mean, compared to the new outrageous record sales in that area of just over $100 million, it was like people had lost their minds.
Well, this just happened…
Ken Griffin, the Texas billionaire who’s worth around $10 billion, just bought those two combined penthouse apartments at 220 South Central Park for a whopping $238 million!
He didn’t get much bargaining power over that $250 million asking price.
That works out to nearly $10,000 a sq. ft!
This is a case of people having more money than sense!
Here’s a photo, but note that Ken’s new purchase isn’t the tallest building (it’s the top of number 8)…
 The thing is, it’s all about location and view.
At 953 feet up, Ken’s new penthouse is high enough to get spectacular views; even better than those visible from 1,396 feet 432 Park (number 1). Incidentally, J-Rod and J-Lo just sold a penthouse at 432 Park.
Ken’s new neighbors include boring hedge fund managers and exciting rock stars like Sting.
They call this Billionaire’s Row for a reason.
Only people boasting 10 figure bank accounts or more can afford these prices, which range from $8,000 to $10,000 per sq. ft. The most expensive condo ever sold cost near $14,000 a sq. ft.! The most expensive house was bought by Barry Rosenstein in the Hamptons for a cool $137 million.
Ken Griffin also just bought a London home for $122 million. So, he’s ponied up $360 million in the last year.
The most expensive condo sold in the world was of course in Hong Kong the most overvalued city, which went for $361 million…
So, who’s the dumbest money in real estate?
I’ll tell you. It’s the richest people in the world. They don’t think real estate will ever go down, especially not in places like Manhattan, London, Singapore, Sydney, or Hong Kong.
Like I said: more money than sense!
History prove these uber-rich people dead wrong!
Manhattan real estate crashed 61% in the great Depression. That’s the most of any major cities in the U.S. And it took 25 years to get back to break even.
During that same period, everyday households only lost 26% of their real estate value and were back to break even in seven years.
These uber-rich people don’t realize that they’re the ones that lose the most when a major bubble like this one crashes. It stands to reason. They own the most financial assets that deleverage the fastest, including these stupid-ass-overvalued condos!
$238 million for a 24,000 sq. ft. box in the air compared to a massive ranch house and hundreds of acres in Georgia or Montana for a few million?
With levels of stupidity this high, these people deserve to lose a ton when the wheels come off!
High-end real estate is already slowing and coming down in Manhattan and many other super-over-priced cities.
This is the last gasp for billionaires that can’t find anywhere else to park their super-bubble profits. It’s the last desperate attempt of the stupid-rich in emerging countries, from China to Russia to the Middle East, to launder their money out of their corrupt and non-democratic countries.
I think Ken could see the value of his $238 million condo drop to as low as $50 million to $90 million several years from now…
Poor little rich boy.
Incidentally, the dumb money in stocks right now are corporations using near-free money to buy back their own stocks at record valuations. (I talked about this in my email to Boom & Bust subscribers this morning… showed them how useless Trump’s tax cuts turned out to be.)
At the heads of these corporations are those same uber-rich people who are throwing good money into the real estate inferno. They’re the new dumb money in a QE-overstimulated world of “markets on crack.”
Congratulations, you lucky douchebags!
Harry
Follow me on Twitter @harrydentjr
P.S. What do you think of this real estate recklessness? Come to think of it, what’s the most you’ve spent on a house (or condo)? And did the 2007 housing crash impact you in any way? Write to me. Let’s talk about this. You can reach me at economyandmarkets@dentresearch.com.


