
Harry S. Dent Jr.'s Blog, page 36
December 13, 2018
7 Signs Will Confirm the End Is Near for the Market
The bull market run since March 2009, when unprecedented money printing became the economic driver du jour, recently become the longest in history without a 20%-plus correction.
Past stock bubbles have lasted five years; six years max.
This one is now 9.8 years old –off the charts.
We have the unprecedented major tax cut and repatriation program near the top of a boom to thank for that, never mind that corporate profits as a percent of GDP are at record levels…
Now, volatility is rife. Markets are having a terrible December.
Is this the beginning of the end?
I don’t think so because we’ve not yet seen these seven signs, especially at this stage, the first one…
Sign #1…
If a leading U.S. index like the Nasdaq or Dow and/or S&P 500 corrects more than 30% from the top in three months or less, that is a SIGN it’s already over!
Then you wait for the first big bounce and get out (typically about a 50% retracement of the sharp fall).
Out of seven major stock bubbles in the last century, the average first crash has been severe, averaging a 42% loss in the first 2.6 months.
But, even though markets have seen a lot of red since early October, we’ve not yet reached even close to that 30% minimum mark over two months in. The late January 2018 peak looked more like a classic blow-off top, but this rule told me by April that it was not a top.
Of course, if that changes dramatically by year end with a break below 2,500 on the S&P 500 and a much sharper crash to follow, it’s possibly the strongest sign that this epic bubble is finally done for. A decisive break below 2,300 would be curtains. But, if things continue as they are currently with only minor new lows just ahead, we’ll look for…
Sign #2…
U.S. stocks make substantial new highs in 2019, but with strong divergences between foreign and smaller cap U.S. sectors.
The U.S. was the only major market making new highs in late 2018, before the recent correction. Not Europe, not Japan (even in its bear market rally since 2009), not China, not emerging markets…
And the recent correction has been stronger in the small caps like the Russell 2000 and the NYSE, which allows for greater chances of these indices not making new highs. The bank stocks are down 27% from their January peak, another candidate for a divergence in 2019.
If the Nasdaq, Dow, and S&P 500 make major new highs and most or all of these other indices do not: That’s a major and a very classic SIGN.
Better if that happens well into 2019 rather than just a slight new high between now and February.
Sign #3…
Homebuilding stocks led the last top in October 2007 by 26 months as housing and the subprime crisis lead the recession and Global Financial Crisis. That’s happening again, more due to overvaluation this time than bad lending like last time.
By the time the Dow peaked on October 7, 2007, the Dow Homebuilding Index was already down 65%. It’s already been down 37% recently.
If the homebuilding index continues to decline while stocks continue to bubble, that’s a SIGN, and a newer one most analysts won’t see.
Sign #4…
In a bubble, each wave tends to progress or get steeper.
If we look at this bubble back to March 2009, the last wave up from February 2016 is much steeper than the longer first wave up from March 2009 into May 2015.
The final wave, from December 2018 or so forward should be steeper still than its previous sub-wave from June 2017 to late September 2018.
I would expect the market to be moving up 900 to 1,000 points a month in this final rally, rather than 600 points a month as it did in the last one. That means we could see markets 7,000 to 11,000 points higher than they are now by late 2019.
That would be a SIGN, especially after the rally moves into early September or later in 2019, when the crash season strikes… and our most powerful 90-year Bubble Buster Cycle hits most strongly around late 2019. The most likely window for a top would be early September 2019 to early January 2020.
And especially if the Dow approaches or breaks above 30,000.
A Dow 33,000 to 35,000 is likely the extreme end of the potential range in such a blow-off top, and that would be an “all hands off-deck” SIGN.
Sign #5…
30-year Treasury yields started to spike up, breaking above a key level of 3.22% in September 2018. That pattern projected a potential spike up to 4.3% or so. But they’ve have pulled back below that level, bringing that spike into question.
However, the U.S. government still needs to issue about $1.2 trillion in Treasury bonds in 2019 to finance its enlarged deficit from the tax cuts and it still plans to sell $50 billion a month of its bond stock from QE stimulus. That could put strong upward pressure on yields.
If 30-year T-bond yields do start spiking towards 4% again, that would be a SIGN we’re about to suffer a massive market reset as such yields work against both stock and real estate valuations.
They would have to first break above 3.5% for that to be a scenario in play.
Sign #6…
Bitcoin bubbled more than any investment in history, going from around $1,135 to near $19,600 in just 8.5 months in 2017. Then it crashed a bloody 83% as of early December.
But it bubbled up similarly, just at lower levels, into late 2013 and then crashed 87%.
It could go down as low as $2,500 (87% again) and still a have a final wave up in its “hype” cycle before crashing back to $2,500 or lower and then following a more normal, longer-term bull market in blockchain technologies into around 2036 – 2037 on about a 20-year lag to the internet bull market after it similarly crashed into 2001 after a hype phase into early 2000.
If Bitcoin breaks back up sharply, along with a stock rally into 2019, and starts to hit new highs, like $21,500-plus, that’s a big SIGN the end is nearing fast. It’s major peak in December 2017 came just over a month ahead of the stock peak in January. Hence, a sharp crash after making a new high would be the ultimate sell signal for stocks.
This should happen by late 2019, or early 2020 at the very latest if Bitcoin accelerates rapidly again and first breaks back above $8,500 to show this is possible.
Like the extreme internet bubble from late 1998 into early 2000, the Bitcoin bubble should be the last and most extreme.
And last (but certainly not least)…
Sign #7…
The U.S. dollar started to break up above 97 and since has moved more sideways. A rising dollar hurts U.S. exports and more so kills emerging countries that have been borrowing largely in dollars for making paying loans back more expensive.
It’s these same emerging countries that have been leading the downturn this year and look most unlikely to make new highs and create divergences as I mentioned in SIGN #2.
If the U.S. dollar can break convincingly above 98 and starts to rally strongly, that would be a SIGN, especially if it approaches 120.
If all or most of these seven signs make an appearance, we know this bubble is near over!

Harry
Follow me on Twitter @harrydentjr

The post 7 Signs Will Confirm the End Is Near for the Market appeared first on Economy and Markets.


December 12, 2018
Are We at the Peak of Employment and Wages?
Talk about volatility!
The unemployment rate stayed at 3.7%, but the expected 190,000 non-farm jobs missed the bar by 35,000, only managing 155,000.
To add to that misery, October jobs were revised lower by 14,000 jobs.
Wage growth also missed the mark by rising only 0.2% rather than the expected 0.3%. On the year, wages rose 3.1%.
It wasn’t a horrible employment report. But job creation is slowing, and wages aren’t moving as much as expected.
This won’t take December’s expected rate hike off the table.
Remember, the jobs report is a lagging indicator. When we see a reversal or a rise in unemployment rate and falling wages, it’ll be too late for the Fed to react.
And talk about a reaction!
After the report, the Dow Jones Industrial fell by over 550 points, over 2%. The S&P 500 was also down over 2%, and the NASDAQ dropped over 3%. Overreactions like this are our bread and butter in Treasury Profit Accelerator.
A Quick Recap of Last Week
Last week started off with a bang as the markets were encouraged by a temporary truce in the Trade War with China. Stocks bounced sharply higher to the news.
But it was short lived…
The markets soured because President Trump conceded the trade deal might fall through. Stocks fell more than 3% and yields fell sharply as money flowed into the safety of Treasury bonds.
With the markets closed last Wednesday in honor of the late President George H.W. Bush, the Federal Reserve Chair Jerome Powell’s scheduled testimony before Congress was cancelled.
And on Thursday, the markets opened sharply lower, continuing the fall.
The founder and CFO of Huawei Technologies, a Chinese company, was arrested when Trump was meant to meet with China’s leader at the G20 summit. That’ll throw a wrench in any possible trade deal with China!
The Dow Jones Industrial stock index was down by as much as 800 points before reversing on a Wall Street Journal report that the Fed is considering a pause in rate hikes next year.
The Journal didn’t cite any sources, but if the Fed is considering a pause in hiking rates 2019, I’m sure we’ll get more clarity in a couple weeks after its policy meeting.
A Flattening Yield Curve…
I talked about my concern with the Treasury yield curve in last Wednesday’s Economy & Markets. Let’s look at how flat the yield curve has become in just a month:

Notice how the yield curve was pretty flat a month ago.
In other words, investors are getting paid the same yield to hold the investment for two years or seven.
The closely watched difference of the two-year to 10-year was only 11 basis points. If we see that go to zero or invert, we’ll likely be in a recession.
Bond investors are telling us that the outlook for the future of our economy is grim. When the yield curve flattens and when it inverts, something’s gotta give…
So, despite what the Fed does in December and into next year, the market isn’t seeing multiple rate hikes.
What it does see is trouble.
And we’ll be ready to take advantage of all the overreactions. Will you be?

The post Are We at the Peak of Employment and Wages? appeared first on Economy and Markets.
December 11, 2018
Beware the Naked Companies
The markets peaked in early October, and since then something remarkable has happened. Investors have lost their drive to buy-the-dips!
Instead, we’ve transitioned to sell-the-pops, and that’s not a good sign.
For decades, investors typically drive stocks higher after a week of losses, treating such pullbacks as a chance to buy good companies at a discount.
In the years when that wasn’t the case the markets fell into bear territory, which makes sense. If investors aren’t willing to buy as stocks sink, then by definition equities will fall further.
This is interesting because the economy is humming along just fine. Unemployment remains historically low, interest rates are low and it looks like the Fed will hold off after December, and GDP, while not great, appears to be on track for 2% to 3% growth. We’re sort of back to the muddle-through economy that we’ve had since the Financial Crisis.
But that misses one big point…
Since the downturn in 2008 and 2009, the equity markets are up 250% to 300%, while the economy has expanded by just 50% in total.
The difference in growth rates meant that, at some point, something had to give.
Either GDP was going to rocket higher, justifying such lofty valuations, or stock prices were going to fall. Well, GDP isn’t at risk of shooting to the moon, so it looks like we’re in the midst of pullback.
Whether we’re on the cusp of simple correction or headed for a full-on bear market remains to be seen, but one thing seems obvious. The psychology has changed. We’re no longer pouncing on falling stocks like vultures. We watch stocks fall and then, nothing. We let them fall again. It’s as if we’ve had our fill and simply lost our appetite for risk.
As we look forward to 2019, I have a word of advice…
Avoid naked companies
I’m not talking about firms with no clothes, or those in questionable industries. I’m referring to those lofty, pie-in-the-sky estimate companies that are devoid of earnings but command nose-bleed valuations.
As we look to 2019, several of these firms are making plans to go public, which could turn out disastrous for everyone involved.
Tops on the list are Uber and Lyft, the ride-hailing companies that operate illegally in most areas. These firms look like transportation companies, they operate like transportation companies, and they connect travelers with drivers willing to transport them for a fee like transportation companies. But to avoid all that sticky red tape, regulation, and taxes, these firms claim to be mere software firms.
Right.
They’ve ramped up ridership by offering services at less than what it costs to get people from here to there, which is fabulous for booking rides, but it’s a sucky way to reward investors. While still private, these companies have commanded huge valuations, with Uber valued at $120 billion in its last financing round.
But things might be changing…
Recently I read an article about Uber’s push to go public next year. On the opposite page was a story about scooter companies hemorrhaging cash because people vandalize and steal their equipment, and the average use of a rented scooter doesn’t pay for the unit before it wears out anyway.
These two things – Uber and scooters – are connected. Uber knows it doesn’t make money off of its cab, er, software offering, but it points to other services that could actually generate cash, such as freight logistics, food delivery, and, you guessed it, scooter rentals.
We might also see WeWork, the co-working space that appeals to Millennials, go public next year. The company doesn’t issue financial statements, but its valued in the billions and uses debt to sign long-term leases on office space around the country and then fills the space with very short-term agreements to small companies or even single entrepreneurs.
If the economy cools even a little, such an approach might leave WeWork with a lot of empty offices and yet huge lease obligations. But that’s OK, it has beer on tap, so what could go wrong?
Maybe I’m wrong
It could be that the markets turn around and shoot higher when we resolve our trade differences with China, or when President Trump and the Democrats reach across the aisle to move infrastructure financing through Congress.
Maybe we regain our animal spirits and surge ahead.
But maybe not.
And if we start 2019 on a whimper instead of a bang, don’t rush to buy shares in naked companies when they hit the markets. You could find yourself losing your shirt.

Rodney

The post Beware the Naked Companies appeared first on Economy and Markets.
December 10, 2018
Why Has Global Life Expectancy Exploded?
This is incredible!
Life expectancy at birth was around age 23 at the time of Christ.
It stayed between 23 and 26 until 1700.
Then it gradually increased to age 31 by 1900!
Since then, it has literally exploded!
Check out this amazing chart!
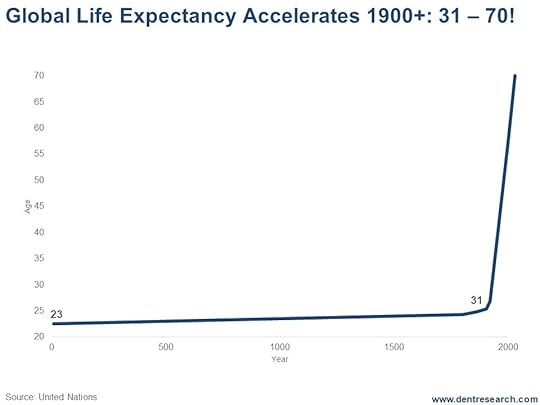
That’s no error!
Life expectancy has more than doubled in the last century. In the U.S. and developed countries, it went from 47 to 80.
Hell yeah, baby!
But what the hell could have caused this?
In two words: technology and urbanization.
Various scientists and engineers contributed to the creation of the combustion engine in the late 1700s. The first real combustion engine came to life (and patent) around the mid-1880s. By 1900, the first commercial car was sold. Trucks, buses, and tractors followed quickly.
Do you know how much tractors revolutionized farming?
In the late 1800s, growing our food was done 80% by people. Now it takes only 1.5% for that and major exports to boot!
Oh, and electricity and light bulbs were just emerging along with phones during that period.
Urbanization started to accelerate in Europe in the late 1800s and sped up globally from 1920 forward, when the world was just 12% urban.
Today, the world is 55% urban.
I project it will be 90% urban by 2120. And global income per capita will go up another four times.
1896 was the low in inflation rates for hundreds of years… and the start of a long term, 500-year inflation and mega-innovation cycle that doesn’t peak until about 2145…
This is why I look at cycles longer than your or my lifespan.
The truth is we are in the first mass production revolution in history and on a worldwide tear for urbanization.
In recent decades jet travel, personal computers, and the internet have emerged to unite the world in communication.
The truth is that more progress has been made in the last 120 years than in all of history put together.
And our life expectancies reflect that.
People who think the world is going to hell in a hand basket are blind!
That’s what a new book called Factfulness is saying. And I absolutely agree.
You should get the book for your kids. It’ll keep them off opioids.
The bigger truth is that our lives today are a result of a convergence of technologies that actually sprung out of the Scientific Revolution of the 1700s and free market capitalism and democracy in the late 1700s. That’s a 250-Year Revolution Cycle.
But it was the emergence of the 500-year cycle that brought the greatest explosion in technologies and standard of living in history since 1900.
Increasing lifespans was a byproduct of our wages increasing eight times (adjusted for inflation) since 1900.
But increasing lifespans also feed positively into the explosion by allowing us to be in the workforce much longer and earn and contribute more over a lifetime. That has been a part of the “demographic dividend of the last century that our research has so well documented.
Imagine what happens when the next surge comes in our kids and grandkids lifetimes… and people live to be 100 or 120…
Maybe they’ll have two sets of two kids.
That will solve the seemingly inevitable demographic black hole of affluent urban societies naturally having fewer children, which the 500-year cycle would strongly forecast.
Possibly even more important, they could learn on the first set of kids and produce perfect kids on the second go!
I wish I could live long enough to see that.
Harry
Follow me on Twitter @harrydentjr
P.S. We’re sharing Adam’s secrets to Seven Figure Trading. Here’s another one: The simple ETF strategy that’s made 175%, 407%, 212%, 112%, 136%, and 337% in the last two years. Learn it now for the chance to catch the next two years of simple profits, all while the markets continue down my Scenario #1 path into late 2019.

The post Why Has Global Life Expectancy Exploded? appeared first on Economy and Markets.
December 8, 2018
Are We Living the End of Days?
Did you hear that Chinese scientist He Jiankui claims to have created the first genetically modified humans by editing their DNA before birth?
If not, here’s a CNN video about him (it’s 2 minutes and 52 seconds long, so a quick watch).
He’s made two girls immune to HIV!
Of course, this has created an uproar in the scientific community, and in society at large. Should we be playing God?
But, what if?
If I could choose to have my daughters born immune to HIV, cancer, heart disease, or any other horrible ailment… if I had the choice to make them immune to the flu and measles, polio or chickenpox… would I do it?
Yes!
Should I do it?
Well, that’s the debate, right?
But if I could help my girls live longer, healthier lives, while I might ponder all the implications, I’d still do it.
What about you?
Would you use such technology? Ethical and theoretical considerations aside, if it came to the crunch, would you say no to using the technology at hand to improve your child’s life? Write to me at economyandmarkets@dentresearch.com and let me know.
All of this reminded me of two things…
First, the Book of Revelations and it’s verses on the Mark of the Beast and the End of Days. I remember reading that when I was younger and being terrified out of my mind.
And second, Harry’s cycles. He follows a technology cycle that is currently in its plateau phase. In the next few years, it kicks back into high gear, leading us to the next round of life-changing, world-changing technology that could see us living doubly-long lives and operating in very different work environments.
He talks about this in Zero Hour, which I hope you’ve read.
We’re seeing glimpses now of the technology that will shape our future. It’s fascinating.
So, here’s a second question for you today:
What’s the one change you hope the future brings?
Write to me at economyandmarkets@dentresearch.com. Then come back here to review what you may have missed this week from Harry, Rodney, and Lance…
The Emerging Countries that Flunk the Acid Test
By Harry Dent
Understanding money velocity is critical to seeing beneath the shiny surface of any economy. And right now, it’s painting a grim picture for countries across the board. But there are two emerging countries that are in real trouble…
Who Would You Kill?
By Rodney Johnson
Imagine you’re a trolley conductor and there’s a split in the tracks ahead. A bad guy has tied three people to the main track and five people to the bypass. The trolley’s breaks fail. Which direction do you take? You must choose one, since no choice still results in death…
I Disagree with Fed Chair Jerome Powell
By Lance Gaitan
Everyone wants to know what the Fed plans to do with its future rate hikes. They made some assumptions after listening to Powell a few weeks ago. But I disagree with him and I’ve got some different clues about future hikes…
Trump’s Growth Dream and the Harsh Reality
By Harry Dent
I’ll say it again: 4% growth is unsustainable. There are two demographic factors preventing it…
Want a Free Home? Japan Can Help
By Harry Dent
Japan is literally giving away homes! Why? What’s going on there? And why the hell should you care?…
That wraps us up for this week. Just two more weeks until Christmas, and three until year end. I look forward to hearing from me.
Teresa
P.S. Last week Rodney asked the question, “Who would you kill?” He struck a nerve. Next Saturday I’ll share some of the emails he got. Stay tuned. (If you missed that article, you’ll find the link above, or you can simply click here.)

The post Are We Living the End of Days? appeared first on Economy and Markets.
December 7, 2018
Want a Free Home? Japan Can Help
Man!
Sometimes I sound like a broken record.
If only more people listened to me, things like Japan’s latest stunt wouldn’t come as such a surprise.
And because you DO listen to me, imagine how smart you sound now. I imagine you smiling when a friend pipes up between sips of wine: “How’d you know Japan was in such trouble? You knew months ago!”
What is Japan doing?
They’re literally giving houses away.
Unsurprisingly!
They have 54 million total homes. Eight million of them are empty!
That’s 15%!
Fifteen!
This is just more confirmation that Japan is dying, and I warned this would happen more than two decades ago.
Listen to today’s video to hear how I was able to make this forecast so long ago, why Japan is a dead man walking, and why you should care…

But guess who tops Japan on the empty-homes point…?
It’s a place where 50 million homes are empty. Where 27% of urban homes are hooked up to electricity, but empty!
Listen to find out.
Harry
Follow me on Twitter @harrydentjr

The post Want a Free Home? Japan Can Help appeared first on Economy and Markets.
December 6, 2018
Trump’s Growth Dream and the Harsh Reality
Ever since Trump’s election and he and Treasury Secretary Steven Mnuchin uttered the stupidest words ever, I’ve been explaining in every place I can why 4%-plus growth is NOT sustainable… not past the tax-cut gravy train that hit mostly this year.
Ultimately, it mostly comes down to two predictable demographic factors…
As I’ve ALWAYS said, the most important driver of our economy isn’t the president or the Fed or anything other than people!
It all boils down to what people predictably like to spend their money on as they age!
Those two demographic factors making sustainable 4% growth nothing more than Trump’s wet dream are…
Workforce growth is slightly negative and overall flat for the coming decade and growing at 0.2% max for decades ahead, and…
Productivity has fallen from 3% in 2000 to 0.5% currently and will fall to zero or slightly negative as Baby Boomers continue to age.
That’s what largely drives GDP growth: demographic growth plus productivity gains.
Growth between 0.0% and 0.5% would be the reality and 1% a year would be a stretch at this point without never-ending free money and tax cuts.
And I don’t expect this year’s higher growth rates to last!
We’ve still averaged closer to 2% real GDP growth since 2009, despite the most massive monetary and fiscal stimulus in history.
Even Obama had some 4% quarters. They didn’t last either.
But here’s the final blow…
The average worker peaked in spending (and likely in income) in 2007, exactly as we forecast from the hard facts we found in the annual Consumer Expenditure Survey from The Bureau of Labor. That was simply a 46-year lag on the birth index adjusted for immigration.
Now I’ve come across good data from PayScale on how much the upper crust – full-time college graduates – earn. These people obviously earn more and peak in their spending much later.
PayScale also breaks the data out by gender. That turns out to be quite important…
Look at this chart.

Women peak at $62,100 at age 55/56 and have a long plateau between age 43 at $61,600 and 57 at $62,000. Then their wages fall off substantially into retirement.
Men continue to climb into a much higher peak of $94,800 at age 56, with a plateau between $94,500 at age 53 and $94,700 at age 57.
That’s 53% higher for men than women at their peak!
Then they drop off more dramatically after 57.
Hence, age 57 is the real effective pay peak before falling for this full-time elite college group.
Why Is This Important?
A 57-year lag for peak spending of college grads would have 2018 as the last year of strong earning and spending before this most affluent group begins their decline… 11 years after Homer Simpson did into 2007.
The top 20% in this country account for almost all the wealth and 50% of the spending…
Now that they’re about to sharply slow their spending, the Donald’s not going to see the curve ball coming any more than Bush and the Fed saw the slowdown in 2008!
The slowdown between age 57 and 58 – just one year – is 2% in earnings.
At 50% of spending and 70% of GDP, that would knock GDP down 0.7% in 2019. Just this one factor.
Note that if we average men and women, the peak for these college grads is age 56 at $78,450, holding up at $78,350 at 57 before dropping off.
But the peak for a dual income full-time college couple would be a whopping $156,900. That’s about 2.3 times that for an average household.
PayScale also settles another big issue: gender inequality in pay.
Yes, women earn only 77.9% of what men do for full-time work on average…
BUT…
Most of that difference comes from the jobs women tend to naturally choose.
When comparing income in the same occupations, women earn 97.8% of what men earn – just 2.2% lower.
Men focus more on hard sciences and jobs like software developers and engineers. No wonder Silicon Valley is such a male-dominated culture!
Women focus more on jobs like teachers, nurses, and social workers – they like helping people.
Regardless, women accelerate as fast up the career chain – if not faster – than men do up until age 29. Then they start having kids. We estimate the women in more affluent households have the average kid when they’re about 30 years old. For the average household, that age is 28 for the average one.
The pay gap for ages 20 to 29 is 81.8%. It falls to 76.7% for 30 to 44, and 69.5% for 45-plus.
Women are five times more likely to take leave for childrearing than men and the average leave of one year knocks 7.3% off income when they’re re-hired or return to the work force.
They simply lose momentum in the race for success.
I recall a survey many years ago that showed that in law firms, women who didn’t have kids did just as well as the men.
The gap is a bit different by major industries…
The largest for same occupation is in oil and gas drilling – an obviously macho industry – at 7.4% lower for women.
For transportation and warehousing (think truckers) it is 4.9%. I’d hate to see it for lumber jacks.
For technology, it’s only 0.8%.
And for education, it’s the lowest at 0.6%.
All of which is to say that the promise of sustainable 4% growth is now even less deliverable than it ever was… and it didn’t have a chance in hell to begin with.
That’s why it always pays to know the real facts. Unfortunately, economists and our politicians DON’T! But if YOU do, then you’ll be many steps ahead.
Harry
Follow me on Twitter @harrydentjr
P.S. Another way to stay ahead is by reading the 27 simple stock secrets that our Seven-Figure Trader says are worth $588,221. You’ll find the details here.

The post Trump’s Growth Dream and the Harsh Reality appeared first on Economy and Markets.
December 5, 2018
Disagreeing the Fed Chair Jerome Powell
Everybody wants to know what the Fed plans to do with its future rate hikes…
Today I’ll give you some clues.
The Fed’s monetary policy is based on two things:
There congressional mandate to provide for maximum employment.
And ensure stable prices.
So, just a few weeks ago, Fed Chair Jerome Powell threw some comments out there that I don’t necessarily agree with.
Listen to the video I’ve recorded for you to explain.

The problem is, the markets reacted upwards almost immediately after Powell’s comments… and the bond market didn’t.
This is a critical point to note… and I explain why.

Lance
P.S. Inflation rates, rate increases, Fed actions, political drama… as long as there’s an overreaction, there’s a way to profit, and I’d like to show you how. I’ve got these initial few details to show you how that’s possible, so take a few moments to read them.

The post Disagreeing the Fed Chair Jerome Powell appeared first on Economy and Markets.
December 4, 2018
Who Should Your Autonomous Car Kill?
I don’t want to be President of the United States.
I wouldn’t want to subject my family, or myself for that matter, to the intense scrutiny required of elections.
I wouldn’t want to deal with what looks like political ego mania on Capitol Hill.
But, most of all, I wouldn’t want the awful responsibility of sending our sons and daughters to their deaths in war.
Such a sacrifice is often required to keep our political balance, but is it worth it?
But what if that responsibility didn’t rest with the president?
What if choosing life and death with the same certainty – you know the loss of life will happen, just not when and to whom – fell to ordinary people?
That’s what’s coming.
I’m thinking about autonomous cars when I say that.
As we move closer to seeing them on the street, we’ll have choices to make, and some of them will be about who lives and who dies.
The New Trolley Problem
For decades, at least, philosophers have struggled with the “trolley problem.”
You’re a trolley conductor and there’s a split in the tracks ahead. A bad guy has tied three people to the main track and five people to the bypass.
The brakes on the trolley fail.
Which direction do you take?
You must choose one, since no choice still results in death.
We wrestled with this question in one of my college philosophy classes. The argument starts with the premise that life is priceless. That sounds good, but it’s not true.
A life has a value, which is another life.
Once we deal in multiples, we make choices that seem obvious. Kill fewer people, right? That makes sense. But the choices don’t stop there.
Software engineers working on the commands that control autonomous cars must work through similar questions.
If an obstacle blocks the path of the vehicle, should the vehicle slam into the obstacle and kill the occupants?
Should it hit oncoming traffic, potentially killing occupants in more than one vehicle, or launch onto the sidewalk and hit pedestrians?
Does the composition of car passengers or the types of pedestrians make a difference?
And Who Gets To Decide?
Do we go with the recommendations of philosophy professors in ivory towers?
A group at MIT had a different idea.
Instead of working through the moral implications and arriving at a conclusion, they created a survey and posted it online. It’s called the moral machine. You can take the survey at www.moralmachine.mit.edu.
Participants flip through 13 or 14 scenarios that show different people in the path and alternate path of a vehicle, as well as different occupants in the vehicle. You must choose whom the car hits or, in some instances, if the car rams into a stationary barrier and kills the occupants.
I have no idea how many people the survey creators expected to go through the survey, but the thing went viral. More than 40 million people around the world have weighed in.
The results are… interesting.
Who Would We Kill?
Some of the outcomes make sense.
Compared with killing the average male, participants widely favored sparing a woman with a stroller. Not that we could tell in a split second, but participants also chose to kill a thief more often than any other person, and chose to spare a male doctor slightly more often than saving a female doctor. That’s odd because we chose to spare girls more than boys, and chose pregnant women more than any other individual adult.
Confounding philosophy professors, the survey showed that people favor saving dogs over thieves. But in a blow to animal lovers in general, cats were at the bottom of the list, sacrificed to save, well, everybody and everything else.
Some of the survey is entertaining, in a morbid sort of way. But that’s because we’re looking at little icons on a screen, and we’ve been conditioned by modern life to treat figures on a screen as nothing more than pixels.
What happens when, not if, but when, this becomes real? When an autonomous car “chooses” to hit a pedestrian instead of harming the occupants of the vehicle or entering oncoming traffic?
It might be the correct thing to do in light of the choices, but will the family of the pedestrian take comfort in the logic? More importantly to the future of autonomous driving, will they agree not to sue the software and car manufacturers for making a pre-determined choice?
Accidents happen every day, with people causing mortal harm to others. But they didn’t make the choice ahead of time, which is key.
As we get closer to driverless cars becoming a reality, the trolley problem will become a bigger issue. As with being president, I don’t want the job of writing that software, or running those companies.
Which begs the question. Who would you kill?
Let me know at economyandmarkets@dentresearch.com.
Rodney

The post Who Should Your Autonomous Car Kill? appeared first on Economy and Markets.
December 3, 2018
The Emerging Country that Flunks the “Acid Test”
Several weeks ago I sent you a video commentary on how important money velocity is and why Dr. Lacy Hunt is the master of this concept, which I now call the “acid test” for developed and emerging country economies.
The point you should take away from that video is that money velocity is falling almost everywhere. When that happens, it’s a clear sign of speculation in investment and the inflation of debt and financial asset bubbles.
This scenario NEVER ends well.
In that video, I described how the U.S. was the best house among the leading developed countries like Europe and Japan, despite our falling money velocity since 1997. I talked about China being the lowest!
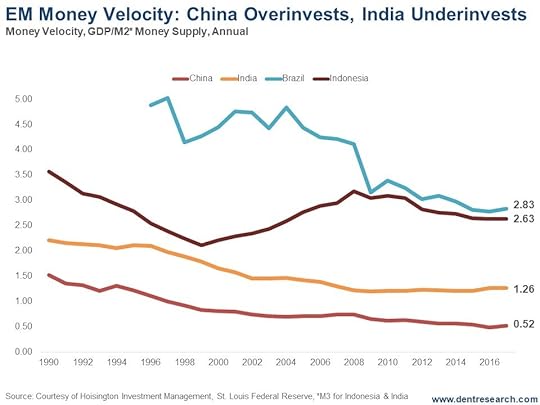
Here’s a chart showing the money velocity of the four largest emerging country economies: China, India, Brazil, and Indonesia.
Look at Indonesia.
The Rising or Falling Emerging Country
It’s the only emerging country with rising velocity into 2008, reaching to 2.90. It’s since fallen modestly to 2.63, which is still healthy and higher than the best developed countries! Indonesia is at 55% urban and has decades of growth to come. It’s workforce growth trends don’t peak until around 2055.
Brazil’s money velocity peaked the highest at 5.0 in 1997. It was still as high as 4.75 in 2004. That’s when Brazil was at its best, moving into peak urbanization. It went from 82% urban in 1995 to 86% urban in 2010 and has made little progress since.
The South American country has fallen to 2.83, at which point it is still the highest of this group. It also still has modest growth in workforce trends into 2035, before slowing longer term.
The emerging country with the lowest urbanization, at 34%, and greatest demographic growth potential is India.
It doesn’t peak in workforce until 2050-55.
It should see its urbanization accelerate when China fails and makes way for India to become the next “big thing.”
But, India’s money velocity peaked in 1996 at a modest 2.10 and has fallen down to 1.26! That’s lower than the U.S., although higher than Europe.
The Problem Here Is Simple…
India has underinvested in infrastructures and capital goods like plant and equipment.
That underinvestment makes the return on all investments lower because everything, from travel to communication to logistics to electricity access, is harder in India. I know this for a fact because I’ve been there three times, spending longer than two months there.
Thankfully, things are changing there, and fast! And that’s a great sign given its un-ending urbanization and demographic potential.
But, like I said on Friday, China is the worst “money velocity offender” by far.
It peaked in 1990 at an already dismal 1.50 and is at a pathetic – even coma state – of 0.52 currently.
How does the fastest-growth, major emerging country in the world and second largest economy flunk the “acid test?”
By Cheating!
By endlessly building “stuff for nobody” – empty condos, malls, and offices everywhere. 22% of homes are empty by a comprehensive new study.
The cardinal sin in business is overbuilding because it creates high debt and fixed-cost burdens that sink your profits and ultimately drown you.
This is why I see China taking a decade to work off its excesses.
This is why I see China enduring the worst crash of the leading countries ahead.
INDIA is where the future money is. And next, countries like Indonesia in Southeast Asia.
NOT China… at least for a good while.
I’d bet money on it.
Harry
Follow me on Twitter @harrydentjr

The post The Emerging Country that Flunks the “Acid Test” appeared first on Economy and Markets.


