
Michael Roberts's Blog, page 9
November 9, 2024
US election 2024: inflation, immigration and identity
As the FT put it: “In the end, it wasn’t even close. A presidential election long forecast to dance on a knife’s edge very quickly turned out to be a rout for Donald Trump.”
Trump polled 73.4m votes or 50.7% of the those who voted, while Harris polled 60m or 47.7% of the vote. Third party candidates mustered just 1.6%. Trump’s 4.3m lead was more than Biden had in 2020, or Hillary Clinton had over Trump in 2016.
Trump’s vote did not rest on small margins in a handful of swing states, as was the case when he won in 2016. Instead, he gained support across the electoral map in states both red (Republican) and blue (Democrat). Even in his birthplace of New York state, one of the bluest strongholds in the country, Trump winnowed a 23-point gap down to 11.
The biggest caveat to Trump’s voting victory is that contrary to the usual hype of a ‘massive voter turnout’, fewer Americans eligible to vote bothered to do so compared to 2020. Then over 158m voted, this time the vote was down to 143m. The voter turnout of those eligible fell to 58.2% from the high of 65.9% in 2020.
Around 40% of Americans registered to vote did not do so. And the number of Americans who failed to register rose to 19m from 12m in 2020. So, although Trump got 51% of those who voted, he actually got only 28% support of Americans of voting age. Three out of four Americans did not vote for Trump. The real winner of the election was (yet again) the ‘no vote’ party. Indeed, Trump polled fewer votes in 2024 than he did in 2020. But Harris lost around 11m votes compared to Biden in 2020.
In my analysis of the 2020 election, I concluded that “Biden won because America’s ethnic minorities overcame the white majority. Biden won because younger Americans voted for Biden sufficiently to overcome Trump majorities among older voters. Biden won because working class Americans voted for him in sufficient numbers to overcome the votes of the small town business-people and rural areas.”
This time none of those things happened. This time, the vote majorities that Biden got in 2020 among ethnic minority voters, women, young people, city dwellers and college graduates weakened sharply for Harris, while Trump’s support among white males (and females) without college degrees rose by more than enough. Indeed, in just about every demographic group, Trump gained from 2020.

The majority of America’s working class did not vote for Trump. For a start, a large percentage did not vote at all and non-voters would mainly be those with lower incomes and education qualifications or unemployed.
According to exit polling in ten key states, Harris took 53% of the vote from voters with a household income of $30,000 or less (the poorest income earners) while Trump took 45%. While Harris had a majority among those earning more than $95,000 dollars a year (the college-educated ‘better off’), the vote was more or less split with those earning $50-95k.
As for the organised working class, Harris took 54% of the vote of trade unionists, while Trump still took 44% – but trade union membership is now quite small in the electorate. Young people made up 16% of the electorate but many did not vote. Of those young people who did vote, Trump got a majority among men (58%-38%) and Harris got it among young women.
But here is the rub. The Harris campaign was based primarily on what is called ‘identity politics’. She called for support from black voters against Trump’s open racism. She called for support among Hispanic voters against Trump’s attacks on immigrants; she called for support from women against Trump’s reduction of abortion rights. And she got majorities with these groups – but much less than in 2020. Harris lost support among women, her majority falling from 57 per cent in 2020 to 54 per cent. These majorities were overcome by the increased majority of male voters supporting Trump in this election.
Harris lost the election heavily because the Democrats campaigned on the identity issues that concerned voters much less, while Trump campaigned on what mattered most to Americans in 2024: inflation, the cost of living and what is perceived as uncontrolled immigration.

Three out of four Americans who said that inflation caused them and their family severe hardship in the last year voted for Trump. And as I have argued in previous posts, the perception that average American households have suffered a loss in living standards in the last four years is no myth, contrary to the views of mainstream economists.

Between 2020-2023, real pretax income growth for the bottom 50% of income earners in the US was basically zero. Prices of goods and services are up over 20% since the end of the pandemic and for basic foodstuffs it is even higher. Moreover, the huge hike in interest rates by the Federal Reserve to ‘control’ inflation drove up mortgage rates, insurance premiums, car lease payment and credit card bills.
Inflation and the drop in living standards for many Americans was blamed by sufficient numbers of voters on the Biden-Harris administration. As in many other countries, incumbent governments that presided over the post-pandemic period have been ousted. Indeed, it is the first time since the beginning of universal suffrage that all the incumbent parties in developed countries have lost vote share. The Democrats are the latest – Germany next.

In 2020, Trump was the incumbent and was blamed for his disastrous handling of the COVID pandemic. But in 2024, the Biden-Harris administration has been blamed for the failure to deal with inflation and for not stopping immigration. Many Americans saw ‘uncontrolled immigration’ as causing a loss of jobs and rising crime – against all the evidence. Nevertheless, this irrational fear had traction, especially in small towns and rural areas where there are few immigrants visible.
Biden and Harris crowed about a vibrant, healthy, low unemployment US economy, better than anywhere else. Sufficient American voters were not convinced of this message coming from the so-called ‘liberal elite’, given their own experience. They reckoned they were losing out because of high prices and costs, precarious jobs and uncontolled immigration that threatened their livelihoods, while the rich and educated in Wall Street and in mega hi-tech companies made billions.
Of course, Trump won’t change any of that – on the contrary, his pals and financial backers are a bunch of rogue billionaires who look to gain yet more riches from cuts in taxes and deregulation of their activities.
But elections are just a snapshot of public opinion at one moment – nothing stands still.


November 6, 2024
US election result: first thoughts
Former president Republican Donald Trump is heading for a convincing victory in the US presidential election. The Republicans have won control of the Senate and control of the House of Representatives – a clean sweep.
It also looks like Trump will also poll more overall votes than the Democrat candidate Harris (he polled fewer votes than Hillary Clinton when he won the presidency in 2016).
Why has Trump won? A first thought. Nearly every incumbent government in office during the pandemic slump and post-inflationary period has been ousted from power.
According to the AP Votecast survey, four in 10 voters named the economy and jobs as the most important problem facing the country.
One quote sums up why sufficient numbers of voters switched from Democrat to Republican. “I’ve been a Democrat my whole life and I haven’t see any benefits from that. Democrats have been sending funds to wars and resources to migrants rather than to Americans who are struggling. I trust Trump to put us first.”
The trouble is that Trump will put billionaires, corporations and fossil fuel companies first.
I’ll comment on the psephology of the election figures when all the details are available.
November 4, 2024
US election part two: Trump v Harris
There’s just one day to go before the US presidential election vote and in this second part of my posts on the US economy, I shall look at the economic policies of the two main candidates.
In one sense, who wins matters little to big finance and big business. Both candidates are dedicated to the capitalist system and making it work better for the owners of capital. Larry Fink of BlackRock, the world’s largest asset manager, said he is “tired of hearing this is the biggest election in your lifetime”. The reality, says Fink, “is over time it doesn’t matter”. And it’s true that the underlying endogenous forces of capitalist production, investment and profit are much more powerful than any particular policy adopted and implemented by a government. Nevertheless, pro-capitalist politicians can differ on what is best for capitalism at any one time. And there are some differences between Trump and Harris on what to do over the next four years.
The main planks of what Trump calls “Maganomics” include more aggressive tariffs on imports from around the world, especially from China, and a draconian crackdown on immigration. His campaign rhetoric also pushes for greater political influence over monetary policy and the Fed on interest rate decisions and in the manipulation of the dollar.
Trump claims that he will “deliver low taxes, low regulations, low energy costs, low interest rates and low inflation, so that everyone can afford groceries, a car and a beautiful home.” His new tax cuts range from income from overtime pay, tips and pension benefits to massive across-the-board cuts for individuals and corporations. This will undoubtedly reduce taxes for the very rich (yet again) but increase it for nearly every body else.


Trump claims that these tax cuts for the very rich and the big corporations will boost investment and growth, based on the discredited ‘trickle-down’ theory ie if incomes and wealth for the rich rise, then they will spend more and so the benefits will ‘trickle down’ to the rest of us.

But the evidence is to the contrary. The last 50 years have seen a dramatic decline in taxes on the rich across the advanced democracies. And several studies show that this has little or no effect on economic growth – and much more effect on increasing inequality. Two economists from Kings College London, using a newly constructed indicator of taxes on the rich to identify all instances of major tax reductions on the rich in 18 Organisation for Economic Co-operation and Development (OECD) countries between 1965 and 2015, find that tax cuts for the rich lead to higher income inequality in both the short- and medium-term, but do not have any significant effect on economic growth or unemployment.
Per capita gross domestic product and unemployment rates were nearly identical after five years in countries that slashed taxes on the rich and in those that didn’t, the study found. But the analysis discovered one major change: the incomes of the rich grew much faster in countries where tax rates were lowered. Surprise! This may be obvious from our own experience of the last few decades, but empirical analysis confirms our own perceptions.
As for Trump’s last period of office, when he introduced sharp cuts in corporate and personal income tax, Emmanuel Saez and Gabriel Zucman of the University of California at Berkeley found that for the first time in a century, the 400 richest American families has lower effective tax rates than people in the bottom 50% of income earners.

Bond investors and Wall Street are worried that these tax cuts, while very welcome, could only increase the huge government budget deficit and public sector debt – something that is anathema to the financial sector. Trump’s answer is that he will ‘pay for’ the tax cuts by dramatically increasing the tariffs on imports. Trump plans to impose a 10 per cent levy on all US imports and a 60 per cent tax on goods coming from China. Indeed, Trump is talking of imposing tariffs sufficiently high to allow him to end income tax altogether!
But the Penn Wharton Budget Model, a research group, has estimated that Trump’s plans would raise US budget deficits by $5.8tn over the next decade. Even the conservative Tax Foundation think-tank estimated that his new plan to exempt overtime work from federal levies would cost the US a further $227bn in lost revenue over the next decade.
Again, empirical analysis of these policies indicate significant damage to US economic performance. A recent study suggests that Trump’s policies are “sharply regressive tax policy changes, shifting tax burdens away from the well-off and towards lower-income members of society”. The paper, by Kim Clausing and Mary Lovely, puts the cost of existing levies plus Trump’s tariff plans for his second term at 1.8 per cent of GDP. It warns that this estimate “does not consider further damage from America’s trading partners retaliating and other side effects such as lost competitiveness.” This calculation “implies that the costs from Trump’s proposed new tariffs will be nearly five times those caused by the Trump tariff shocks through late 2019, generating additional costs to consumers from this channel alone of about $500bn per year,” the paper said. The average hit to a middle-income household would be $1,700 a year. The poorest 50 per cent of households, who tend to spend a bigger proportion of their earnings, will see their disposable income dented by an average of 3.5 per cent.

Trump’s tariff measures would see levies on imports supercharged to levels last seen during the 1930s following the passing of the landmark protectionist Smoot Hawley Tariff Act. Trump claims the trade barriers will not only raise revenues, but lead to the restoration of US manufacturing. When import tariffs are used to protect a burgeoning and fledgling manufacturing sector as they were in the US back in the late 19th and early 20th century, they may have helped. But now in the 21st century, US manufacturing is in relative decline, a trend that won’t be reversed by protectionist policies – that horse has bolted to Asia.
Instead, the Peterson Institute for International Economics think-tank in Washington calculates that 20 per cent across-the-board tariffs combined with a 60 per cent tariff on China would trigger a rise of up to $2,600 a year in what the average household spends on goods as inflation rose accordingly. PIIE senior fellows Obstfeld and Kimberly Clausing think that the maximum amount of additional revenue the administration can raise — by applying a 50 per cent tariff on everything — would be $780bn. “If we wanted to completely replace the [revenue raised from] income tax with a tariff, we would need at least a two-thirds tariff. And then you have to remember that people are going to start substituting away from imports and then there’s going to be retaliation and so on,” says Tedeschi of the Yale Budget Lab. “It’s impossible to make the math work. You probably can’t raise [tariffs] high enough.”
The other main plank of Maganomics is to cut back drastically on immigration. Trump has accused immigrants of “poisoning the blood of our country.” Despite this grotesque racism, many Americans are convinced that their living standards and life are being affected by ‘too many immigrants’. According to Gallup, 2024 is the first year in nearly two decades that a majority of the public wants less immigration to the US. In the past year alone, the desire to reduce the amount of immigration has jumped by 10 points for Democrats and 15 points for Republicans.
Trump actually calls fo the mass deportation of millions of immigrants. A recent report by the American Immigration Council finds that should the government deport a population of roughly 13 million people who as of 2022 lacked permanent legal status and faced the possibility of removal, the cost would be huge, around $305bn.
And this does not take into account the long-term costs of a sustained mass deportation operation or the incalculable additional costs necessary to acquire the institutional capacity to remove over 13 million people in a short period of time. “To put the scale of detaining over 13 million undocumented immigrants into context, the entire U.S. prison and jail population in 2022, comprising every person held in local, county, state, and federal prisons and jails, was 1.9 million people.” If spread out over years, the cost would average out to $88 billion annually, for a total cost of $968 billion over the course of more than a decade, given the long-term costs of establishing and maintaining detention facilities and temporary camps and immigration courts. Moreover, about 5.1 million US-citizen children live with an undocumented family member. Separating family members would lead to tremendous emotional stress and could also cause economic hardship for many of these mixed-status families who might lose their breadwinners.
But the overall economic damage would also be significant. As I have argued in the previous post, net immigration has helped the US economy to grow at a faster rate than other G7 economies. Losing these workers through mass deportation would reduce US GDP by 4.2 to 6.8 percent. It would also result in significant reduction in tax revenues. Removing immigrant labour would disrupt all sectors, from homes to businesses to basic infrastructure. As industries suffer, hundreds of thousands of US-born workers could lose their jobs.
Trump’s Maganomics claims it aims to help the average US-born American but in reality, of course, his policies would only enrich the very rich like himself at the expense of the rest, and also jeopardise economic growth and hike inflation. He is heavily backed by individual multi-billionaires, like Elon Musk. They own about 4% of US personal wealth, but have contributed one-third of the campaign money raised by Trump, a billionaire himself. The irony is that 74% of Americans asked would support an annual 2% wealth tax on personal assets over $50 million; 65% support raising the corporate income tax rate and 61% support raising top income tax rates – the exact opposite of Trump’s policies.
But big business and the mega banks need not worry, because Democrat candidate Kamala Harris has no intention of introducing a wealth tax, or raising corporate taxes or taxes on the top income earners. On the contrary, Biden maintained the tax cuts that Trump introduced in his 2016-2020 term that will last to 2025, and Harris will not change that. Harris’ economic policy agenda is largely in line with Biden’s economic platform, with some tweaks to emphasize causes that are more important to her, like child tax credit. She wants to restore the Child Tax Credit which would give families with newborn children a $6,000 (£4,630) tax cut.
But she firmly opposes a single-payer health insurance scheme that would end the horrendous cost of premiums that Americans must pay to insurance companies. She says she wants to erase billions of dollars in medical debt for Americans. But this debt pile is precisely due to the unaffordable health costs of the US’ highly expensive and low outcomes private health system.
Harris also accedes to the anti-immigration sentiment. She would support a new bill to continue the construction of more border walls with Mexico costing billions, a policy that when Trump proposed it in his previous successful campaign was opposed by the Democrats.
As for the climate, Trump has made it clear that he will relax regulations and allow further fossil fuel exploration and production – after all he and Tesla boss Elon Musk are agreed that global warming is probably not man-made and anyway is not a serious risk to livelihoods and lives – tell that to the hurricane victims in Florida.
Harris is not much better. Whereas she was opposed to the extremely environmentally damaging method of extracting oil and gas by fracking back in 2019, now she backs new fracking leases to ensure ‘energy security’ after the energy-led price explosion following the COVID pandemic. “My position is that we have got to invest in diverse sources of energy so we reduce our reliance on foreign oil,” she said.
Harris will maintain the tariffs and sanctions on Chinese imports and products that Trump and then Biden introduced. You won’t be able to find a thin enough piece of paper to push between Trump and Harris’ policies towards strangling China’s exports and technology advancement, as well as surrounding China with military bases and forces.
The Democrats’ chances of winning tomorrow have been seriously damaged by the inflation explosion of 2022-23 with average prices up 20%-plus – see part one of this post. Harris has talked of a federal ban on grocery price gouging – something again that seems like closing the door after the horse has bolted.
The other damaging factor for the Democrats has been housing and the record level of mortgage rates. Harris proposes various subsidies for first-time buyers and the usual tax credits to developers to build homes – but no state construction, of course. Don’t expect these measures to end the national housing shortage.
As for public services, with the budget deficit set to rise and public debt reaching well over 100% of GDP, both candidates are saying nothing, but it can only mean fiscal austerity is on its way, big time. Tax revenues are not being increased – on the contrary. ‘Defence’ and arms spending to pay for the wars in Ukraine and the Middle East have reached record highs and will continue to rise. What will have to give is public spending on education, transport and social care etc. This will apply, whoever wins. So in that sense, Larry Fink is right. It does not matter who wins. The winner of all US “elections” is Wall Street.
November 2, 2024
The US presidential election: part one – the economy
I am doing two posts before the US presidential election on Tuesday. The first is on the state of the US economy; and the second will be on the respective economic policies of the two main candidates, Democrat Kamala Harris and former Republican President Donald Trump.
The US stock market is booming, the dollar is riding high in currency markets, the US economy is rolling along at about 2.5% real GDP growth, unemployment is no higher than 4.1%. It appears that the US economy is achieving what is called a ‘soft landing’ ie no recession as it comes out of the pandemic slump of 2020. Indeed, there appears to be no landing at all. Some call it the Benjamin Button economy: the US economy is only getting younger and better.
So why is the candidate of the incumbent Democrat administration, Kamala Harris only neck and neck in the polls with the Republican former president Donald Trump? Indeed, the betting world reckons that Trump will win. How can this be the case if the US economy is going so well?
It seems that a sufficient proportion of the electorate is not so convinced of a prosperous and better time for them. In the latest WSJ poll, 62% of respondents rated the economy as “not so good” or “poor,” which explains the lack of any political dividend for President Biden or Harris.
I would argue that the reason for this is two-fold. First, the US real GDP may be growing and financial asset prices booming, but it is a different story for the average American household, hardly any of whom own any financial assets to speculate with. Instead, while rich investors boost their wealth, under the Trump and Biden administrations Americans have experienced a horrendous pandemic followed by the biggest slump in living standards since the 1930s, driven by a very sharp rise in prices of consumer goods and services.

Average wage rises failed to keep pace until the last six months or so. And officially prices are still some 20% plus higher than before the pandemic but with many other items not covered by the official inflation index (insurance, mortgage rates etc) rocketing. So after tax and inflation is accounted for, average incomes are pretty much the same as when Biden came into office.

No wonder a recent survey found that 56% of Americans thought the US was in a recession and 72% thought inflation was rising. The world may be great for stock market investors, the ‘Magnificent Seven’ hi-tech social media companies and the billionaires, but it ain’t so for many Americans.
This disconnection between the optimistic boomer views of mainstream economists and the ‘subjective’ feelings of most Americans has been called a ‘vibecession’. American consumers sentiment is way down from when Biden came into office.

Americans are well aware of costs that the official indexes and mainstream economists ignore. Mortgage rates have reached their highest level in 20 years and home prices have risen to record levels. Motor and health insurance premiums have rocketed.
Indeed, inequality of incomes and wealth in the US, among the highest in the world, is only getting worse. The top 1% of Americans take 21% of all personal incomes, more than double the share of the bottom 50%! And the top 1% of Americans own 35% of all personal wealth, while 10% of Americans own 71%; yet the bottom 50% own just 10%!


Indeed, when you look more closely at the much heralded real GDP figures, you can see why there is little benefit going most Americans. The headline GDP rate is driven by healthcare services, which really measure the rising cost of health insurance, not better healthcare, and that cost has rocketed in the last three years. And then there are rising inventories which means stocks of goods unsold, in other words, output without sale. And then there is increased government spending, mainly for arms manufacturing, hardly a productive contribution.
If we look at economic activity in the US manufacturing sector, based on the so-called purchasing managers survey, the index shows that US manufacturing has been contracting for four consecutive months leading up to the November election (any score below 50 means contraction).

The administration and the mainstream proclaim the low US unemployment rate. But much of the net increase in jobs has been in part-time employment or into government services, both federal and state. Full-time employment in important productive sectors that pay better and offer a career has been lagging. If a worker has to take on a second job to maintain his or her standard of living, he or she might not feel so bullish about the economy. Indeed, second jobs have increased significantly.


And the labour market is starting to turn for the worse. The monthly net increase in jobs has been a downward trend, with the latest October figure just +12,000 (affected partly by hurricanes and the Boeing strike).

Both job offers and job quits rates have dropped to levels typically seen in recessions. Companies are hesitant to hire full-time workers, and employees are reluctant to quit due to job security concerns and an increasing dearth of available opportunities.


Mainstream economists make much of the undoubted better performance of the US economy compared to Europe and Japan, and compared to the rest of the top G7 capitalist economies as a whole. But an average real GDP growth rate of 2.5% is hardly such a success compared to the 1960s, or even the 1990s or before the Great Recession of 2008, or before the pandemic slump of 2020.
The major economies remain in what I have called a Long Depression, namely where after each slump or contraction (2008-9 and 2020), there follows a lower trajectory of real GDP growth – i.e. the previous trend is not restored. The trend growth rate before the global financial crash (GFC) and the Great Recession has not returned; and the growth trajectory dropped even further after the pandemic slump of 2020. Canada is still 9% below the pre-GFC trend; the Eurozone is 15% below; the UK 17% below and even the US is still 9% below.

Moreover, much of the US outperformance in economic growth is the result of a sharp increase in net immigration, twice as fast as in the Eurozone and three times as fast as in Japan. According to the Congressional Budget Office, the US labour force (not employment) will have grown by 5.2 million people by 2033, thanks mainly to net immigration and the economy is projected to grow by $7 trillion more over the next decade than it would have without new influx of immigrants.
So it is a great irony that the second reason why the Harris campaign is not way ahead of Trump is the question of immigration. It seems that many Americans regard curbing immigration as a key political issue – ie they blame low real income growth and poorly paid jobs on too many immigrants and yet the opposite is the case. Indeed, if immigration growth slacks off or if a new administration introduces severe curbs or even bans of immigration, US economic growth and living standards will suffer.
The only way the US economy could sustain even 2.5% a year in real GDP growth in the rest of this decade would be by achieving a very sharp increase in the productivity of the American labour force. But over the decades, US productivity growth has slowed. In the 1990s, average productivity growth was 2% a year and even faster at 2.6% a year during the ‘dot.com’ credit fuelled 2000s. But in the Long Depression years of the 2010s, the average rate slipped to its lowest at 1.4% a year. Since the Great Recession of 2008 right up to 2023, productivity has been rising at just 1.7% a year. If the size of the employed workforce were to stop rising because immigration had been curbed, then real GDP growth would slip back under 2% a year.

The mainstream hope that the huge subsidies pumped into the big hi-tech companies by the government will boost investment in productivity-boosting projects. In particular, the massive spending on AI will eventually deliver a sustained step-change rise in productivity growth. But that prospect remains uncertain and dubious – at least given the pace of the infusion of these new technologies across the US economy.
So far, productivity growth has been mainly in climate and environmentally damaging fossil fuel industry with little sign of infusion across other sectors.

Since 2010, oil and gas production in the US has almost doubled and yet employment in the upstream sector has declined. So the productivity gains in the sector have been achieved by falling employment.
There is a serious risk that a huge investment bubble is building up, funded by increased debt and government subsidies, that could come crashing down if returns on capital for the US corporate sector from AI and hi-tech do not materialise. The reality is that, apart from the profits boom of the so-called Magnificent Seven of hi-tech social media giants, the average profitability of the productive sectors of US capitalism is at all-time lows.

Yes, the mass of profits is very high for the Magnificent Seven and profit margins are high, but total profit growth of the US non-financial corporate sector has slowed almost to a stop.

And remember, it is now well established that profits lead investment and then employment in a capitalist economy. Where profits lead, investment and employment follow with a lag.

If investment growth falls, then the expected productivity growth will not materialise.
Moreover the overall profits data are biased in two ways. First, profits are heavily concentrated with the big mega companies, while the small and medium-size companies are struggling with the burden of high interest rates on their borrowing and squeezed costs on raw materials and labour.

Around 42% of US small-cap companies are unprofitable, the most since the 2020 pandemic when 53% of small caps were losing money.

Second, much of the rise in profits is fictitious (to use Marx’s term for profits made by buying and selling financial assets that supposedly represent real assets and earnings of companies but don’t). Using the method of Jos Watterton and Murray Smith, two Canadian Marxist economists, I estimate that fictitious profits are now around half the total profits made in the financial sector. If that were to disappear in a financial crash, it would seriously damage corporate America.

And that brings us to the issue of rising debt, both in the US corporate sector and in the public sector. If there were a bursting of the bubble over AI, many companies would be faced with a debt crisis. Already, more US companies have defaulted on their debt in 2024 than in any start to the year since the global financial crisis as inflationary pressures and high interest rates continue to weigh on the riskiest corporate borrowers, according to S&P Global Ratings.

And don’t forget the ‘zombies’ ie companies that are already failing to cover their debt servicing costs from profits and so cannot invest or expand but just carry on like the living dead. They have multiplied and survive so far by borrowing more – so are vulnerable to high borrowing rates.

If corporate defaults rise, then this will put renewed pressure on the creditors, namely the banks. There has already been a banking crisis last March that led to several small banks going under and the rest bailed out by over $100bn of emergency funding by government regulators. I have already highlighted the hidden danger of credit held by so-called ‘shadow banks’, non-banking institutions that have lent large amounts for speculative financial investments.
And it is not just the corporate sector that is coming under debt servicing pressure. Throughout the campaign for the US presidency over the last few months, there is one issue that both candidates, Kamala Harris and Donald Trump, have ignored. It’s the level of the public debt. But this debt matters.
The US government has spent $659billion so far this year paying off the interest on its debt, as the Federal Reserve’s rate hikes dramatically raised the federal government’s cost of borrowing. Public sector debt, currently estimated at $35trn, or around 100% of GDP, has only one way to go: and that’s up. The debt load is set to soar higher – potentially reaching $50trn within the next 10 years, according to a projection from the US Congressional Budget Office (CBO).
The CBO reports that federal debt held by the public (ie the ‘net debt’) averaged 48.3% of GDP for the last half century. But the CBO projects that by next year, 2025, net debt will be larger than annual economic output for the first time since the US military build-up in the second world war and will rise to 122.4% by 2034.

But does this rising public debt matter? The suggestion that the US government will eventually need to stop running budget deficits and curb rising debt has been strongly rejected by exponents of Modern Monetary Theory. MMT supporters argue that governments can and should run permanent budget deficits until full employment is reached. And there is no need to finance these annual deficits by issuing more government bonds because the government controls the unit of account, the dollar, which everybody must use. So the Federal Reserve can just ‘print’ dollars to fund the deficits as the Treasury requires. Full employment and growth will then follow.
I have discussed in detail the flaws in the MMT argument in other posts, but the key concern here is that government spending, however financed, may not achieve the necessary investment and employment increases. That’s because the government does not take the decision-making on investment and jobs out of the hands of the capitalist sector. The bulk of investment and employment remains under the control of capitalist firms, not the state. And as I have argued above, that means investment depends on the expected profitability of capital.
Let me repeat the words of Michael Pettis, a firm Keynesian economist: “the bottom line is this: if the government can spend additional funds in ways that make GDP grow faster than debt, politicians don’t have to worry about runaway inflation or the piling up of debt. But if this money isn’t used productively, the opposite is true.” That’s because “creating or borrowing money does not increase a country’s wealth unless doing so results directly or indirectly in an increase in productive investment…If US companies are reluctant to invest not because the cost of capital is high, but rather because expected profitability is low, they are unlikely to respond ….by investing more.”
Moreover, the US government is borrowing mostly to finance current consumption, not to invest. So just getting the Federal Reserve to ‘print’ the money required to cover planned government spending will only produce a sharp depreciation of the dollar and a rise in inflation.
Rising debt adds to the demand by bond buyers for higher interest rates to insure against default. For the US, that means each one percentage point increase in the debt-to-GDP ratio increases longer-run real interest rates by one to six basis points. The more the debt grows, the more the government has to shell out in interest to service that debt — and the less money the US government has to spend on other priorities like social security and other crucial parts of the social safety net. Interest costs have nearly doubled over the past three years, from $345 billion in 2020 to $659 billion in 2023. Interest is now the fourth-largest government program, behind only social security, medicare, and defense. Relative to the economy, net interest costs grew from 1.6 percent of GDP in 2020 to 2.5 percent in 2023.
In its latest baseline, the CBO projected that interest would cost more than $10 trillion over the next decade and exceed the defense budget by 2027. Since then, interest rates have risen far more than CBO projected. If interest rates remain about 1% point above previous projections, then interest on public debt would cost more than $13 trillion over the next decade, exceed the defense budget as early as next year, 2025, and become the second-largest government program, exceeding Medicare, by 2026.
America’s economic might does give it substantial leeway. The dollar’s role as the international reserve currency means demand for US debt is ever-present and AI-driven productivity growth could indeed help lessen its debt problems. But the size of the public sector debt cannot be ignored. The new administration will soon be applying higher taxes and cuts in government spending. If it does not, bond ‘vigilantes’ will cut back on purchases and force the new president into applying severe fiscal austerity anyway. As the IMF chief economist, Pierre-Olivier Gourinchas, said just before this election: “Something will have to give.” Bidenomics will pass away with its namesake.
October 30, 2024
UK budget: no game changer
The newly elected Labour government’s first budget has just been presented. Rachel Reeves, the UK finance minister (called Chancellor of the Exchequer in Britain) said her budget proposals would stabilise Britain’s public finances; stimulate economic growth, avoid damaging the living standards of ‘working people’; and begin to reverse the disastrous decline in Britain’s public services, including the national health service, education, transport and housing.
And Britain is certainly broken after more than a decade of the previous Conservative government in charge. But can this Labour government deliver any change?
Reeves admitted that UK productivity growth and investment is the lowest among the G7. Economic growth has been pitiful, with real GDP rising at under 2% a year for more than a decade. So can we expect a sharp rise in that growth rate over the next five years of a Labour government? Apparently not. According to Reeves, the UK economy will manage an average growth rate, at best, for the rest of this decade of 1.6% a year – so no better than before! As the Office for Budget Responsibility (OBR) put it in its budget review: “ taken together, the Budget policies leave the level of output broadly unchanged at the forecast horizon.”
Through the mist of the government claims, the OBR finds that business investment to GDP, the lowest in the G7 at about 10%, will be little changed by the end of this parliament and government investment will not be raised or even stimulate the private sector to invest either.

So the hope for rising productivity growth will be dashed. The OBR expects trend productivity growth (output per hour worked) to rise from zero to 1¼ per cent in 2029. “This is a significant rise from an average rate of ⅔ per cent in the decade following the financial crisis. But it is still well below the average of around 2¼ per cent in the decade preceding the financial crisis.”
All this means that the resources available to reverse the decline in living standards and public services are meagre at best and will not repair a ‘broken Britain’.
Reeves was keen to say that inflation was coming down and she was sticking to the 2% a year target for the Bank of England. And yet, the projections for inflation would not see that target met until 2029! Indeed, inflation is projected to rise in 2025. So the squeeze on real incomes would remain through this parliament. Indeed, the OBR forecasts that real household disposable income (RHDI) per person, a measure of living standards, will grow by an average of only ½ a per cent a year for the next five years – and that’s an average.

Given a low growth, low productivity economy, all Reeves can do is to try and raise taxes and government borrowing to fund more spending on public services. She has opted to do this by hiking social security contributions paid by employers for each worker they employ. This will supposedly bring in £25bn. Reeves is also raising taxes on capital gains that rich investors pay when they sell their financial assets. And very rich foreigners can no longer claim ‘non-dom’ status to avoid paying tax on overseas earnings if they live in the UK.
But there is no wealth tax on the very rich (which could easily raise £25bn a year); there is no increase in taxation of rapidly rising corporate profits (that stays at 25%) and tax exempt thresholds are not being raised with inflation until 2028, so most working people will pay more tax out of any increase in wages. There will be a “crackdown” on welfare benefit fraud to get £4bn year, but only a vague commitment to tackle widespread tax avoidance and evasion (which loses the government some £25bn a year).
The minimum wage will increase to £12.21. Reeves described the 6.7 per cent increase as a “significant step” towards creating a “genuine living wage for working people” – although it falls short of the £12.60 an hour sum recommended by the Living Wage Foundation.
She has also changed what she called the ‘fiscal rule’ on government borrowing. The Labour government is pledged to reduce the public sector debt, now standing at about 100% of GDP. Reeves is ‘remeasuring’ this ‘gross debt’ into ‘net debt’ ie after taking into account government assets like buildings and financial holdings. This will allow her to borrow an extra £50bn through the rest of this decade without increasing the debt level.

The government has decided to borrow more – up £40bn this financial year to fund extra spending on schools, the NHS and the public services. But extra spending on the NHS, housing, transport etc will also be accompanied with £3bn a year boost to the armed forces and a guarantee of paying £3bn a year to Ukraine ‘for as long as it takes’ to defeat Russia.
It remains to be seen if the City of London and the bond investors will accept this without selling off government bonds and driving up interest costs. So far, they seem happy. But the OBR reckons that bond yields will rise over the next few years staying above 4%, while the Bank of England rate will only fall from about 5% now to 4%. So mortgage and credit card rates will continue to squeeze living standards.

Thus the government has found some more money to spend on public services, at least compared to what the Conservatives planned – but actually only an increase of 1.5% a year. The general approach is unchanged. It’s up to the capitalist sector to invest and grow. As Sahil Jai Dutta put it: “Labour has shown little sign of changing the current model where critical infrastructure is provided by private firms. Many of these companies have shunned investment for the past three decades, while ramping up dividends, buybacks and executive pay. Rather than confront why, Labour’s priority seems to be sweetening investors and developers with more money available on better terms.” More subsidies for big business funded by more taxes and government borrowing.
This budget is no game changer for working people – or for that matter for British capitalism. As the OBR says: “the economic outlook depends on uncertain judgements on the paths for productivity, inactivity, and net migration. The fiscal forecast also remains highly sensitive to movements in interest rates and inflation given the level of debt.”
And all bets are off, if the world economy heads into a slump before the end of this decade.
October 25, 2024
Japan election: stagnation continues
Japan holds a parliamentary election on Sunday 27 October. The new leader of the governing Liberal Democrats and now prime minister Shigeru Ishiba has called the election in order to cement his government in office. Previous prime inisyer Fumio Kishida stood down after a corruption scandal involving ‘slush fund’ money for corporations to fund his party’s campaigns. Nothing new there as it has been standard practice for the LDP to seek secret funding from corporations in return, no doubt, for appropriate policies. The more recent scandal was the close connections between the outgoing Kishida and the so-called Unification Church of the rabid anti-Communist Christian cult of the now deceased Sun Myung Moon.
Opinion polls indicate that while the LDP retains popularity among older conservative voters, younger generations are increasingly disenchanted. Some ar elooking to the libertarian Nippon Ishin no Kai’s emphasis on political reform and anti-corruption initiatives.
The way the opinion polls are going, the ruling LDP may lose its outright majority in the lower house, meaning it would likely have to rely on its usual coalition partner, the Buddhist Komeito, to control the lower house of parliament. It already depends on Komeito for a majority in the upper house. Komeito has been less willing than the LDP to embrace policies including giving Japan’s military longer-range missiles and removing restrictions on weapons exports that have stopped Tokyo from sending arms to Ukraine or to Southeast Asian nations that oppose Beijing in the South China Sea.
Japan’s anti-China foreign policy in alliance with the US is one thing, but as usual it is the state of the economy that focuses most voters’ minds. For the first times in decades, inflation of consumers’s goods and services prices has been rising.

Real wages have been falling for two years. Amid rising prices, some opposition parties have argued for a reduction in or the abolition of the sales tax, but Ishiba has pushed back by saying it is an important source of revenue for social security.

Indeed, labour’s share of Japan’s national income has been falling substantially since the end of the Japanese boom period of the 1980s; from 60% to 55% now.
On some measures, Japan is not so unequal in personal wealth as the other major economies, – the World Inequality Database puts the gini coefficient of wealth inequality at 0.74 (the US is 0.83), and the gini index for inequality at 0.54 (the US at 0.63). But inequality is still significant, with inequality of incomes matching levels in Europe. The top 10% of income earners take a 44% share of personal incomes, while the top 1% have 13%. The bottom 50% of earners get only 17%. As usual, the wealth gap is even greater. The top 10% of wealth holders have 60% of all personal wealth in Japan, a figure unchanged in the 21st century. The top 1% own 25% of all wealth, while the bottom 50% have just 5%. Japan is owned, controlled and run by an elite just as in the other major economies.
And Japan continues to struggle with years of low economic growth; including during (much heralded by Keynesians) the so-called “Abenomics” under former Prime Minister Shinzo Abe, which sought to stimulate growth through monetary easing, fiscal deficits and neo-liberal structural ‘reforms’.

And former PM Kishida won the last election on a program that he claimed was going to revive the Japanese economy with what he called a “new capitalism”, supposedly a rejection of ‘neoliberalism’ as operated by previous PMs like Abe. Instead, he would reduce inequality, help small businesses over the large and ‘level up’ society. This would break with Abe’s emphasis on ‘structural reform’ ie reducing pensions, welfare spending and deregulating the economy.
But nothing changed. ‘New capitalism’ did not last long, it seems. Productivity growth remains low. Japanese capital’s image of innovating technology appears to be long gone. A mainstream measure of ‘innovation’ is called total factor productivity (TFP). TFP growth has faded from over 1% a year in the 1990s to near zero now, while the huge capital investment of the 1980s and 1990s is nowhere to be seen. Now Japan’s potential real GDP growth rate is close to zero.

.
Even though many Japanese corporates are supposedly “cash-rich”, they are not investing at home. This reflects low profitability in domestic productive sectors. So business investment growth is very weak. Japan’s corporations may have increased profits at the expense of wages and even managed to raise the profitability of capital a little, but they are not investing that capital in new technology and productivity-enhancing equipment. Real investment is no higher than in 2007.

Source: EWPT series 7.0
And as elsewhere in the major economies, Japan’s manufacturing sector is in recession (any score below 50 means contraction).

From Abe to Kishida to Ishiba, nothing changes; Japan’s capitalist economy continues to stagnate.
October 20, 2024
IMF and BRICS: no return to Bretton Woods
This week the IMF-World Bank semi-annual meeting takes place in Washington, US. At the same time, the BRICS+ group meets in Kazan, Russia. The coincidence of these two meetings sums up how the world economy is going in 2024.
After WW2, the IMF and the World Bank became the leading agencies for international cooperation and action on the world economy. They were institutions that sprang out of the Bretton Woods agreement of 1944, that set the future world economic order to be established at the end of WW2. At the time, the then US president Franklin Roosevelt offered these prophetic words: “The point in history at which we stand is full of promise and of danger. The world will either move toward unity and widely shared prosperity or it will move apart into necessarily competing economic blocs.”
Roosevelt was referring to the division between the US and its allies and the Soviet Union. That ‘cold war’ came to an end with the collapse of the latter in 1990. But now 35 years later, Roosevelt’s words have a new context: between the US and its allies and an emerging bloc of ‘Global South’ nations.
The world economic order agreed at Bretton Woods established the US as the hegemonic economic power in the world. In 1945, it was the largest manufacturing nation in the world, it had the most important financial sector, the most potent military forces – and it dominated world trade and investment through the international use of the dollar.
John Maynard Keynes was heavily involved in the Bretton Woods deal. He commented that his “foresighted idea for a new institution to more equitably balance the interests of creditor and debtor countries was rejected”. Keynes’ biographer, Robert Skidelsky summed up the outcome. “Naturally, the Americans got their way because of their economic power. Britain gave up its right to control the currencies of its former empire, whose economies now came under the control of the dollar, not sterling.” In return, “the Brits got credit to survive – but with interest charged. Keynes told the British parliament that the deal was not “an assertion of American power but a reasonable compromise between two great nations with the same goals; to restore a liberal world economy. “The other nations were ignored, of course.
The US and its allies in Europehave have dominated the IMF and the World Bank ever since, both in personnel and in policies. Despite some very minor reforms to its voting and decision-making over the past 80 years, the IMF continues to be run by the G7, giving almost no voice to other countries. There are a total of 24 seats on the IMF board, with the UK, US, France, Germany, Saudi Arabia, Japan and China each having individual seats – and the US having the power to veto any big decisions.
As for economic policy, the IMF is perhaps most notorious for the imposition of ‘Structural Adjustment Programmes’. IMF loans were ‘given’ to countries in economic distress on the condition that they agreed to balance their deficits, squeeze public spending, open their markets and privatise key sectors of the economy. The single most widely recommended IMF policy is still to cut or freeze public sector wage bills. And the IMF still refuses to call for progressive taxes on the income and wealth of the richest individuals and corporations. As of 2024, 54 countries are now in a debt crisis and many are spending more on servicing their debt than on financing education or health. Some of the worst cases have been highlighted on this blog.
The World Bank’s criteria for loans and aid to the poorest nations also remains within the mainstream economic view that public investment is made merely to encourage the private sector to take up the task of investment and development. The World Bank economists ignore the role of state investment and planning. Instead, the Bank wants to create “markets globally contestable, reduce factor and product market regulations, let go of unproductive firms, strengthen competition, deepen capital markets”.
Kristalina Georgieva has just been endorsed for a second term as IMF chief. And she now talks of ‘inclusive’ economic policies. She says she wants to increase ‘global collaboration and reduce economic inequality’. The IMF claims it now cares about the negative consequences of fiscal austerity, often citing how social spending should be protected from cuts through conditions that stipulate spending floors. Yet, an Oxfam analysis of seventeen recent IMF programs found that for every $1 the IMF encouraged these countries to spend on social protection, it told them to cut $4 through austerity measures. The analysis concluded that social spending floors were “deeply inadequate, inconsistent, opaque, and ultimately failing.”
Until recently, the IMF reckoned faster growth depended on higher productivity, free flows of capital, globalization of international trade and ‘liberalisation’ of markets, including labour markets (meaning weakening labour rights and unions). Inequality did not come into it. This was the neo-liberal formula for economic growth. But the experience of the Great Recession on 2008-9 and pandemic slump of 2020 seems to have delivered a sobering lesson to the IMF’s economic hierarchy. Now the world economy is suffering from “anemic growth”.

So the IMF is worried. Georgieva said the reason that the major economies are experiencing slowing and low real GDP growth is soaring inequality of wealth and income:“We have an obligation to correct what has been most seriously wrong over the last 100 years – the persistence of high economic inequality. IMF research shows that lower income inequality can be associated with higher and more durable growth.” Climate change, rising inequality and increased geopolitical ‘fragmentation’ also threaten the world economic order and the stability of the social fabric of capitalism. So something must be done.
During the Long Depression of the 2010s, globalisation has fragmented along geopolitical lines—around 3,000 trade-restricting measures were imposed in 2023, nearly three times the number in 2019. Georgieva is worried: “Geoeconomic fragmentation is deepening as countries shift trade and capital flows. Climate risks are increasing and already affecting economic performance, from agricultural productivity to the reliability of transportation and the availability and cost of insurance. These risks may hold back regions with the most demographic potential, such as sub-Saharan Africa.”
Meanwhile, higher interest rates and debt-servicing costs are straining government budgets—leaving less room for countries to provide essential services and invest in people and infrastructure.

So Georgieva wants a new approach for her new five-year term. The previous neoliberal model for growth and prosperity must be replaced with ‘inclusive growth’ that aims to reduce inequalities and not just boost real GDP. The key issues now should “inclusion, sustainability, and global governance, with a welcome emphasis on eradicating poverty and hunger.”
But can the IMF or the World Bank really change anything, even if Georgieva wants to, when the US and its allies control these institutions? IMF loan conditionalities have hardly altered. There’s some debt relief maybe (ie some restructuring of existing loans), but no cancellations of onerous debt. As for interest rates on these loans, the IMF actually imposes hidden extra penalty rates on very poor countries unable to meet their repayment obligations! After a growing outcry against these penalties, these rates have recently been reduced (not abolished), thus lowering costs for debtors by (only) $1.2bn annually.
Christine Lagarde, the head of the European Central bank (ECB), was the previous IMF chief. She made an important ‘keynote’ speech last spring to the US Council of Foreign Relations in New York. Lagarde talked nostalgically of the post-1990s period after the collapse of the Soviet Union, supposedly heralding a new prosperous period of global dominance by the US and its ‘alliance of the willing’. “In the time after the Cold War, the world benefited from a remarkably favourable geopolitical environment. Under the hegemonic leadership of the United States, rules-based international institutions flourished and global trade expanded. This led to a deepening of global value chains and, as China joined the world economy, a massive increase in the global labour supply.”
These were the days of the globalization wave of rising trade and capital flows; the domination of Bretton Woods institutions like the IMF and the World Bank dictating the terms of credit; and above all, the expectation that China would be brought under the imperialist bloc after it joined the World Trade Organisation (WTO) in 2001.
However, it did not work out as expected. The globalization wave came to an abrupt end after the Great Recession and China did not play ball in opening up its economy to the West’s multi-nationals. That forced the US to switch its policy on China from ‘engagement’ to ‘containment’ – and with increasing intensity in the last few years. And then came the renewed determination of the US and its European satellites to expand its control eastwards and so ensure that Russia fails in its attempt to exert control over its border countries and permanently weaken Russia as an opposition force to the imperialist bloc. This led to the Russian invasion of Ukraine.
This brings us to the rise of the BRICS bloc of countries. BRICS is the acronym for Brazil, Russia, India, China and South Africa, the original members. Now in Kazan, there will be the first meeting of BRICS-plus with its new members: Iran, Egypt, Ethiopia, the UAE (and maybe Saudi Arabia).
There is much optimistic talk among the left that the emergence of the BRICS grouping will change the balance of economic and political forces globally. It’s true that the five BRICS nations now have a combined GDP larger than that of the G7 in purchasing power parity terms (a measure of what GDP can buy domestically in goods and services). And if you add in the new members that makes the gap even larger.

But there are caveats. First, within the BRICS, it is China that provides the bulk of the BRICS GDP (accounting for 17.6 per cent of global GDP), followed by India at a distant second (7 per cent); while Russia (3.1 per cent), Brazil (2.4 per cent), and South Africa (0.6 per cent) together made up just 6.1 per cent of world GDP. So this is no equally shared economic power within the BRICS. And when we measure GDP per person, the BRICS are nowhere. Even using PPP-adjusted international dollars, the United States’ per-capita GDP amounts to $80,035, more than three times that of China, which amounts to $23,382.

The BRICS+ group will remain a much smaller and weaker economic force than the G7 imperialist bloc. Moreover, the BRICS are very diverse in population, GDP per head, geographically and in trade composition. And the ruling elites in these countries are often at loggerheads (China v India; Brazil v Russia, Iran v Saudi). Unlike the G7, which has increasingly homogenous economic objectives under the firm hegemonic control of the US, the BRICS group is disparate in wealth and income and without any unified economic objectives – except maybe to try and move away from the economic dominance of the US and in particular, the US dollar.
And even that objective is going to be difficult to achieve. As I have pointed out in previous posts, even though there has been a relative decline in US economic dominance globally and in the dollar, the latter remains the most important currency by far for trade, investment and national reserves. Approximately half of all global trade is invoiced in dollars and this share has hardly changed. The USD was involved in nearly 90% of global FX transactions, making it the single most traded currency in the FX market. Approximately half of all cross-border loans, international debt securities, and trade invoices are denominated in US dollars, while roughly 40 percent of SWIFT messages and 60 percent of global foreign exchange reserves are in dollars.

The Chinese yuan continues to make gradual gains and the renminbi’s share in global FX turnover has increased from less than 1% 20 years ago to more than 7% now. But the Chinese currency still only represents 3 percent of global FX reserves, up from 1 percent in 2017. And China doesn’t appear to have changed the dollar share of its reserves in the last ten years.
John Ross made similar points in his excellent analysis of ‘de-dollarisation’. “In short countries/companies/institutions engaging in de-dollarisation either suffer, or run the risk of suffering, significant costs and risks. In contrast, there are no equivalent immediate upside gains from abandoning the dollar. Therefore, the great majority of countries/companies/institutions will not de-dollarize unless forced to. The dollar, therefore, cannot be replaced as the international currency unit without an entire change in the global international situation for which the objective international conditions do not yet exist.”
Moreover, multilateral institutions that could be an alternative to the existing IMF and World Bank (controlled by the imperialist economies) are still tiny and weak. For example, there is the BRICS’ New Development Bank set up in 2015 in Shanghai. The NDB is headed up by Brazil’s former leftist President Dilma. There is much noise that the NDB can provide an opposite pole of credit to the imperialist institutions of the IMF and World Bank. But there is a long way to go in doing that. One ex-official of South African Reserve Bank (SARB) commented: “the idea that Brics initiatives, of which the most prominent thus far has been the NDB, will supplant Western-dominated multilateral financial institutions is a pipe dream”.
And as Patrick Bond put it recently: “The “talk left, walk right” of BRICS’ role in global finance is seen not only in its vigorous financial support for the International Monetary Fund during the 2010s, but more recently in the decision by the BRICS New Development Bank – supposedly an alternative to the World Bank – to declare a freeze on its Russian portfolio in early March, since otherwise it would not have retained its Western credit rating of AA+. ” And Russia is a 20% equity holder in NDB.
The BRICS is a motley group of nations with governments that have no internationalist perspective, certainly not one based on working-class internationalism, led as many are by autocratic regimes where working people have little or no say; or by governments still tied heavily to the interests of the imperialist bloc.
Let’s go back to Bretton Woods and Roosevelt’s prophecy. Many modern Keynesians hold up the Bretton Woods agreement as one of the great successes of Keynesian policy in delivering the sort of global cooperation that the world economy needs to get out of its current depression. What is needed, you see, is for all the world’s major economies to get together to work out a new agreement on trade and currencies with rules to ensure that all countries work for the global good. Two Keynesians from the Democrat party in the US recently reckoned that “a different kind of worldview has never been clearer. This is revealed by a look at any of the problems of our age, from climate to inequality to social exclusion… Designing a new global economic framework requires a global-scale conversation.”
Indeed, but is it really possible in a world controlled by an imperialist bloc led by an increasingly protectionist and militarist regime (with Trump on the horizon) that it can be resisted by a loose amalgam of governments which are often exploiting and suppressing their own people? In such a situation, hopes for a new coordinated world order in global money, trade and finance is ruled out. A new and fair ‘Bretton Woods’ is not going to happen in the 21st century – on the contrary.
Back to Lagarde: “the single most important factor influencing international currency usage is the “strength of fundamentals.” In other words, on the one hand, the trend of weakening economies in the imperialist bloc facing very slow growth and slumps during the rest of his decade; and on the other, continued expansion of China and even India. This means that the heavy military and financial dominance of the US and its allies stands on the chicken legs of relatively poor productivity, investment and profitability. That’s a recipe for global fragmentation and conflict.
October 15, 2024
Why nations succeed or fail: a Nobel cause
Daron Acemoglu, Simon Johnson and James A Robinson have been awarded the Nobel (really the Riksbank prize) in economics “for studies of how institutions are formed and affect prosperity.” Daron Acemoglu is a professor at the Massachusetts Institute of Technology. Simon Johnson is a professor at the same university. And James Robinson is a professor at University of Chicago.
Here is what the Nobel judges say was the reason for winning:
“Today, the richest 20 percent of countries are around 30 times wealthier than the poorest 20 percent of countries. The income gaps across countries have been highly persistent over the past 75 years.39 The available data also show that between-country disparities in income have grown over the past 200 years. Why are the income differences across countries so large and so persistent?
“This year’s Laureates have pioneered a new approach to providing credible, quantitative answers to this crucial question for humanity. By empirically examining the impact and persistence of colonial strategies on subsequent economic development, they have identified historical roots for the extractive institutional environments that characterize many low-income countries. Their emphasis on using natural experiments and historical data has initiated a new research tradition that continues to help uncover the historical drivers of prosperity, or lack thereof.
“Their research centers on the idea that political institutions fundamentally shape the wealth of nations. But what shapes these institutions? By integrating existing political science theories on democratic reform into a game-theoretic framework, Acemoglu and Robinson developed a dynamic model in which the ruling elite make strategic decisions about political institutions – particularly whether to extend the electoral franchise – in response to periodic threats. This framework is now standard for analyzing political institutional reform and has significantly impacted the research literature. And evidence is mounting in support of one of the model’s core implications: more inclusive governments promote economic development.”
Over the years (or is it decades?) I have posted on the work of various Nobel winners in economics.
Nobel people
Robert Lucas: the rationality of capitalism
Robert Mundell: nothing optimal
A prize auction
Poverty prize
Progressive capitalism – an oxymoron
Climate change and growth – Nordhaus and Romer
We’ve never had it so good!
Kenneth’s three arrows
What I have found is that, whatever the quality of the winner’s work, he or she (occasionally) usually got the prize for their worst piece of research, namely work that confirmed the mainstream view of economic world, while not actually taking us further into understanding its contradictions.
This conclusion I think applies to the latest winners. The work for which they received the $1m prize is for research that purports to show that those countries that achieve prosperity and end poverty are those that adopt ‘democracy’ (and by that is meant Western-style liberal democracy where people can speak out (mostly), can vote for officials every so often and expect the law to protect their lives and property (hopefully). Societies that are controlled by elites without any democratic accountability are ‘extractive’ of resources, do not respect property and value and so over time do not prosper. In a series of papers applying some empirical analysis (ie correlating democracy (as defined) with levels of prosperity), the Nobel winners claim to show this.
Indeed, the Nobel winners argue that colonisation of the Global South in the 18th and 19th centuries could be ‘inclusive’ and so turn the likes of North America into prosperous nations (forgetting the indigenous population) or ‘extractive’ and so keep countries in dire poverty (Africa). It all depends. Such is the theory.
This sort of economics is what is called institutional, namely that it is not so much the blind forces of the market and capital accumulation that drives growth (and inequalities), but the decisions and structures set up by humans. Supporting this model, the winners assert that revolutions precede economic changes and not that economic changes (or the lack thereof before a new economic environment) precede revolutions.
Two points follow from this. First, if growth and prosperity go hand in hand with ‘democracy’ and the likes of the Soviet Union, China, Vietnam are considered to have elites that are ‘extractive’ or undemocratic, how do our Nobellists explain their undoubted economic performance? Apparently, it is explained by the fact they started out poor and had a lot of ‘catching up’ to do, but soon their extractive character will catch up with them and China’s hyper growth will run out of steam. Perhaps now?
Second, is it correct to say that revolutions or political reforms are necessary to set things on the path to prosperity? Well, there may be some truth in that: would Russia in the early 20th century be where it is today without the 1917 revolution or China be where it is in 2024 without the revolution of 1949. But our Nobellists do not present us with those examples: theirs are getting the vote in Britain in the 19th century or independence for the American colonies in the 1770s.
But surely, the state of the economy, the way it functions, the investment and productivity of the workforce also has an effect? The emergence of capitalism and the industrial revolution in Britain preceded the move to universal suffrage. The English Civil War of the 1640s laid the political basis for the hegemony of the capitalist class in Britain, but it was the expansion of trade (including in slaves) and colonisation in the following century that took the economy forward.
The irony of this award is that the best work of Acemoglu and Johnson has come much more recently than in the past works that the Nobel judges have focused on. Only last year, the authors published Power and Progress , where they pose the contradiction in modern economies between technology diriving up the productivity of labour but also with the likelihood of increased inequality and poverty. Of course, their policy solutions do not touch on the question of a change in property relations, except to call for a greater balance between capital and labour.
What you can say in favour of this year’s winners is that at least their research is about trying understand the world and its development, instead of some arcane theorem of equilibrium in markets that many past winners have been honoured for. It’s just that their theory of ‘catching up’ is vague (or ‘contingent’ as they put it) and unconvincing.
I think we have a much better and convincing explanation of the processes of catching up (or not) from the recent book by Brazilian Marxist economists Adalmir Antonio Marquetti, Alessandro Miebach and Henrique Morrone who have produced an important and insightful book on global capitalist development, with an innovative new way of measuring the progress for the majority of humanity in the so-called Global South in ‘catching up’ on living standards with the ‘Global North’. This book deals with all the things that the Nobel winners ignore: productivity, capital accumulation, unequal exchange, exploitation – as well as the key institutional factor of who controls the surplus.
October 12, 2024
Tracking Marx’s Capital
In the Tracks of Marx’s Capital: Debates in Marxian Political Economy and Lessons for 21st Century Capitalism is an important new book by two well-known Marxist economists from Turkey. Ahmet Tonak and Sungur Savran bring together a series of works written by them over the last 40 years that ‘track’ the development and relevance of Marx’s analysis of the capitalist mode of production to the present day. Sungur Savran teaches at Istanbul Okan University and E Ahmet Tonak is a research affiliate at Smith College and teaches at UMass Amherst.

The book is divided into four parts to explore the core ideas of Marxian political economy relevant for modern day economies. The first part gives an overview of Capital and its methodology. The second part discusses the application of these ideas to the question of measuring what is ‘profit on alienation’, the rate of exploitation, the reconstruction of input-output tables and the role of the welfare state and social wage. The third part discusses new research in Marxian analysis in the 21st century, facing the challenges brought about by digital labour and the global economic crisis. In the final part, Sungur Savran discusses the differences between Marxist value theory and Sraffian, neo-Ricardian economics. Overall, the aim of the book is to develop an “adequate analysis of capitalism, with a view to counter and finally overcome the exploitation, oppression and alienation that this mode of production offers humanity.”
In part one, Tonak takes the reader on a trip through Marx’s first notes on his analysis of capitalism as expressed in what is now called the Grundrisse, written during the year after a major economic crisis in 1857. Tonak discusses the historical context and the content of the text in detail and summarises Marx’s main arguments on alienation, value and post-capitalism.
Savran takes up the story with two chapters dealing with the key points in all three volumes of Marx’s masterpiece, Capital. Savran emphasises the radical difference between Marx’s understanding of capitalism compared to the ‘classical’ economists like Adam Smith and David Ricardo. Savran makes the very important point, often ignored by other Marxist economists, that Capital was seen by Marx as ‘critique of political economy’ as it was in the 1850s, not just a development of the classical school, as many eminent contemporary Marxist economics, like Anwar Shaikh, appear to argue.
As Savran says Capital “should be understood as a wholesale criticism of that school”. While the classical economists recognised that value in an economy was created by human labour power, they denied the contradictory character of capitalist accumulation ie the exploitation of labour by capital and so the causes of regular and recurring crises in capitalist production and investment. As Engels said, one of the great discoveries of Marx was surplus value, how the owners of the means of production appropriate a surplus from the producers of value, the labour force, seemingly through equal exchange: wages for labour. This is ignored by the classical economists. What is more, Savran insists that, while the classical economists assumed that capitalism as a mode of production is here to stay forever and never questioned the categories of capitalism such as value, money, wage-labour, profit etc., Marx dwelt at length on these categories themselves and laid bare the historically specific and transitory relations of production that they embodied.
In the next chapter both authors combine to present the very important distinction in capitalist production between productive and unproductive labour, by looking at the different branches of activity in the modern economy. Marx says that new value is only created by human labour power – but not all labour. Productive labour for capital consists of those sections of labour that create new value for the owners of the means of production. Unproductive labour is due to those sections of labour that meet often very important economic needs, but do so in exchange for wages paid out of the surplus value created by the productive sectors. “Major sections of the working class in capitalist society are unproductive workers”, but “this does not imply in any sense that they are less important either for the well-being of society or the class struggle.” State employees, teachers, social workers, health workers are unproductive for capitalism as they do not deliver new value and surplus value for capital – indeed their wages are a deduction from overall surplus value. That partly explains why capital is so opposed to state spending and investment and in favour of privatisation. And from the point of view of Marxist analysis, it clarifies the need to look at the profitability of productive labour as the key indicator of the ‘health’ of capitalism.
Tonak was joint author with Anwar Shaikh of the seminal work, Measuring the wealth of nations: the political economy of national accounts, which measures the production of nations using Marxist categories of productive and unproductive labour. And in another chapter Tonak and Yiğit Karahanoğulları clarify the distinction between productive and unproductive labor. It first defines the meaning of exploitation based on the Marxian labor theory of value, on which the sole criterion of being exploited becomes the appropriation of surplus labor –even of those unproductive laborers, and then empirically estimates rates of exploitation of those unproductive workers in Turkey’s government, finance, and trade sectors. In another chapter, Tonak joins with Alper Duman to apply the Marxist classifications of productive and unproductive labour to economies using input-output tables. This reveals the dynamics of capitalist production, unlike mainstream classification left simply at ‘manufacturing’ and ‘services’.
In part 2, Tonak and Alper Duman discuss the vexed (in my opinion) question of the category, profit on alienation. Profit on alienation (POA) is presented as an extra source of profit in capitalist economies in addition to the profit appropriated in capitalist production. This rubs against my view of Marx’s value theory of equalities of value; namely that total value equals total prices of production in the aggregate after the redistribution of value between capitals; and so total surplus value will also equal total profit, interest and rent. These equalities support the view that only labour creates value and it is the distribution and circulation of that value that leads to unequal shares of total value.
The idea that there is another source of profit does not work for me. ‘Profit upon alienation’ is an idea that comes from an early classical economist, James Steuart. Some Marxist economists like Anwar Shaikh, and it seems Tonak and Duman follow him, interpret Marx to have accepted Steuart’s concept of profit from alienation as another source of profit that does not come from the exploitation of labour in production but from the circulation of capital.
But I don’t think Marx says this about Steuart’s concept – on the contrary. When you read what Marx says about Stueart’s classification, Marx says “Before the Physiocrats, surplus-value — that is, profit in the form of profit — was explained purely from exchange, the sale of the commodity above its value. Sir James Steuart on the whole did not get beyond this restricted view; (but) he must rather be regarded as the man who reproduced it in scientific form. I say “in scientific form”, for Steuart does not share the illusion that the surplus-value which accrues to the individual capitalist from selling the commodity above its value is a creation of new wealth.” And Marx goes on: “This profit upon alienation therefore arises from the price of the goods being greater than their real value, or from the goods being sold above their value. Gain on the one side therefore always involves loss on the other. No addition to the general stock is created.” But “his theory of “vibration of the balance of wealth between parties”, however little it touches the nature and origin of surplus-value itself, remains important in considering the distribution of surplus-value among different classes and among different categories such as profit, interest and rent. (my emphasis).” So there is no new profit from trade or transfer. This ‘relative’ profit is just that, relative.
Why does Shaikh, however, want to make much of this? Unfortunately, Shaikh accepts that Marx’s equivalences (total value=total price; surplus value = profit) do not hold, which is the neo-Ricardian critique. So he seeks to restore the equalities by finding new value from outside the exploitation of labour in production. Also, this supposedly helps explain how in the 20th century, finance capital can gain extra profit from outside production. This extra profit comes from ‘revenue’ (i.e. profit circulating or hoarded and now outside production). Just as a burglar can gain profit from stealing and selling on, so can a banker from extorting extra interest and fees from workers’ savings and mortgages.
Now finance capital can gain profit from slicing off a bit of workers’ wages in bank interest or from squeezing the profit of enterprise (non-financial capital), which is perhaps what Tonak and Duman mean. But this is not an extra source of profit but merely a redistribution of surplus value or a reduction of the value of labour power. It does not mean that finance capital ‘creates’ a new source of value in the circulation of capital.
In my view, it is wrong that an extra source of profit must be added into economic accounts within Marxist theory or for that matter even with the ‘classical tradition’ as suggested by Stueart. This concedes to the ambiguities of the modern “financialisation” theories, namely that it is finance alone that is now the exploiter, not capital as such.
That does not mean we should not estimate the amount of profit being gained from workers’ wages through mortgage interest and house prices by the financial sector – and Tonak and Duman provide just that with their empirical examples in the chapter. But this financial profit is just a part of total surplus value appropriated by producer capitalists and redistributed to finance capitalists through interest and rent and/or from workers’ wages (variable capital). The examples show financial profits (much of it ‘fictitious’ in the Marxist sense). Moreover, it is not necessary to find another source of profit to balance the Marxian equations because the neo-Ricardian critique has been refuted by successive Marxist analysts: Marx’s equivalences are consistent within his model.
In part 3, Tonak looks at the new forms of exploitation of labour in the digital economy. He argues that the digital economy can, as opposed to the opinion of many, be analysed on the basis of Marx’s theory of surplus value and profit. Facebook produces commodities just like other companies. Moreover, the surplus value produced by the productive workers of Facebook is the main source of the profits of the company and the wages of its unproductive workers, not some extraction of ‘rent’.
In another chapter, Savran demolishes theories that claimed after the 1980s that the world capitalist economy had entered a new stage that could be characterised as “post-Fordist”, implying that somehow ‘flexibility’ was equally good for the worker as it was for the capitalist. On the contrary, he demonstrates that the present digital methods of labour process control are but even more brutal forms of the subordination of labour to capital.
In another chapter, Tonak makes a very important point about modern imperialism. New theories of imperialism mostly focus on its political manifestations (such as wars and military invasions) or on the economic consequences of capitalistically imperialisticrelations (such as inequality and poverty). But the real focus should be on the role played by uneven economic relations between North and South in constituting the basis of political domination. The profit motive is fundamental to imperialism and the mechanisms of value transfer must be viewed as the means of reproducing unevenness among capitalist economies sustained by the global processes of capital accumulation. This is a view that Guglielmo Carchedi and I also expressed in our work.
In an excellent chapter, worth reading the book for this alone, Tonak and Savran summarise their views on the causes of crises in capitalism. Like me, they characterise the world economy in the aftermath of the so-called “global financial crisis” of 2008-2009 as in a long depression “in the lineage of the 1873-1896 Long Depression and the Great Depression of the 1930s.” Depressions are an expression of the historic decline of capitalism. Tonak and Savran survey all the modern theories of crisis and trenchantly demolish them to show the superiority of Marxist theory based on the law of the tendency of the rate of profit to fall for understanding the post-2008 crisis – and some of the empirical data they use to support this view come from my own work.
Finally in part four, Savran takes up the Marxist cudgels in the debate with the neo-Ricardians, who deny Marx’s theory of value and from that his theory of crises. This controversy raged among left-wing economists throughout the decades of the 1970s and 1980s. Savran concludes that there is no need to abandon the Marxist theory of the capitalist economy. He rebuts the neo-Ricardians’ claim that Marx’s theory of value is inconsistent in that it led to “negative values”. As “negative values” are pure nonsense, this was the basis for the neo-Ricardian proposition that Marx’s theory should be consigned to history. Negative values for a value creation theory would indeed be inconsistent nonsense, but Savran shows this neo-Ricardian claim is a fiction. Behind the neo-Ricardian critique lies the theory of value or production presented by Piero Sraffa. Savran argues that it is Sraffa’s theory that is internally inconsistent, not Marx’s.
Tonak and Savran show convincingly that Marx’s Capital remains the bedrock for understanding the laws of motion of capitalist production despite fashionable attempts to revise and refute Capital’s analysis. It still provides the only searchlight for guiding us towards a new social formation for humanity that is not based on exploitation of the many by the few, but brings human beings and nature together in a world of cooperation and freedom.
October 8, 2024
Measuring global poverty
To track progress towards its goal of eradicating extreme poverty by 2030, the UN relies on World Bank estimates of the share of the world population that fall below the so-called International Poverty Line (IPL).
In 1990, a group of independent researchers and the World Bank examined national poverty lines from some of the poorest countries in the world and converted those lines into a common currency by using purchasing power parity (PPP) exchange rates. The PPP exchange rates are constructed to ensure that the same quantity of goods and services are priced equivalently across countries. In all these statistics, the researchers not only took people’s monetary income into account, but also their non-monetary income and home production.
An IPL of $1.90 a day was derived as the mean of the national poverty lines of 15 poor countries in the 1990s, expressed in 2011 PPPs. The selection of these 15 poor countries was based on limited data at the time. With the gathering and analysis of new data from other low-income countries, the reference group was expanded. The IPL is now derived as the median of the national poverty lines of 28 of the world’s poorest countries, expressed in 2017 PPPs.
In September 2022, the figure at which this poverty line was set shifted from $1.90 to $2.15 a day. This reflected a change in the units in which the World Bank expressed its poverty and inequality data – from international dollars given in 2011 prices to international dollars given in 2017 prices. This means that anyone living on less than $2.15 a day is considered to be living in ‘extreme poverty’. Just under 700 million people globally are in this situation.

World Bank estimates of the share of people living in extreme poverty globally for 2019 – the latest available year – is 8.4%, or about 700m.
But this global figure does not give an accurate measure of poverty. There are poor people in every country, people who live in poor housing and who struggle to afford basic goods and services like heating, transport, and healthy food for themselves and their families. So the definition of poverty differs from country to country, but in high-income countries, the poverty line is around $30 per day. Even in the world’s richest countries, a substantial share of people – between every 10th and every 5th person – lives below this poverty line. If we apply this $30-a-day-poverty-line to the global income distribution, it shows that 85% of the world population – live on less than $30 per day. That means 6.7 billion people.
Historian Michail Moatsos produced new global dataset that goes back two centuries. According to his research three-quarters of the world lived in extreme poverty in 1820. This means they “could not afford a tiny space to live, some minimum heating capacity, and food that would not induce malnutrition.” But since then it has fallen sharply. And the share of the world population living in ‘extreme poverty’ as defined by the World Bank has never declined as rapidly as in the past three decades.

The decline in China was particularly fast.

So global poverty is nearly over? That depends on whether you accept the World Bank’s IPL. The content of the IPL is dubious to say the least. Unlike many national lines, it is not based on any direct assessment of the cost of essential needs. It is an absolute line, constant in value. Using this measure, it would suggest that ‘extreme poverty’ was the norm for virtually all of humanity for all of history, until the 19th century, when at last colonialism and capitalism came to the rescue.
Robert Allen has questioned this conclusion. He shows that the GDP data used by World Bank yields significant distortions when used to assess poverty. Instead, using consumption data, Allen constructs a ‘basic needs’ poverty line that’s roughly equivalent to the World Bank’s $1.90 line and calculates the share of people below it for three key regions: the US, UK and India. The results show that the high rates of extreme poverty in Asia are actually a modern phenomenon – “a development of the colonial era,” Allen writes: “Many factors may have been involved, but imperialism and globalization must have played leading roles.” Allen’s findings indicate that extreme poverty in 20th century Asia was significantly worse than under 13th century feudalism. Indeed, Allen finds that the $1.90/day line is lower than the level of consumption of enslaved people in the US in the 19th century. In other words, the poverty threshold the World Bank uses, and which underpins the ‘progress’ narrative, is below the level of enslavement.
The World Bank’s IPL at $2.15 a day threshold is ridiculously low. $5 a day is what the US Department of Agriculture calculates is the very minimum necessary to buy sufficient food. And that’s not taking account of other requirements for survival, such as shelter and clothing. In India, children living at $2.15 a day still have a 60% chance of being malnourished. In Niger, infants living at $2.15 have a mortality rate three times higher the global average. Less than 1% of Africa’s population has income above the Western median income.

In a 2006 paper, Peter Edward of Newcastle University used a measure that calculates that, in order to achieve normal human life expectancy of just over 70 years, people need roughly 2.7 to 3.9 times the existing World Bank poverty line. In the past, that was $5 a day. Using the World Bank’s new calculations, it’s about $7.40 a day. That delivers a figure of about 4.2 billion people live in poverty today, or up 1 billion over the past 35 years.
The large economic growth that lifted 800 million Chinese people out of extreme poverty since 1990 was a major contributor to the global decline in poverty. Peter Edward found that there were 1.139bn people getting less than $1 a day in 1993 and this fell to 1.093bn in 2001, a reduction of 85m. But China’s reduction over that period was 108m (no change in India), so all the reduction in the poverty numbers (not percentage) was due to China. Exclude China and total poverty in number was unchanged in most regions, while rising significantly in sub-Saharan Africa.
And there is another measure of poverty, the Multidimensional Poverty Index, covering 101 developing countries. This yields a poverty rate of 23% not 8%. Between 1990 and 2015, the number of people living under this line in Sub-Saharan Africa and the Middle East rose by some 140 million. So the standard of living of the world’s poorest, surviving on just half the World Bank’s austere line, has only increased a small amount in 30 years. The world is not even close to ending poverty.
Indeed, let’s look at another way of measuring global poverty. Two centuries ago, the huge majority of people in Sweden lived in deep poverty. Every fourth child died, and close to 90% of the population was so very poor that they could not afford a tiny space to live, some minimum heating capacity, and food that would not induce malnutrition. Today the poverty line in Sweden is set at about $30 per day (on a PPP basis). The strong economic growth in the last century made it possible that the majority of Swedes are now living above this poverty line.
This sounds like a good measure for all the world’s people. If we rely on the $30 a day threshold as a definition for global ‘poverty’ and take into account the different price levels across countries, the latest statistics show that 85% of the world population live below this poverty line. That means 6.7 billion people.

Rather than one billion people lifted out of poverty and a global decline from 35% from 1990 to 9% in 2018 using the World Bank’s extreme poverty IPL, at $5 a day there were still 40% of the world’s population in poverty; at $10 a day it was 62% and at $30 it was 85%. In all countries a significant share of people live in poverty. Even in the world’s richest countries, a substantial share of people – between every 10th and every 5th person – lives below this poverty line. No country, not even the richest countries, has eliminated poverty. There are no ‘developed’ countries.

At a minimum the world economy needs to increase five-fold for global poverty measured at $30 a day to decline substantially. Inequality between all the world’s countries would disappear entirely in this scenario. It should therefore be seen as a calculation of the minimum necessary growth for an end of poverty.

Higher growth rates in poor countries could bring about convergence of living standards globally. The World Bank reckons that the main limitation to ending ‘extreme poverty’ is the failure of a transfer of resources from the rich countries to the poor. That means that poverty (as defined) could be ended if governments chose to do so. The World Bank explained it this way : “Suppose that the real GDP growth for the developing world as a whole is 5 percent per year. If 10 percent of this GDP growth accrued to the 21 percent of the developing world’s population who are extremely poor, and this 10 percent was distributed in a way that the growth in income of each poor person was exactly his/her distance to the World Bank Poverty Line, extreme poverty would end.”
But there is little sign that the neo-colonial economies still under the boot of imperialism have any hope of closing the income gap with the imperialist bloc. Currently, international development assistance is a little over $100 billion a year. This is just five times more than the bonus Goldman Sachs staff paid themselves during one crisis year and more than five times less the annual income flows out of the poor countries to the rich. According to UNCTAD, net resource transfers from developing to developed countries have averaged $700bn a year, even after taking into account foreign aid assistance. So far from resources being transferred from the rich to the poorer countries to reduce global poverty, the opposite is the case.
UN rapporteur Philip Alston concluded his report to the UN on global poverty by pointing out that “using historic growth rates and excluding any negative effects of climate change (an impossible scenario), it would take 100 years to eradicate poverty under the World Bank’s line and 200 years under a $5 a day line (Agenda 2230!). This would also require a 15- or 173-fold increase in global GDP respectively.” The poor will always be with us under capitalism.
Michael Roberts's Blog

- Michael Roberts's profile
- 35 followers


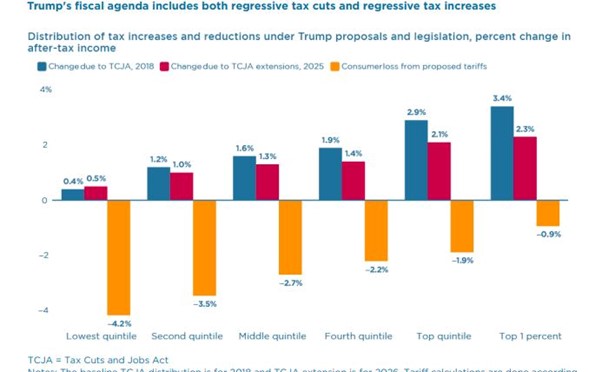
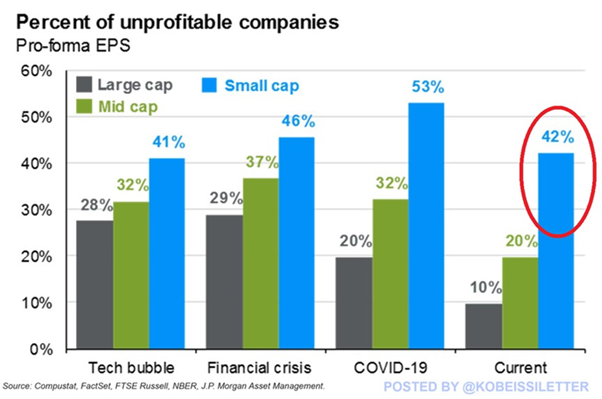
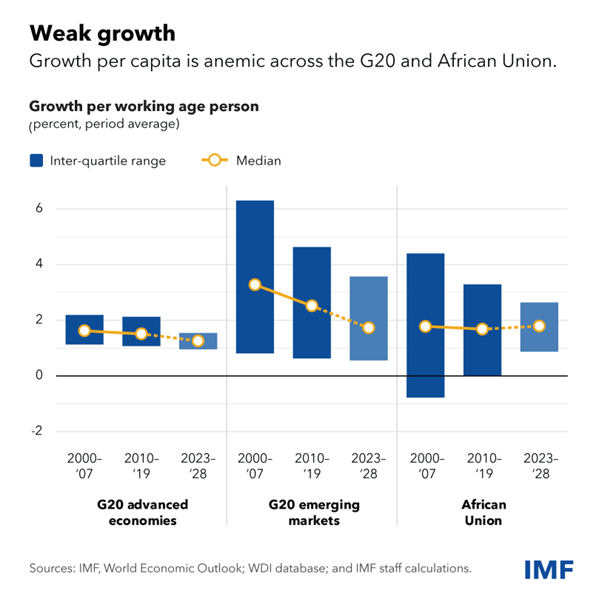
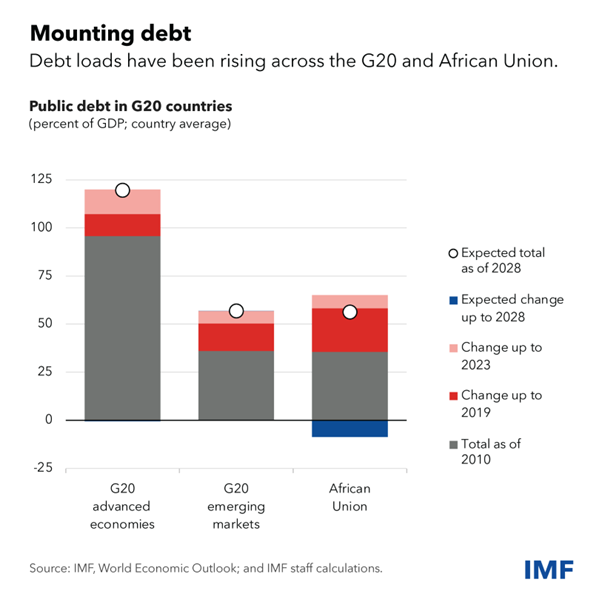