
Michael Roberts's Blog, page 12
July 2, 2024
Broken Britain
UK citizens vote in a general election on 4 July. The opinion polls currently forecast that the incumbent Conservative party will be heavily defeated after 14 years in government. The opposition Labour party is expected to gain a majority of over 250 seats, a record landslide, with the Conservatives getting less than 100 seats.

But ahead of the election, 75% of Britons have a negative view of politics in Britain. And Labour and the Conservatives are set to record their lowest combined share of the vote in a century. Instead, smaller parties such as Reform, the Liberal Democrats and the Greens have all made advances.
This result is a consequence of the disastrous decline in the British economy and living standards for most Britons alongside a decimation of public services and welfare. British capital is broken.
The UK economy is now the ninth-largest world economy in terms of output at prices adjusted for purchasing power and sixth when output is calculated at exchange rates. But British imperialism has been in steady decline since the end of WW1, giving way to US imperialism as the hegemonic power. And after WW2, the UK increasingly became a subservient ‘junior partner’ to America. The relative decline in the UK economy is revealed by its long-term fall in productivity growth compared to other imperialist economies, particularly in the 21st century.

In his recent book, Vassal State – how America runs Britain, Angus Hanton shows the dominant role that US companies and finance play in owning and controlling large sections of what remains of British industries. This US takeover was accepted and even encouraged by successive British governments from Tory Thatcher to Labour’s Blair.
Hanton shows that in Thatcher’s second full year in office, 1981, only 3.6 per cent of UK shares were owned overseas. By 2020 that number was more than 56 per cent. Of all the assets held by US corporations in Europe, over half of them are in the UK. US corporations have more employees in the UK than the number they have in Germany, France, Italy, Portugal and Sweden combined. The largest US companies sell more than $700 billion of goods and services to the UK, which amounts to over a quarter of the UK’s total GDP.
Almost 1.5 million UK workers are officially dependent on large US employers; if we count the indirect employees, such as Uber drivers and Amazon’s agency workers, at least 2 million UK workers have ultimate bosses in the US (6–7 per cent of the UK workforce). By 2020 there were 1,256 US multinationals in the UK – based on the IRS definition of a multinational as an enterprise with more than $850 million of foreign sales.
From the 1980s, Britain has increasingly become what we could call a ‘rentier economy’, ending most of its manufacturing base and relying mostly on the City of London financial sector and accompanying business services, providing a conduit for the redistribution of capital from the Middle East oil sheikhs, Russian oligarchs, Indian entrepreneurs and American techs.
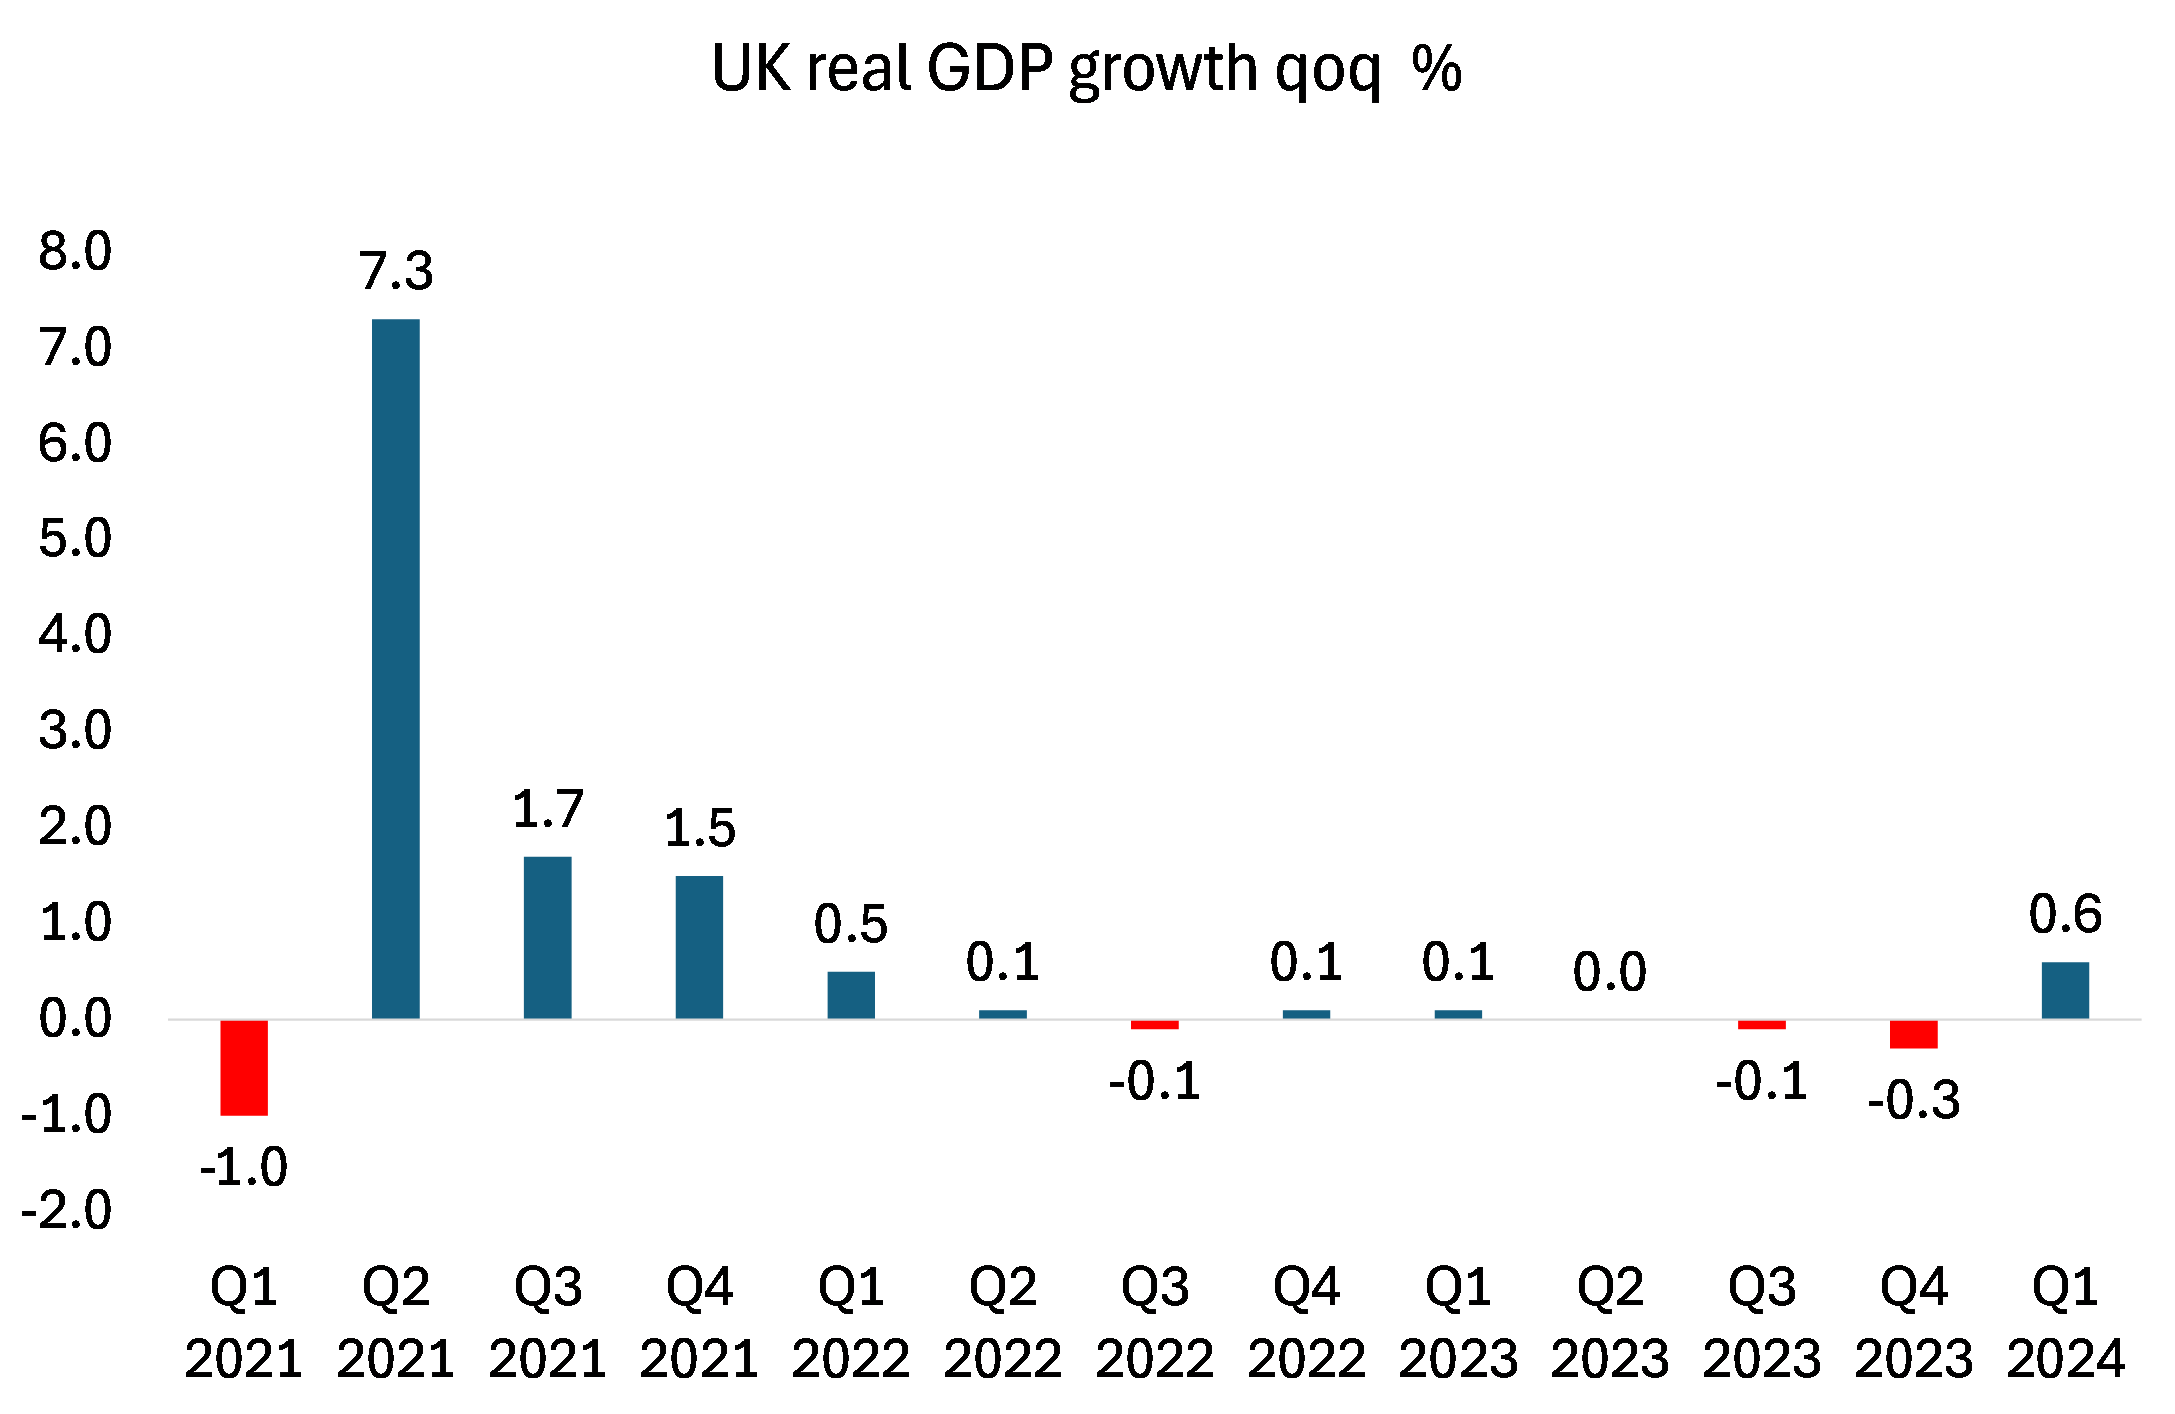
Throughout this period, British capitalism declined relative to its peers among the G7 economies and other larger European states. But particularly after the Great Recession, and after the decision to leave the EU and the COVID pandemics, the British economy went into a downward spiral that so far it has not been able to stop. Real GDP growth is still more than 20% below its pre-2008 trend – although that fallback applies to all G7 economies, if at a lesser rate.

The UK economy was the hardest hit of the top G7 economies in the year of the COVID. Real GDP fell 9.9%, which the then finance minister and now PM Rishi Sunak admitted was the worst contraction in national income in 300 years! The economic think-tank, the Resolution Foundation, reckons that the UK economy may not have had “a technical recession but we are experiencing the weakest growth for 65 years outside of one (a recession).”
What is also forgotten is that population growth is at its fastest rate in a century (three-quarters driven by immigration of 6m people since 2010). If population growth is excluded, the UK has barely seen any economic growth, with GDP per person only just above the level of 2007 and real consumer purchasing power still lower than in 2007.
Indeed, productivity growth (that’s output per worker per hour) has been terrible. Productivity has slowed to under 1% a year. Before the 2008-09 economic crisis, Britain’s output per hour worked grew steadily at an annual pace of 2.2% a year. In the decade since 2007, that rate has dropped to 0.2%. If the previous trend had continued, the UK’s national income would be 20% higher than it is today.

Only Italy’s productivity growth record is worse within the G7.

And it is estimated that the post-Brexit trading relationship between the UK and EU, as set out in the ‘Trade and Cooperation Agreement’ (TCA) that came into effect on 1 January 2021, will reduce long-run productivity by 4 per cent relative to remaining in the EU.
Long-run effect on productivity of trading with EU on FTA terms
In effect, UK productivity has flat-lined for a decade. So now productivity levels are as much as one-third below those in the US, Germany and France: “the average French worker achieves by Thursday lunchtime what the average British worker achieves only by close of business on a Friday.” Indeed, excluding London the UK’s average productivity level is below that of the poorest state in the US, Mississippi.
The productivity gap between the top- and bottom-performing companies is materially larger in the UK than in France, Germany or the US. This productivity gap has also widened by far more since the crisis – around 2-3 times more – in the UK than elsewhere. This long and lengthening tail of ‘stationary’ companies explains why the UK has a one-third productivity gap with international competitors and a one-fifth productivity gap relative to the past.
Why is productivity growth so poor, especially among the key big British multi-nationals? The answer is clear: reduced business investment growth. Business investment growth has been on a steady trend downwards since the end of the Great Recession. Total UK investment to GDP has been lower than most comparable capitalist economies and has been declining for the last 30 years. The UK’s investment performance is worse than every other G7 country. Compared to Japan, the USA, Germany, France, Italy and Canada, the UK languished in last place for business investment in 2022, a spot now held for three years in a row and for 24 out of the last 30 years.

Businesses aren’t choosing to invest in the UK. The UK ranks a lowly 28th for business investment out of 31 OECD countries. Countries like Slovenia, Latvia and Hungary all attract higher levels of private sector investment than the UK as a per cent of GDP.

The rentier nature of British capital is revealed by this IPPR report: “Corporate investment has fallen below the rate of depreciation – meaning that our capital stock is falling – and investment in research and development (R&D) is lower than in our major competitors. Among the causes are a banking system that is not sufficiently focused on lending for business growth, and the increasing short-termism of our financial and corporate sector. Under pressure from equity markets increasingly focused on short-term returns, businesses are distributing an increasing proportion of their earnings to their shareholders rather than investing them for the future.”

Nothing more confirms the decline of UK capitalism and its failure to invest and raise productivity than the profitability of British capital. It is a story of long-term decline since the 1950s. The decline was partially reversed for a while under the neoliberal policies of the Thatcher regime (at the expense of labour’s share on national income), but the decline resumed with a vengeance in the 21st century.

As a result of weak growth in national income and ensuing austerity measures to hold down wages, the UK is only one of six countries in the 30-nation OECD bloc where earnings after inflation are still below 2007 levels and the UK is the worst of the top seven G7 economies.

In 2022, real pay in the US and OECD was up 17 per cent and 10 per cent higher respectively than in 2007, according to OECD data. In Britain it was unchanged. UK living standards have underperformed those of most wealthy countries since the Conservatives entered government in 2010, according to research by the UK Institute for Fiscal Studies.
The callous austerity policies of the Conservatives after the Great Recession of 2009 in cutting public services and freezing wages have torn up the social safety net. Rates of basic benefits are now lower relative to wages than at any time since the inception of the Beveridge settlement, which established the welfare state in the 1940s. Basic protection against unemployment in the UK is also the lowest in the OECD.
“The inflationary spiral after COVID was the worst in the G7. It may have subsided now, but the rise in private rents is sharp and ongoing; nearly 9 per cent a year. Energy bills may now be falling, but from such a ludicrous peak that they are still up around 60 per cent on three years ago. Food, meanwhile, is up by around 30 per cent over the same period. The result is that a higher percentage of Britons live below the poverty line than in Poland!” Tom Clark, Broke.
And these are averages. Britain is now the second most economically unequal of the larger developed countries, after the US: 50 years ago it was one of the most equal. The UK has a very high inequality of income compared to other developed countries; the 9th most unequal incomes of 38 OECD countries. Compared to other developed countries the UK has a very unequal distribution of income, with a Gini coefficient of 0.351. The UK has one of the highest levels of income inequality in Europe, although it is less unequal than the United States.

The UK’s wealth inequality is much more severe than income inequality, with the top fifth taking 36% of the country’s income and 63% of the country’s wealth, while the bottom fifth have only 8% of the income and only 0.5% of the wealth, according to the Office for National Statistics.


The UK has the widest regional disparities in wages in the whole of Europe. Indeed, people in north-east of England have an average standard of living less than half that of the average Londoner. Wealth is also unevenly spread across Great Britain. The South-East is the wealthiest of all regions with median household total wealth of £503,400, over twice the amount of wealth in households in the North of England.
As for poverty and health, it could hardly be worse in a so-called rich country. Welfare cuts have caused 190,000 excess deaths from 2010 to 2019. According to the Office for National Statistics, life expectancy at birth for 2020/22 is “back to the same level as 2010 to 2012 for females” and “slightly below” that benchmark for males—a whole decade, in other words, of zero or negative progress.

“The most deprived areas of England,” government demographers report, registered “a significant decrease” in life expectancy in the second half of the 2010s. Looking ahead to 2040 (and comparing against a 2019 baseline), analysts at Liverpool University and the Health Foundation foresee an increase of some 700,000 in the number of working-age Britons living with a major long-term illness, overwhelmingly accounted for by a further rocketing of already-heavy rates of chronic pain, diabetes and anxiety/depression in poorer communities.
Child poverty rates have rocketed. In 2022/23, the number of children living in poverty increased by 100,000 from 4.2 million in 2021/22 to 4.3 million children. That’s 30% of children in the UK. The rate of child poverty in the North East of England increased by 9 percentage points in the seven years between 2015 and 2022. Substantial increases can also be seen in the Midlands and the North West. Tower Hamlets had the highest concentration of child poverty in the UK in 2021/22, with almost half of children living below the poverty line after accounting for housing costs. Child poverty rates are also high in other large cities like Birmingham and Manchester.
The rise of ‘food banks’ has been a feature of the last ten years. The official tally of people whose households had turned to foodbanks in the last 12 months stands at 3m.

And families with “very low food security” now stand at 3.7m, a total that has shot up by a full two-thirds in the last year alone.
One of the greatest achievements of the labour movement was the establishment of a National Health Service, free at the point of use. After 70 years, this great public service is now in tatters; starved of funds and staff and services increasingly hived off to the profits of the private sector. NHS funding faces the biggest real terms cut since the 1970s, warns the Institute for Fiscal Studies.
The NHS has privatised 60% of NHS cataract operations to private providers. Private clinics received £700m for cataracts from 2018-19 to 2022-23 and 30-40% of money vanishes in profits. And a new analysis by We Own It reveals that £6.7 billion, or £10 million each week, has left the NHS’s budget in the form of profits on all private contracts given by the NHS in the last decade or so. We Own It analysis shows that out of the £6.7 billion total profits that have left the NHS, £5.2 billion, or 78%, were on contracts for services.
Britons now have access to fewer hospital beds and dentists relative to the population than in most other big economies, according to OECD data. And the waiting list for operations is at a record level.

Then there is housing. In the 30 years from 1989, 3 million fewer houses were built than in the previous 30 years, despite a strong increase in demand. This mismatch between supply and demand has contributed to a serious affordability crisis. In 1997 the ratio of median house price to median income across England and Wales was 3.6 and in London it was 4.0. By 2023 the median house in London cost 12 times the median earnings and even in the least unaffordable region, north-east England, the ratio was 5.0.
This rise means only younger people whose parents – even grandparents – were homeowners can now be reasonably optimistic of being able to buy. But UK housing costs relative to income are higher than in the past and compared with other countries. Rents rose by 13 per cent in the two years to May 2024 — the fastest pace in three decades and three times the rate in France and Germany.
At the other end of the housing ‘market’ Rough sleeping in England is up by 60 per cent over the last two years, and the number of families stuck in (terrible) temporary accommodation has doubled since 2010.
As for education, that is also in deep trouble. A solid education system supports the services sector: almost 60 per cent of Britons between the ages of 25 and 34 are educated to at least tertiary — or university or college — level, OECD data shows. That is the sixth highest among advanced economies. Pupils in Britain perform better in reading, maths and science than peers in France, Germany or Italy. They also have access to 90 of the world’s top 1,500 universities, according to the annual World University Rankings, more than France and Germany combined. But the pressure is now for cuts in school funding and UK universities have slipped in international rankings, while many face bankruptcy and closure as overseas students dwindle. As for students, Britain has gone from providing free tertiary education in the 1960s to huge fees funded by crippling loans.
Then there are the prisons. We lock up lots of people in the UK and now jails are running out of space “within days”, say prison governors in England and Wales. “The entire criminal justice system stands on the precipice of failure.” Instead of putting young people in jail, maybe there should some places for them to go. But two-thirds of council-funded youth centres in England have been closed since 2010. That’s because local councils have suffered cuts of 20% in real terms since 2010, leaving a gap of over £6bn to be found over the next two years.
Finally, there are the utilities. Heavily privatized under Thatcher, they have turned out to be a disaster for users and a profits bonanza for shareholders. In Europe, only in the UK has privatised water and the private equity owners of these water companies have milked the public for billions, while destroying the quality of water and the environment. In March it was revealed that raw sewage was discharged into waterways for 3.6m hours in 2023 by England’s privatised water firms, more than double the figure in 2022. Research by the Rivers Trust found that sewage was spilled for 1,372 hours in the Guildford constituency last year, and recent water testing by local campaigners found E coli in the river last month at nearly 10 times the safe rate in government standards. Households in various parts of the country have become ill and told not to drink the tap water.
Are there any redeeming features in this broken Britain? Yael Selfin, chief economist at consultancy KPMG UK, said Britain had some “long enduring advantages”, such as the English language and Greenwich Mean Time, which meant the business day in London overlapped with financial markets around the world. So Britons speak English and have a world time benchmark- wow!
The FT came forward with another merit, a prime minister of Asian origin: “This isn’t the only country in the west that would elevate a non-white head of government. But it might be the only one where it would stir so little discussion….. A quiet miracle is still a miracle.” The richest man in the UK parliament is a miracle?
In an interview on the BBC’s Sunday with Laura Kuenssberg show, PM Sunak defended his party’s record in government over the past 14 years. “It is a better place to live than it was in 2010.” When it was put to him that Britons had become poorer and sicker, and that public services had deteriorated since 2010, he said: “I just don’t accept that.” He may not accept it but it is still the reality.
Paul Dales, economist at the research company Capital Economics, said: “More investment in housing, infrastructure, education and health would help turn some of the weaknesses into strengths.” Well, blow me down.
I’ll be looking at the new Labour government’s economic program after the election.


June 29, 2024
France: Macron’s gamble
France votes over two rounds on June 30 and July 7 in a snap parliamentary election called by President Macron after his party suffered a heavy defeat in the June EU Assembly elections. France has two rounds of voting: if a candidate gets 50% of more in the first round, he or she is elected. If not, then in the second round, the top two candidates fight it out. A survey released by pollster IFOP found the National Rally (NR) leading all other parties with the support of 35% of voters. The New Popular Front (NFP), a leftist alliance of socialists, communists and greens, came in second with 30% and President Macron’s centrist Ensemble was third with 20%.
If those results hold, no party will amass enough votes to meet the 289-seat threshold for an absolute majority in the 577-seat lower chamber, the National Assembly. Macron’s party is already governing without a majority after its poorer-than-expected showing in the last 2022 legislative elections, forcing it either to seek out coalitions to pass legislation or use a presidential edict to bypass the Assembly without a vote.
Under France’s constitution set up by President de Gaulle in the late 1950s, Article 8 says the president appoints the prime minister. Macron would be expected to offer the job to the leading parliamentary group. But as that is likely to be the National Rally, Macron may seek to form a coalition of other parties. Actually, the NR party leader Jordan Bardella has said that he would not accept being prime minister if his party does not get an outright majority.
So the scene is set for either paralysis or possibly a financial crisis as foreign investors and French big business run for cover if the NR should gain an outright majority. The Financial Times is worried. “At best, a parliament dominated by the political extremes would plunge France into a period of prolonged instability. At worst, it would lead to the adoption of spendthrift and nationalistic policies that would swiftly provoke an economic and social crisis in France.”
Basically, France is split three ways politically. One-third backs a pro-EU, pro-capitalist France as represented by the ‘centrist’ Macron; one-third backs a nationalist, anti-EU, anti-immigration France as represented by Le Pen’s NR; and one-third backs a socialist pro-labour France as represented by Melenchon and the newly formed NFP.
France is a key G7 economy, now the seventh largest in the world with 68m people, representing around one-fifth of the Euro area GDP. But its former imperialist global past has been reduced to exerting control over French-speaking West Africa (that dominance is now seriously under threat) and trying to control the EU in alliance with Germany.
In manufacturing, France is one of the global leaders in the automotive, aerospace and railway sectors as well as in cosmetics and luxury goods. It has a highly educated labour force and the highest number of science graduates per thousand workers in Europe. Its services sector is large, led by tourism (France has the largest number of tourist visits in the world) and financial services. Additionally, France is one of the world’s largest exporters of farm and agricultural products and is renowned for its wine, spirits and cheeses. The French government provides significant subsidies to this sector and France is the largest exporter of farm products in Europe. France is linked closely to its largest trading partner, Germany, which accounts for more than 17% of France’s exports and 19% of total imports.
Similar to many western European nations, France has experienced poor real GDP growth. Annual real GDP growth has been steadily falling over the last 40 years. And now in the 2020s, it has virtually ground to a halt.

The French economy has followed the same pattern as the other G7 economies in the 21st century: slowing economic growth in the 2000s, then the Great Recession, followed by even weaker growth in the 2010s, along with slowing investment growth and stagnating productivity. The investment to GDP ratio has been volatile, falling sharply in successive recessions, but currently suffering a record fall.

Slowing productive investment growth generally leads to stagnating labour productivity and France is increasingly affected. Indeed, total factor productivity (a measure of the impact of ‘innovation’) is now falling absolutely.

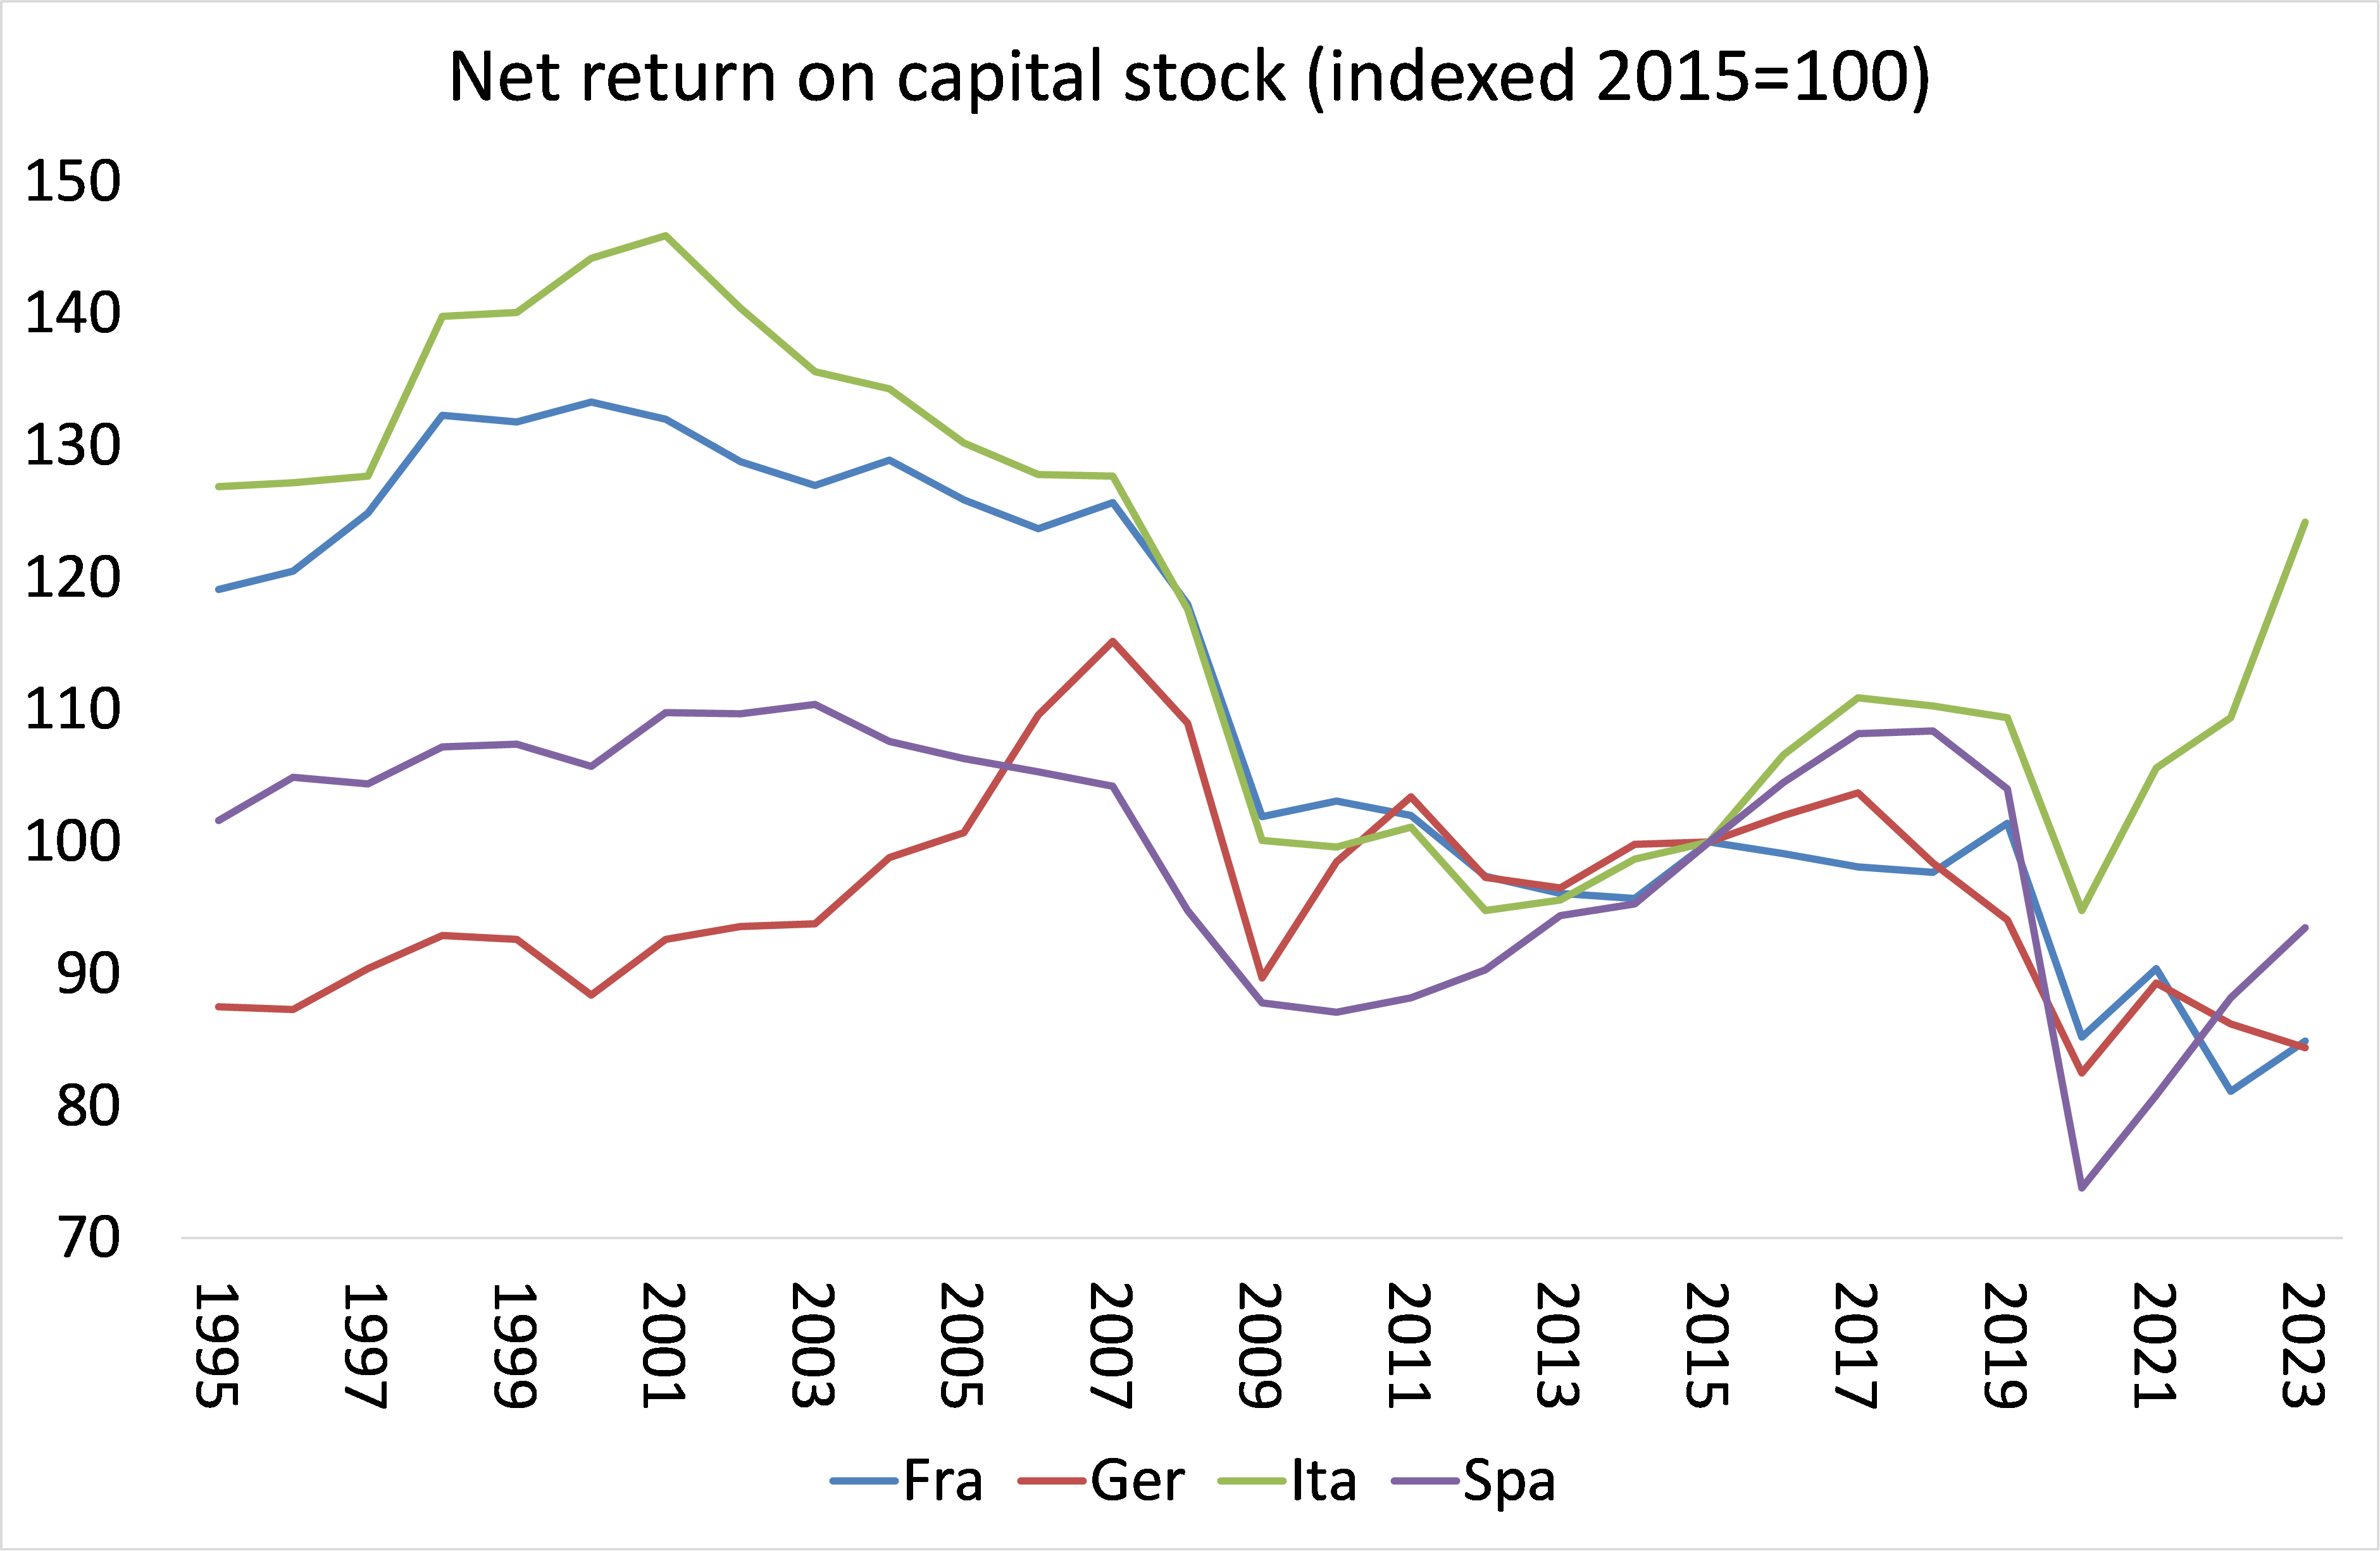
As always, behind this relative stagnation lies the falling profitability of capital. French capital’s profitability started to decline sharply at the beginning of the 21st century (the advent of the euro) and gathered pace after the Great Recession. My calculations suggest that average profitability is now at an all-time low after a fall during the COVID pandemic slump.

Source: Basu-Wasner, EU AMECO, author’s calcualtions
No wonder corporate bankruptcies are rising fast since the pandemic.

Manufacturing continues to contract. The HCOB France Manufacturing PMI fell to 45.3 in June 2024 from 46.4 in the previous month (a score of 50 means stagnation). This marked the 17th consecutive month of contraction in France’s factory activity,

Even the Banque de France in its latest report had to admit that “economic activity in France is set to remain subdued in 2024 (0.7% annual growth) after a significant slowdown in the second half of 2023.” Poor productivity growth and high inflation has meant that real wage earnings have fallen – again as in many other G7 economies. Average real wages are still nearly 3% below 2019 levels.

Source: OECD
And employment growth has stopped.

Banque de France admits that in 2024 “business investment is likely to be penalised by relatively sluggish activity, as well as by financing costs and lending conditions.” The BdF mentions the geopolitical disaster that the Ukraine war has meant for France (and even more for Germany), which has kept inflation rates up and GDP growth down. It even expects a larger slowdown in nominal wages than it expected at the start of 2024 and “we cannot rule out the possibility of another downward surprise on business productivity, which could reinforce the dynamics of unit wage costs and give rise to additional inflationary pressure.”
The decline in average real incomes in the last four years only adds to the inequality of incomes and wealth in France. Although inequalities of income and wealth in France are not nearly so extreme as in the US, they are still grotesque. Indeed, inequality has worsened in the last 40 years. In 1983, the top 1% of income earners took 7.5% of all personal income, 10% took 30% and the bottom 50% received just 21.4%. By 2022, the top 1% took 12.7% (an over 60% increase), while the top 10% share rose to 34.8% and the bottom 50% share fell to 20.3%.
Inequality of wealth (net personal wealth) is, as usual in all major economies, much worse. In 1983 the top 1% of wealth holders owned 15.9% of all personal wealth in France, the top 10% had 50% and the bottom 50% held just 8.9%. By 2022, those inequalities got even worse. The top 1% of wealth holders now had 24% (over a 60% increase), the top 10% now owned 57.7% and the bottom 50% saw their share of personal wealth fall to just 5.1% (a 48% decline).

Source: World Inequality Lab
In its latest report, the Observatoire des Inégalités paints a picture of a country where gaps in income levels and living standards between the most affluent and the least affluent are widening. The minimum living standard gap of the richest 10% has remained around 3.28 times higher than the maximum living standard of the poorest 10%.
This weekend election is not for the presidency, which remains the most powerful force in the constitution. Emmanuel Macron is in that office until May 2027. The National Assembly has limited powers, although the government and Assembly does set the budget and direct economic policy. But given what has happened to living standards and public services in France under successive governments, no wonder enthusiasm for the Assembly elections has waned.

In 2018, the voter turnout was less than 50% for the first time, compared to a near 65% in early 2000s. National Rally may become the biggest party in the Assembly after the weekend, but the real winner will be the No vote party.
If National Rally gains an outright majority, this will probably spook financial markets for a while. That’s because what worries big business and the financial sector is ‘uncontrolled’ government spending and rising public debt. National Rally plans to help (small) business with lower taxes. NR would cut the pension age back to 60 years, reversing Macron’s recent forced rise to 64 years. NR claims it will increase benefits to the old and to children, while keeping the working week at 35 hours and overtime tax-free!
NR’s economic policy is thus anathema to French capital and attractive to French labour, but it is combined with racist and nationalist measures. Muslims and other immigrants would lose rights to work in various public posts and their relatives could deported. NR leader Bardella says that immigrants have nothing to fear from his government “as long as they behave themselves”.
Big business is hoping that NR will be tamed in government and by the threat of ‘market discipline’ as debt costs rise. They look to a repeat of the very acceptable role adopted by Italy’s’ ‘hard right’ PM Meloni, who has fitted nicely into all the policies of EU Commission and NATO. In practice, under the NR, there will be no real attack on the hegemony of French big business. NR policies in a capitalist France with its low growth and profitability are utopian. Neither the needs of labour nor capital will be met.
When we turn to the NFP, we find a similar utopianism, even if it is trying to promote the interests of labour over capital. Its economic program is a 100-billion-euro economic stimulus plan funded by government borrowing and some nationalisation in sectors such as the motorway network. The NFP would increase public spending, raise minimum and public sector wages, freeze prices of key essentials, increase taxes on the wealthy, create jobs to reduce the unemployment rate to 6% and also, like the NR, cut the retirement age to 60. But big business and finance do not want government spending to rise. For them, austerity is necessary. You see, the French government budget deficit is widening.

And this is driving up government debt to exceed the agreed limits under Eurozone fiscal rules.

This must be stopped. But what the economic apologists for French capital ignore is why the government deficits and debt have risen. It is not because of ‘excessive’ government spending on welfare and benefits etc; it is because France, like other G7 economies has suffered a series of financial crashes and slumps so that the public sector has had to bail out the private sector. And slow growth in output, investment and incomes has reduced tax revenues and increased public spending relative to GDP. The solution is not austerity but planned public investment through control of the strategic sectors of the French economy to increase output, investment and incomes.
But such policies would be very frightening for French capital. So it will opt for the racist NR government over the leftist NFP – no surprise there. Take the view of Olivier Blanchard, a French mainstream economist and former chief at the IMF. Both the NR and Left programs are bad news, but for him it is the program of the NFP that is worse, despite the racist, anti-immigrant policies of the National Rally. Why?
Well, you see there are two sorts of left programs. There is “a social democratic one that tries to equalize chances and redistribute without destroying the incentives to create and produce“. (By this Blanchard means capitalism is maintained). And then there is “a revolutionary one, which goes much further, is nearly confiscatory in nature” Shock, horror! Blanchard: “as a social democrat, I believe in equalizing chances, in improving education, in redistributing income from the rich to the poor”, but the NFP program “can only lead, like many of its predecessors, to economic catastrophe.”
In his usual quixotic hubris, Macron is gambling that, in calling the election, along with the help of the media and mainstream opinion, he can frighten enough voters not to vote for the ‘extremes’ of right or left, and so restore the political stability of French capitalism. If the polls are right, that gamble will not pay off.
The mainstream and official economic forecasts try to put on a brave face and expect France to come out of its stagnation and recover modestly in 2025.

But this is based on hope more than expectation. And now French capital faces political paralysis at best or a damaging hit at worst.
June 23, 2024
Fixing the climate – it just ain’t profitable
In 2023, it was the first time in recorded history that the global surface temperature of the planet breached 2.0°C above the 1850-1900 IPCC baseline. Also more than 90% of the world’s oceans suffered heatwave conditions, glaciers lost the most ice on record and the extent of Antarctic sea ice fell to by far the lowest levels ever measured.

And last month marked a full year of record-high global temperatures, with May 2024 ranking as the warmest May on record. Earth’s ocean temperatures also set a record high for the 14th month in a row, according to data and scientists from NOAA’s National Centers for Environmental Information. According to NCEI’s Global Annual Temperature Rankings Outlook, there is a 50% chance that 2024 will rank as the warmest year on record and a 100% chance that it will rank in the top five.
The current trend of carbon dioxide emissions (the main cause of global warming and climate change) suggests that the earth’s average surface temperature will easily breach the 1.5C above the baseline target limit set by the 2015 Paris Climate Conference by the end of this decade. Indeed, without much more drastic action, CO2 emissions are heading for at least 1.8C above the baseline by the middle of this century or earlier. UN climate chief Simon Stiell said the planet was on track for a “ruinously high” rise in the global temperature of 2.7C since the industrial era.

What is to be done? There are a host of technologies being proposed to control carbon emissions and even capture existing CO2 and take it out of the atmosphere. Moreover, the drive to ‘phase out’ fossil fuel production and replace it with so-called renewables (wind, solar, hydro etc) is the rallying call from ‘the powers that be’, taken up at the last international climate conference, COP28. And clean energy investment is now nearly double fossil fuels.

But it is still not enough. Fossil fuel production is not being ‘phased out’ quickly enough and renewables are not replacing fossil fuels quickly enough. The International Renewable Energy Agency estimates that an average of 1,000 gigawatts of renewable power capacity needs to be built globally every year until 2030. But the world’s clean energy plans (and they are only plans) still fall almost one-third short of what is needed to reach that figure.
And to reach the necessary level of investment, climate finance will need to increase to about $9tn a year globally by 2030, up from just under $1.3tn in 2021-22, according to the Climate Policy Initiative.

This funding is just not coming. Rich countries finally met their target to deliver a meagre $100bn in climate finance to poorer nations in 2022 – two years later than promised. Moreover, over the past decade, public flows have driven most of the growth in climate-related transfers to poorer countries. Government aid or multilateral development bank finance almost doubled between 2013 and 2022, from $38bn to$83bn in total. But private climate finance was “stubbornly low” at just $21.9bn in 2022, according to the OECD.
And even that public funding was overstated. That is because some of the money has been taken from existing overseas aid budgets, and some of what is counted as climate finance includes funds primarily allocated to development projects such as health and education, with only tangential benefits to the climate. If all these sums are stripped out, then only $21-24.5bn of the $83bn remains as pure climate finance without strings attached, according to Oxfam in its Climate Finance Shadow Report 2023.
Why is the climate target not being met? Why is the necessary finance not forthcoming? It is not the cost price of renewables. Prices of renewables have fallen sharply in the last few years. The problem is that governments are insisting that private investment should lead the drive to renewable power. But private investment only takes place if it is profitable to invest.
Profitability is the problem – in two ways. First, average profitability globally is at low levels and so investment growth in everything has similarly slowed. Second, ironically and contradictorily, lower investment and GDP growth will slow carbon emissions expansion by reducing fossil fuel energy use. A recent study of 18 countries that managed to ‘peak and decline’ their carbon emissions in the period 2002-2015 demonstrated that one key driver of this process – accounting for 36% of the fall in emissions on average – was decreased energy use that resulted in part from ‘low growth in GDP of around 1%’ (Le Quéré et al., 2019: 215). As the GDP growth rate approached zero, absolutely decoupling growth from carbon emissions becomes more feasible (Schroder and Storm, 2020).
But on the other hand, lower renewables prices drags down the profitability of such investments. Solar panel manufacturing is suffering a severe profit squeeze, along with operators of solar farms. This reveals the fundamental contradiction in capitalist investment between reducing costs through higher productivity and slowing investment because of falling profitability.
This is the key message from yet another excellent book by Brett Christophers, The Price is Wrong – why capitalism won’t save the planet. Christophers argues that it is not the price of renewables versus fossil fuel energy that is the obstacle to meeting the investment targets to limit global warming. It is the profitability of renewables compared to fossil fuel production.

“In the case of renewables, the principal decision makers are energy companies, other developers and – in particular – the financial institutions whose decisions about whether or not to advance investment capital, and at what cost, ultimately determine whether solar and wind farm projects proceed or not. What, we might therefore ask, is the overriding question in the minds of such financiers when presented with investment proposals by renewables developers? It is the following: will I get my money back, and with an acceptable level of financial return? The basic answer to this question is, of course: only, generally, if the project is profitable.”
Christophers shows that in a country such as Sweden, wind power can be produced very cheaply. But the very cheapening of the costs also depresses its revenue potential. This contradiction has increased the arguments of fossil fuel companies that oil and gas production cannot be phased out quickly. Peter Martin, Wood Mackenzie’s chief economist, explained it another way: “the increased cost of capital has profound implications for the energy and natural resource industries”, and that higher rates “disproportionately affect renewables and nuclear power because of their high capital intensity and low returns.”
As Christophers points out, the profitability of oil and gas has generally been far higher than that of renewables and that explains why, in the 1980s and 1990s, the oil and gas majors unceremoniously shuttered their first ventures in the renewables almost as soon as they had launched them. “The same comparative calculus equally explains why the same companies are shifting to clean energy at no more than a snail’s pace today”.
Christophers quotes Shell’s CEO Wael Sawan, in response to a question about whether he considered renewables’ lower returns acceptable for his company: “I think on low carbon, let me be, I think, categorical in this. We will drive for strong returns in any business we go into. We cannot justify going for a low return. Our shareholders deserve to see us going after strong returns. If we cannot achieve the double-digit returns in a business, we need to question very hard whether we should continue in that business. Absolutely, we want to continue to go for lower and lower and lower carbon, but it has to be profitable.”
For these reasons, JP Morgan bank economists conclude that “The world needs a “reality check” on its move from fossil fuels to renewable energy, saying it may take “generations” to hit net-zero targets. JPMorgan reckons changing the world’s energy system “is a process that should be measured in decades, or generations, not years”. That’s because investment in renewable energy “currently offers subpar returns”.
The fossil fuel majors hammer this point home. The chief executive of oil producer Chevron told the Financial Times last October. “You can build scenarios, but we live in the real world, and have to allocate capital to meet real world demands.” Four out of five corporate executives considered “the ability to create acceptable returns on projects a main barrier to decarbonization of the energy system.” “We should abandon the fantasy of phasing out oil and gas and, instead, invest in them adequately reflecting realistic demand assumptions,” says Amin Nasser, chief executive of Saudi Aramco. “You can argue green all day and NGOs all day, but those are the facts. I think that message is beginning to resonate.” Liam Mallon, head of ExxonMobil’s upstream business, said.
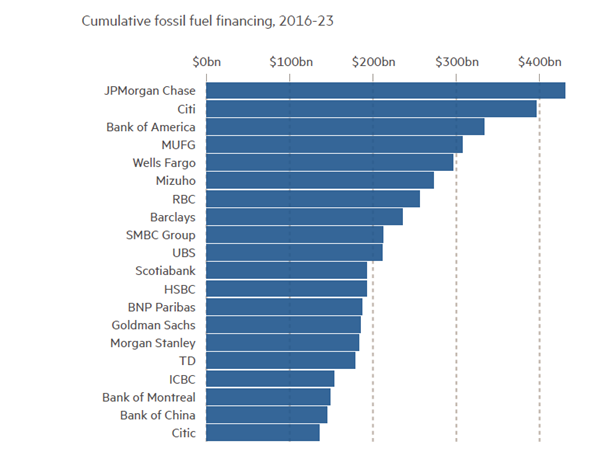
Not surprisingly we find that JPMorgan is a leading financier of fossil fuel projects. The bank underwrote $101bn of fossil fuel deals in 2021 and 2022 compared to $71bn of low-carbon deals. JPMorgan Chase, Mizuho and Bank of America were named as the biggest fossil fuel industry financers last year, in a report by climate campaigners which calculates the world’s biggest banks have provided a total $6.9tn to the sector in the eight years since the Paris climate accord.
Christophers concludes “if private capital, circulating in markets, is still failing to decarbonize global electricity generation sufficiently rapidly even with all the support it has gotten and is getting from governments, and even with technology costs having fallen as far and as fast as they have, it is surely as clear a sign as possible that capital is not designed to do the job.”
Instead, Christophers argues that if we are ever to achieve rapid reductions in carbon emissions, “extensive public ownership of renewable energy assets appears the most viable model.” I would add that must also require public ownership of the fossil fuel producers to ensure any rapid transition.
Meanwhile, the planet continues to heat up at an alarming rate.
June 19, 2024
A soft landing or curate’s egg?
Last week the World Bank issued its latest Global Economic Prospects. The WB economists reckon that the world economy “is stabilising” in 2024, the first time in three years. The world economy avoided an outright recession in 2023 that many predicted (including me – to some degree) and is now making a ‘soft landing’. Global real GDP growth will be 2.6% in 2024, the same as 2023 and will rise slightly to 2.7% next year.
The term ‘soft landing’ is somewhat odd. I suppose it means that the world economy has not crashed into the runway, but instead lightly settled down. But really, there has been no landing at all – if we mean by that a slump or contraction in real GDP globally. Anyway, to use another aphorism, the world economy is really ‘a curate’s egg’, an old-fashioned term to described something that is partly bad and partly good, or more exactly something that is obviously and entirely bad, but is described out of politeness as nonetheless having good features that might redeem it.
The reality is that, despite no overall contraction in real GDP globally, several major economies continue to stagnate at best and world growth will remain well under the pre-pandemic average rate of 3.1% – even though that global figure includes faster-growing India, Indonesia and China. As the World Bank put it: “countries that collectively account for more than 80% of the world’s population and global GDP would still be growing more slowly than they did in the decade before COVID-19.” And, worse, “one in four developing economies is expected to remain poorer than it was on the eve of the pandemic in 2019. This proportion is twice as high for countries in fragile- and conflict-affected situations.” The WB economists conclude that “the income gap between developing economies and advanced economies is set to widen in nearly half of developing economies over 2020-24.”
When we drill down to growth rates in each of the major economies, the ‘soft landing’ looks even more inappropriate as a term. Take the US economy, the best performing of the top seven capitalist economies (G7). After the ‘sugar rush’ year of recovery in 2021 following the pandemic slump of 2020, there was actually a ‘technical recession’ (i.e. two successive quarterly contractions in real GDP) in 2022. Then 2023 saw modest growth, which appeared to accelerate in the second half. However, there was a significant slowdown in the first quarter of this year, with the US economy expanding at its slowest rate since the recession of early 2022.

Looking ahead, various forecasts for the qoq increase in the current quarter (Q2 2024) are about 0.4-0.5%.
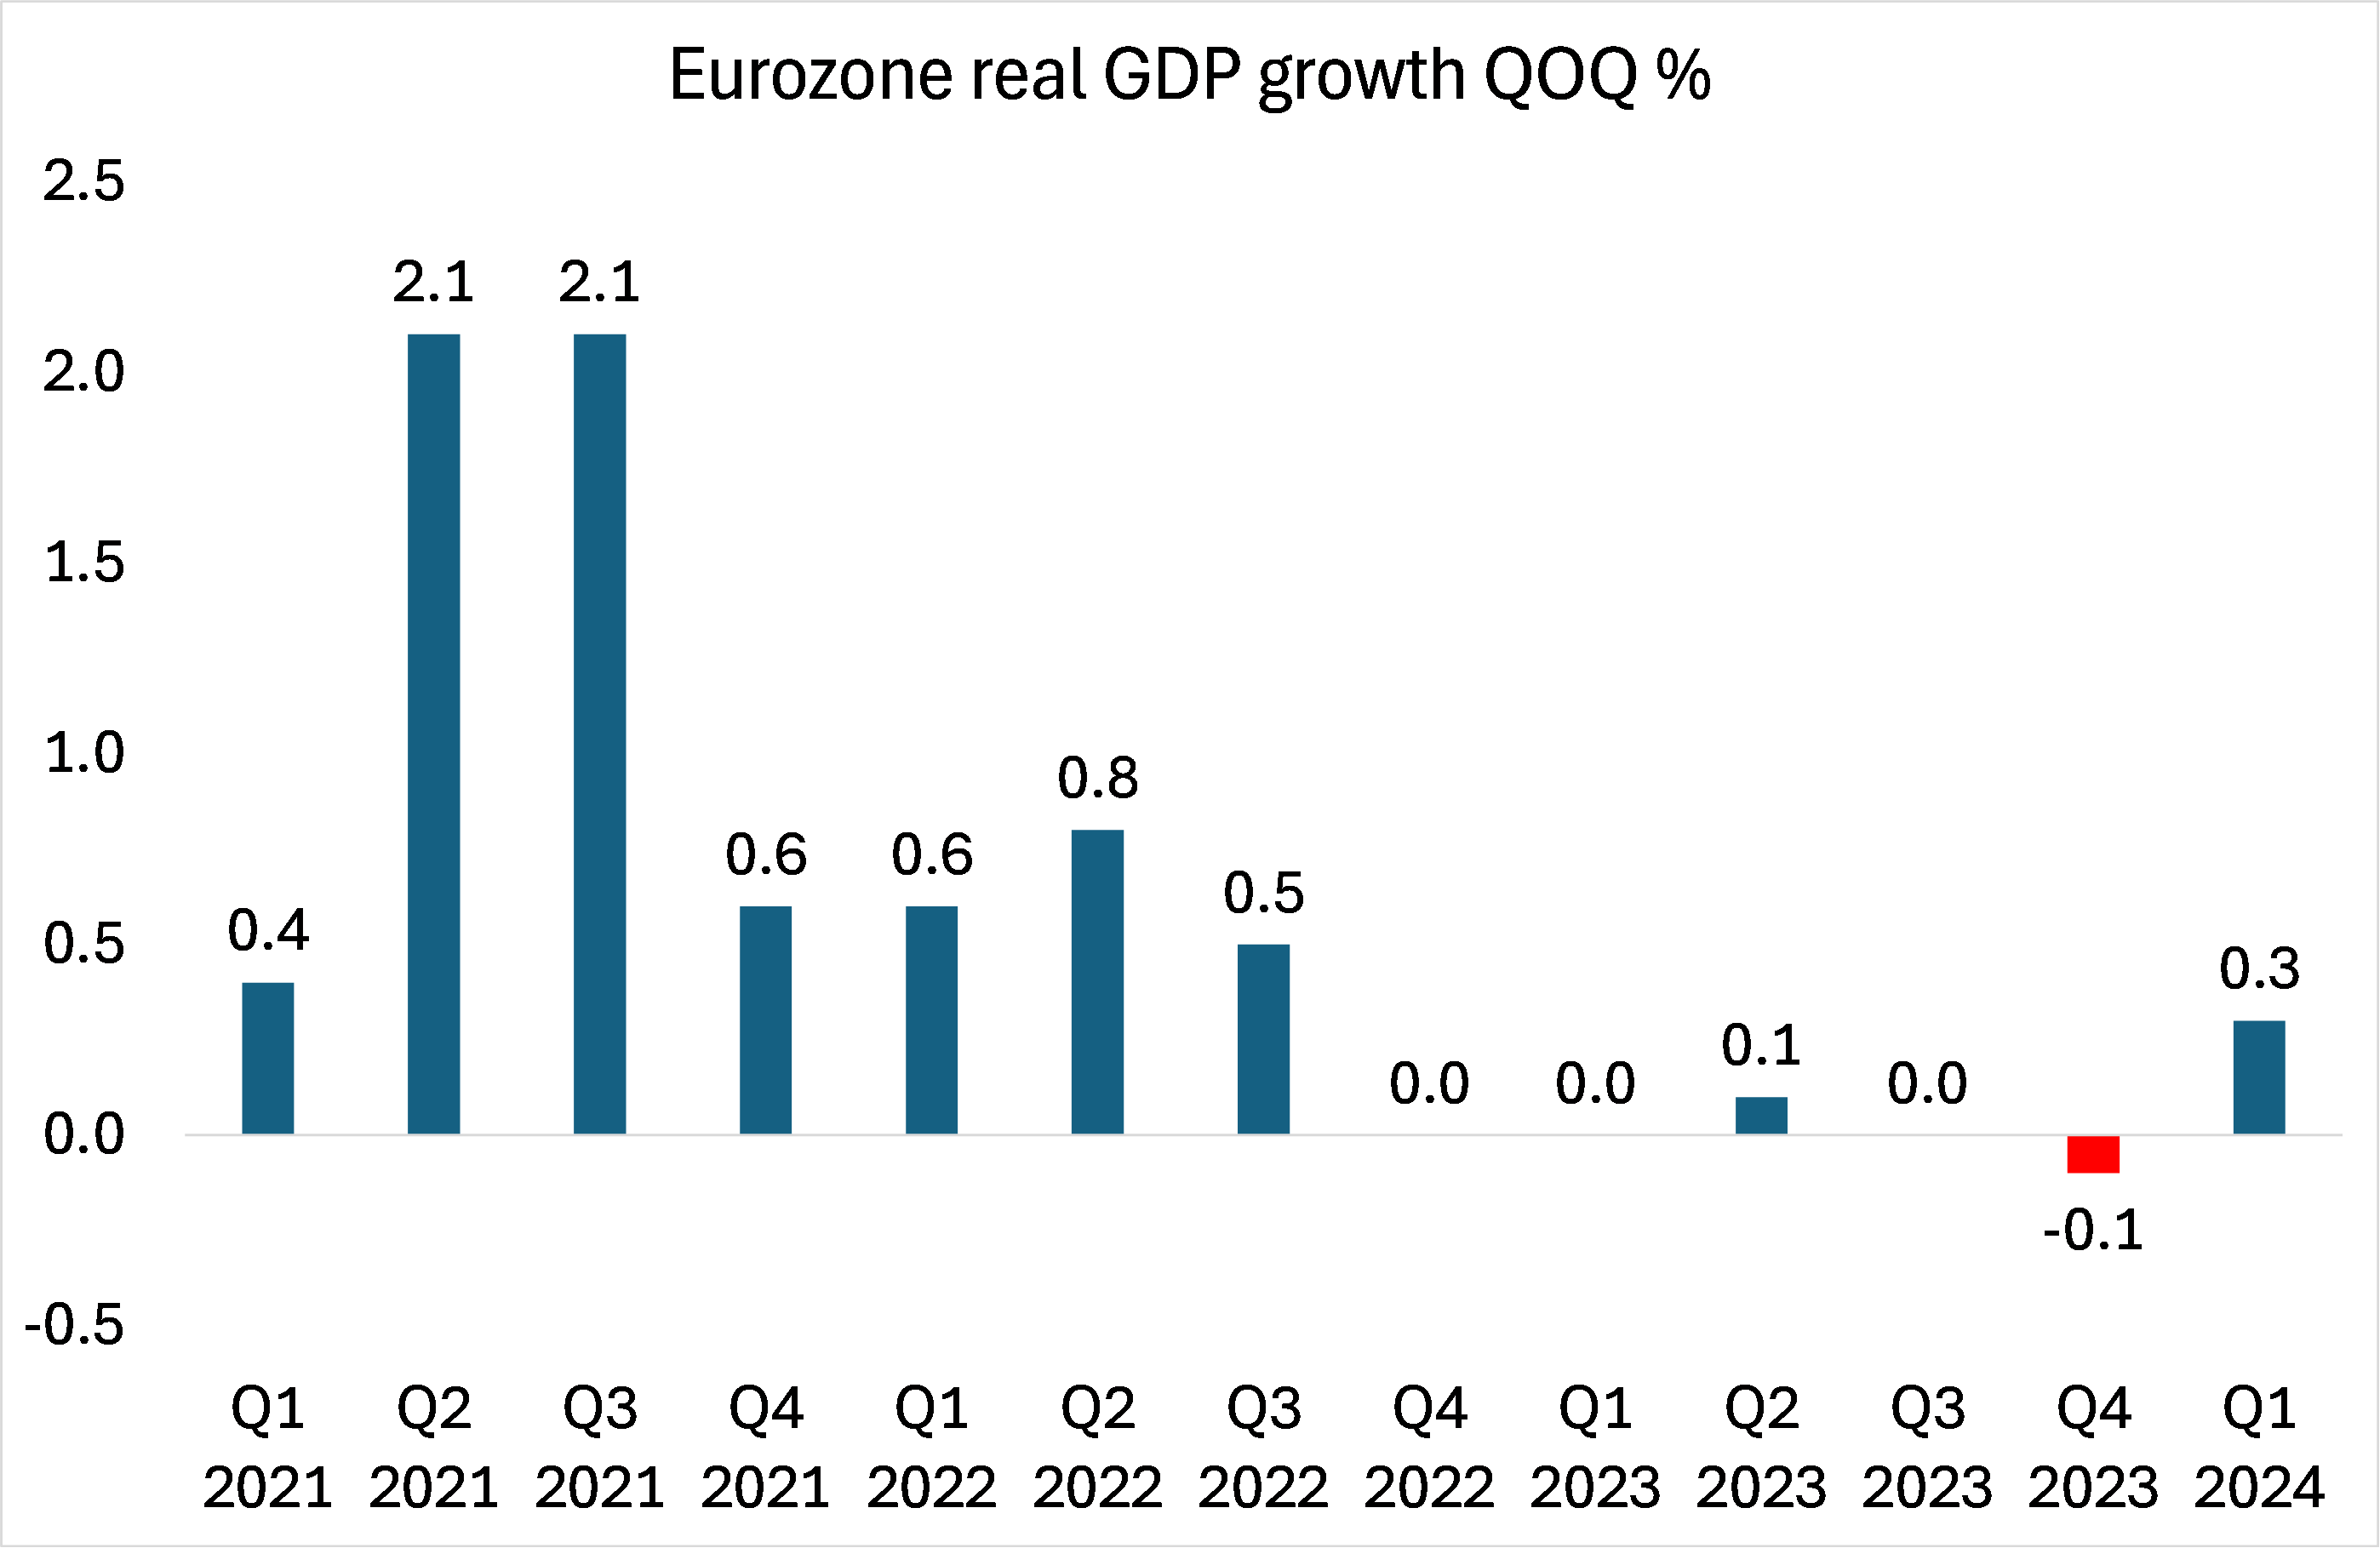
And that’s the US. Performance was much worse in the other G7 economies. The Eurozone as a whole was a total write-off in 2023.
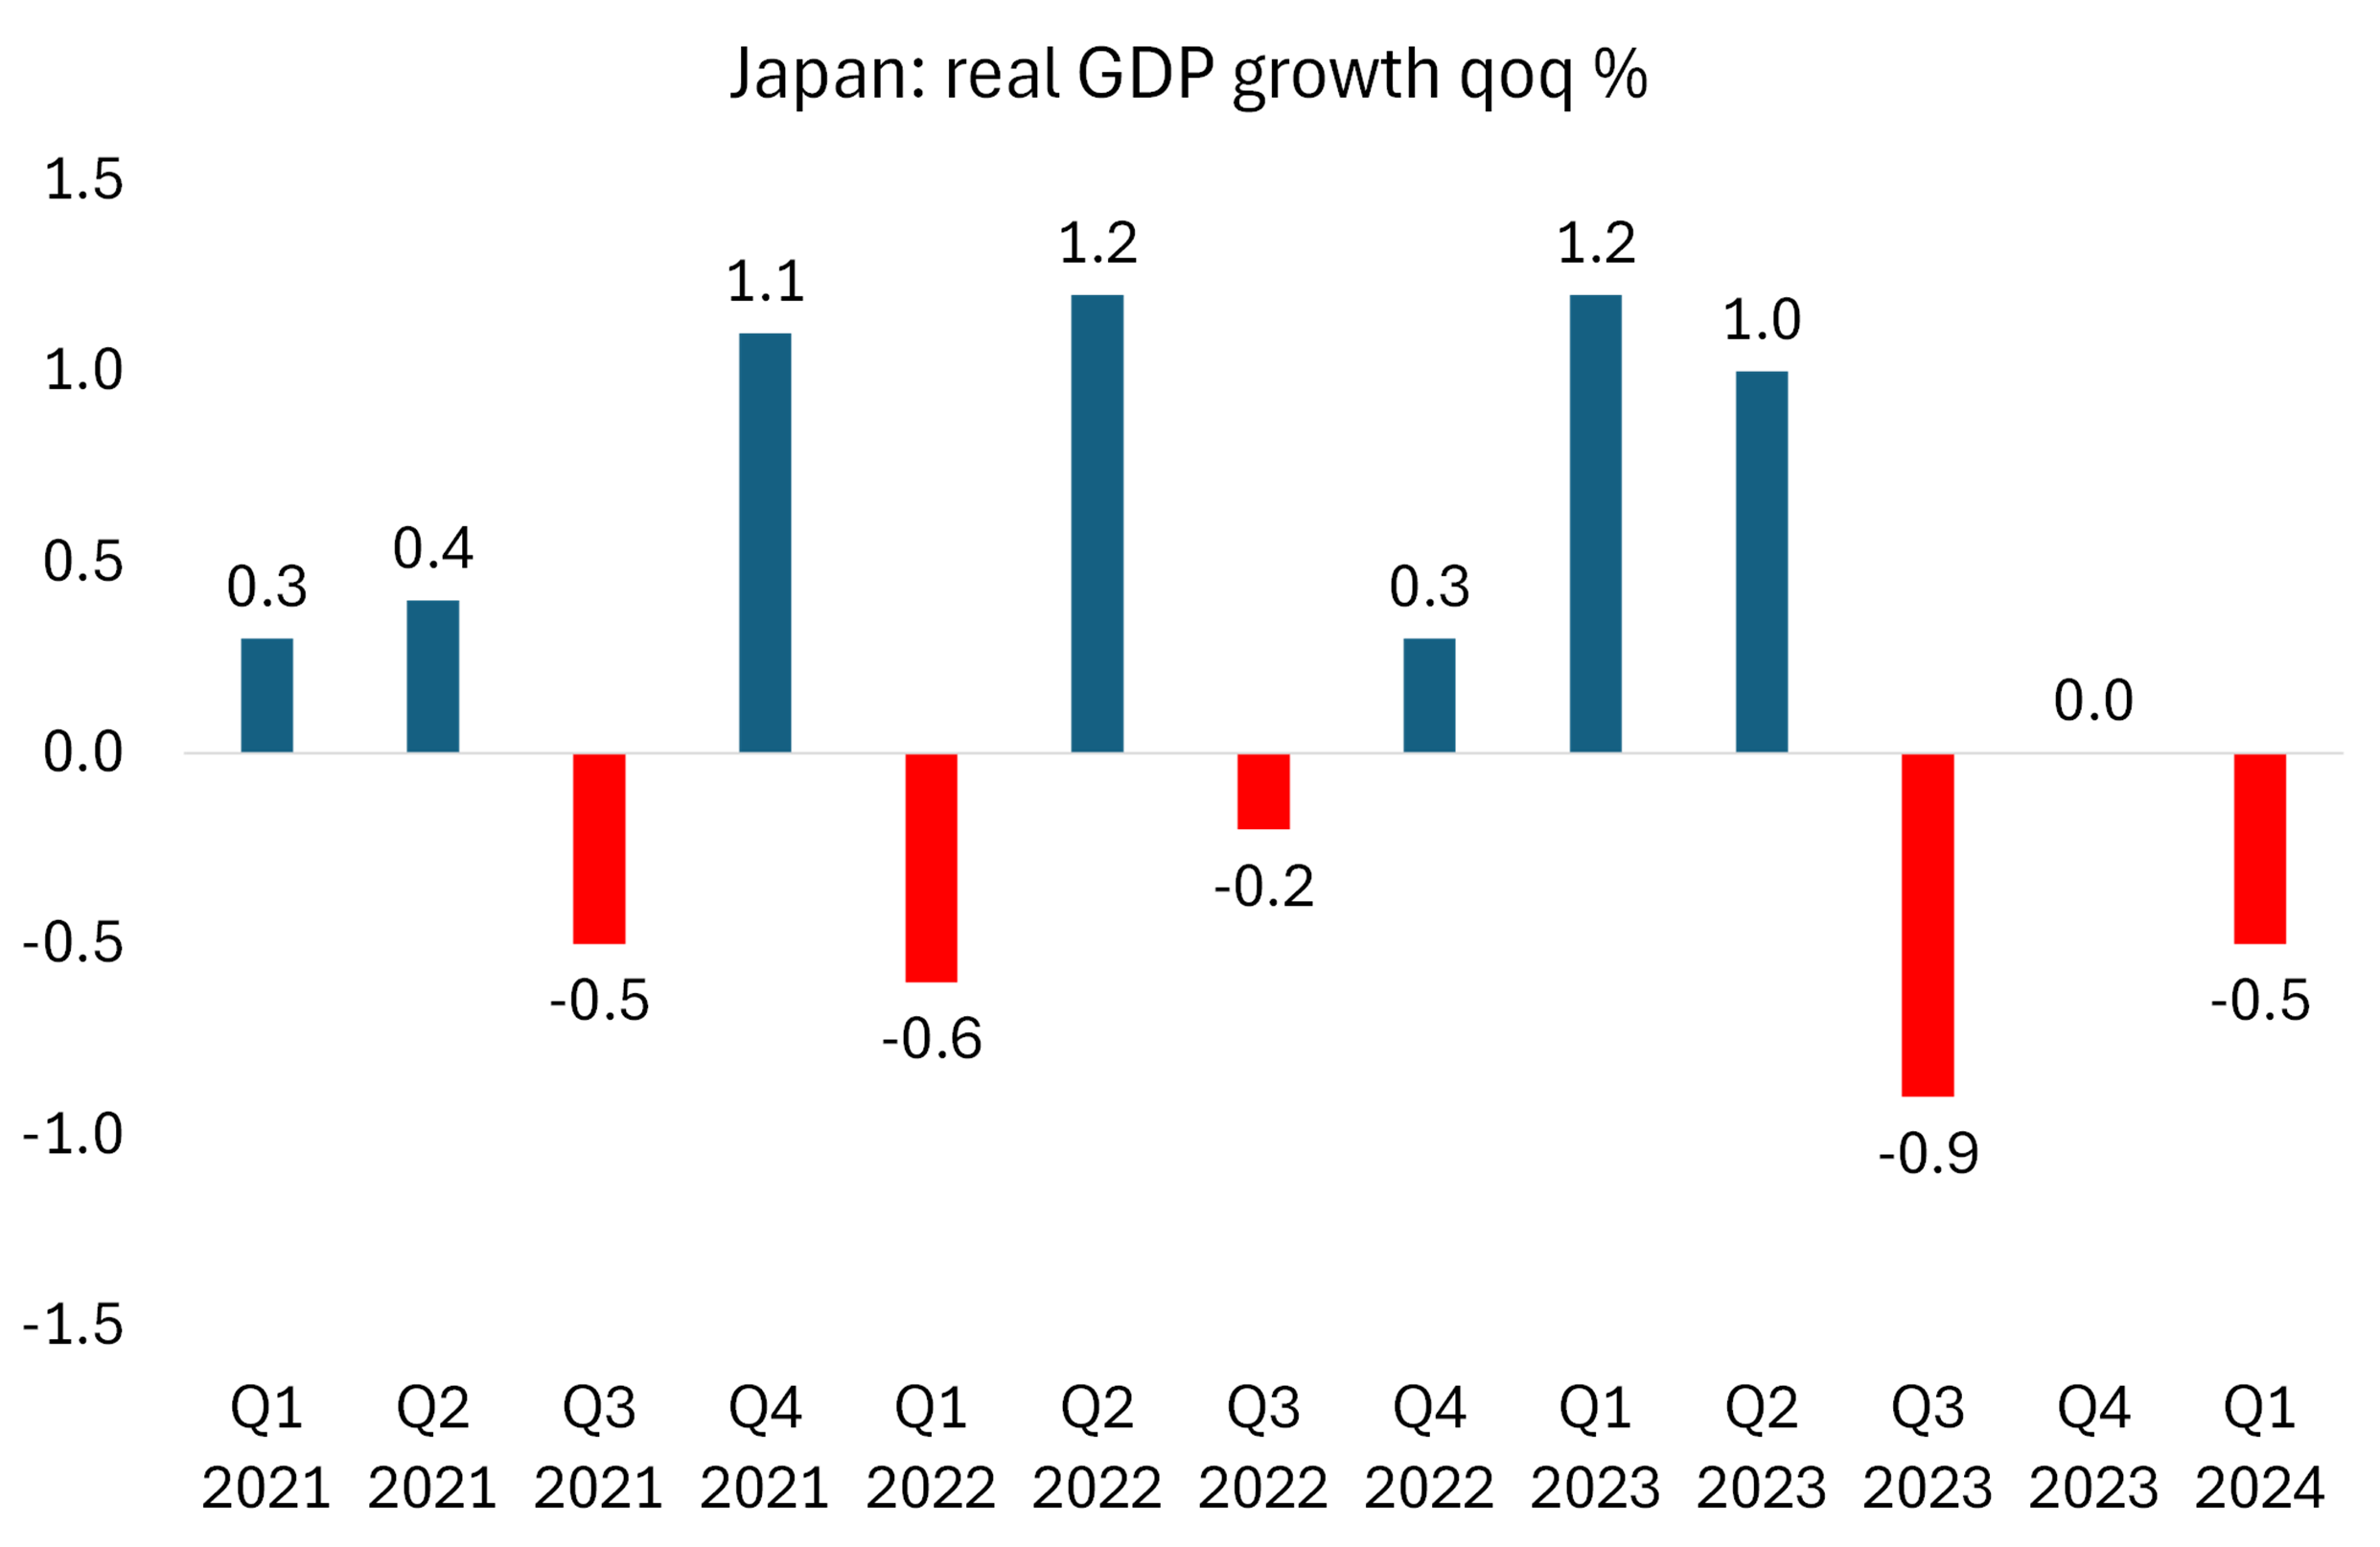
As for Japan, a ‘soft landing’ has clearly not been achieved.
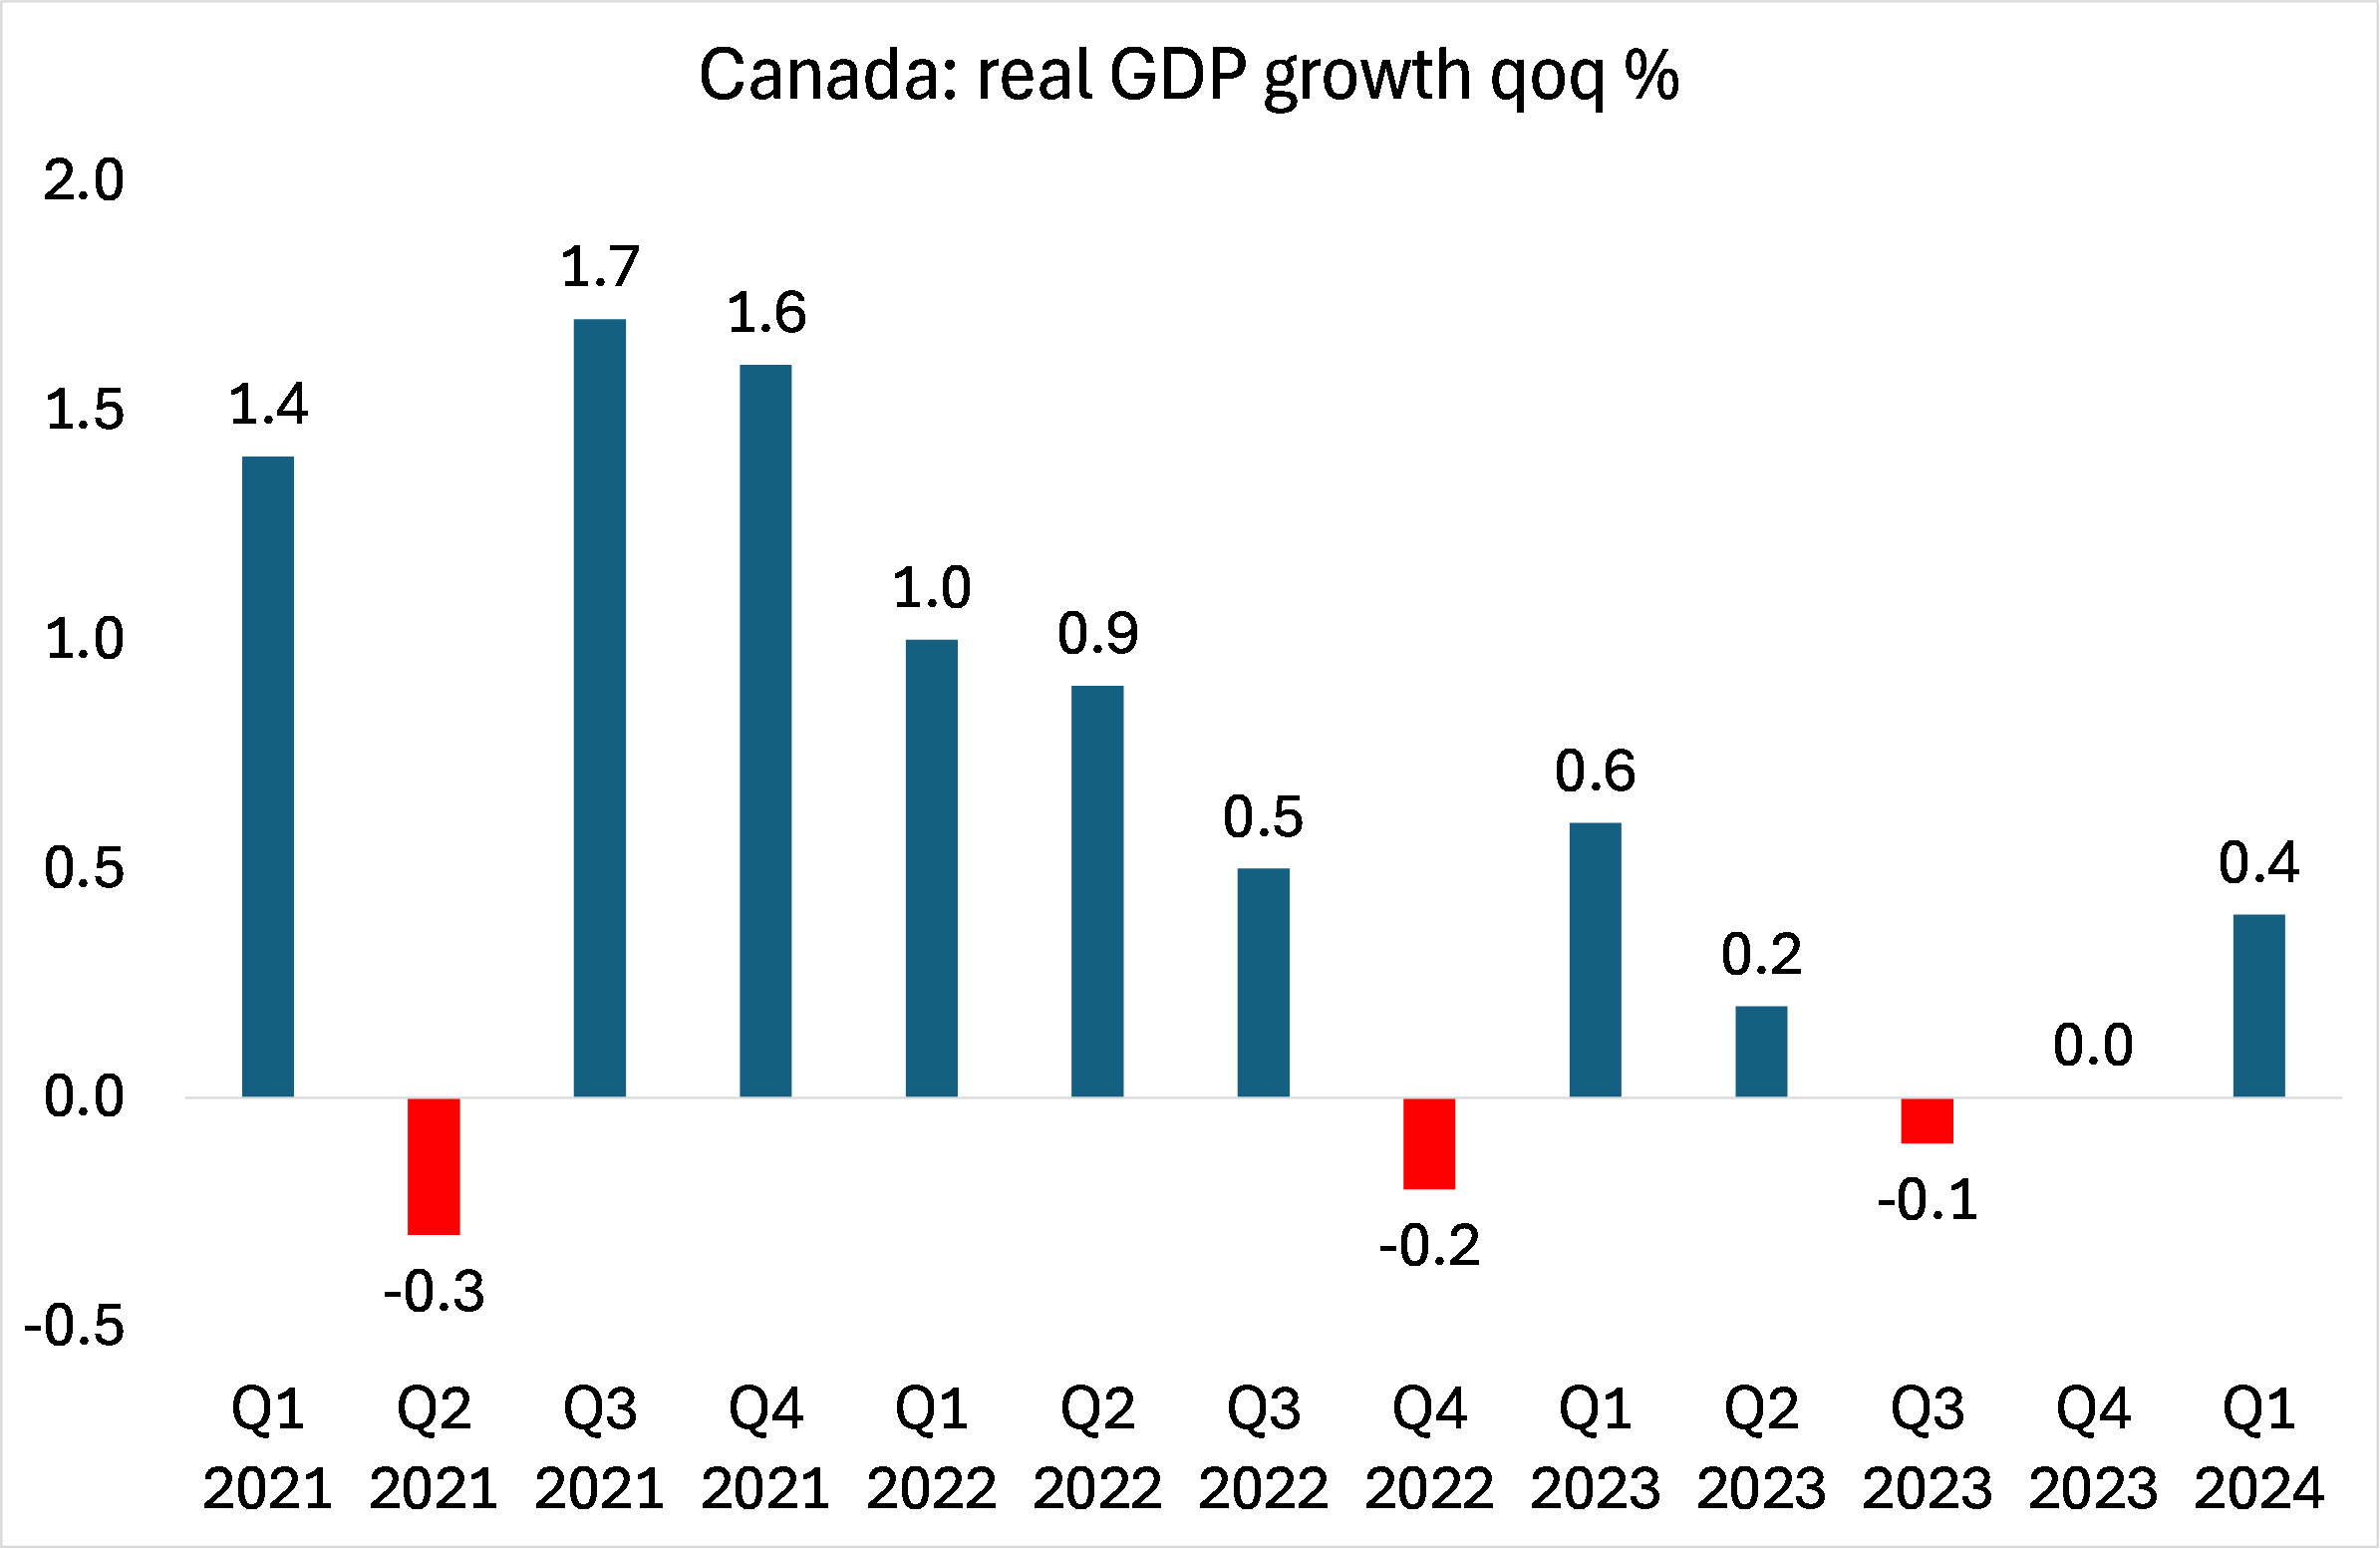
And let’s not leave out Canada, the smallest G7 economy. The economy was basically stagnant in the last half of 2023.
You find the same story in Australia, Sweden and the Netherlands. As for the British economy, it is the worst performing in the G7, rivalling even Italy.
Sure, some of the large ‘emerging’ economies are doing ok. Among the so-called BRICS, India is growing at 6% a year (if you can believe the official figures), China at 5% a year and the Russian war economy at 3% a year. But Brazil is crawling along at well under 1% while South Africa is in a slump. And many other poorer, smaller economies in the so-called Global South are in deep distress.
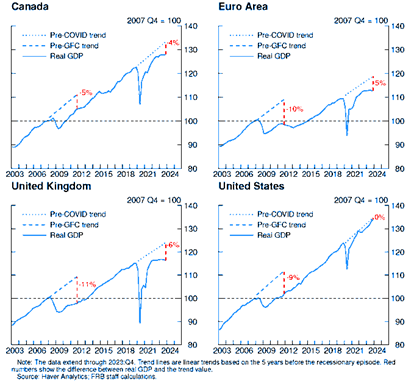
What the latest data reveal is that the major economies remain in what I have called a Long Depression, namely where after each slump or contraction (2008-9 and 2020), there follows a lower trajectory of real GDP growth – the previous trend is not restored. The trend growth rate before the global financial crash (GFC) and the Great Recession is not returned to; and the growth trajectory dropped even further after the pandemic slump of 2020. Canada is still 9% below the pre-GFC trend; the Eurozone is 15% below; the UK 17% below and even the US is still 9% below.
The world economy is now stuck in what the IMF chief Kristalina Georgieva called the ‘tepid twenties’. The World Bank economists reckon that the global economy is on track for “its worst half-decade of growth in 30 years”.
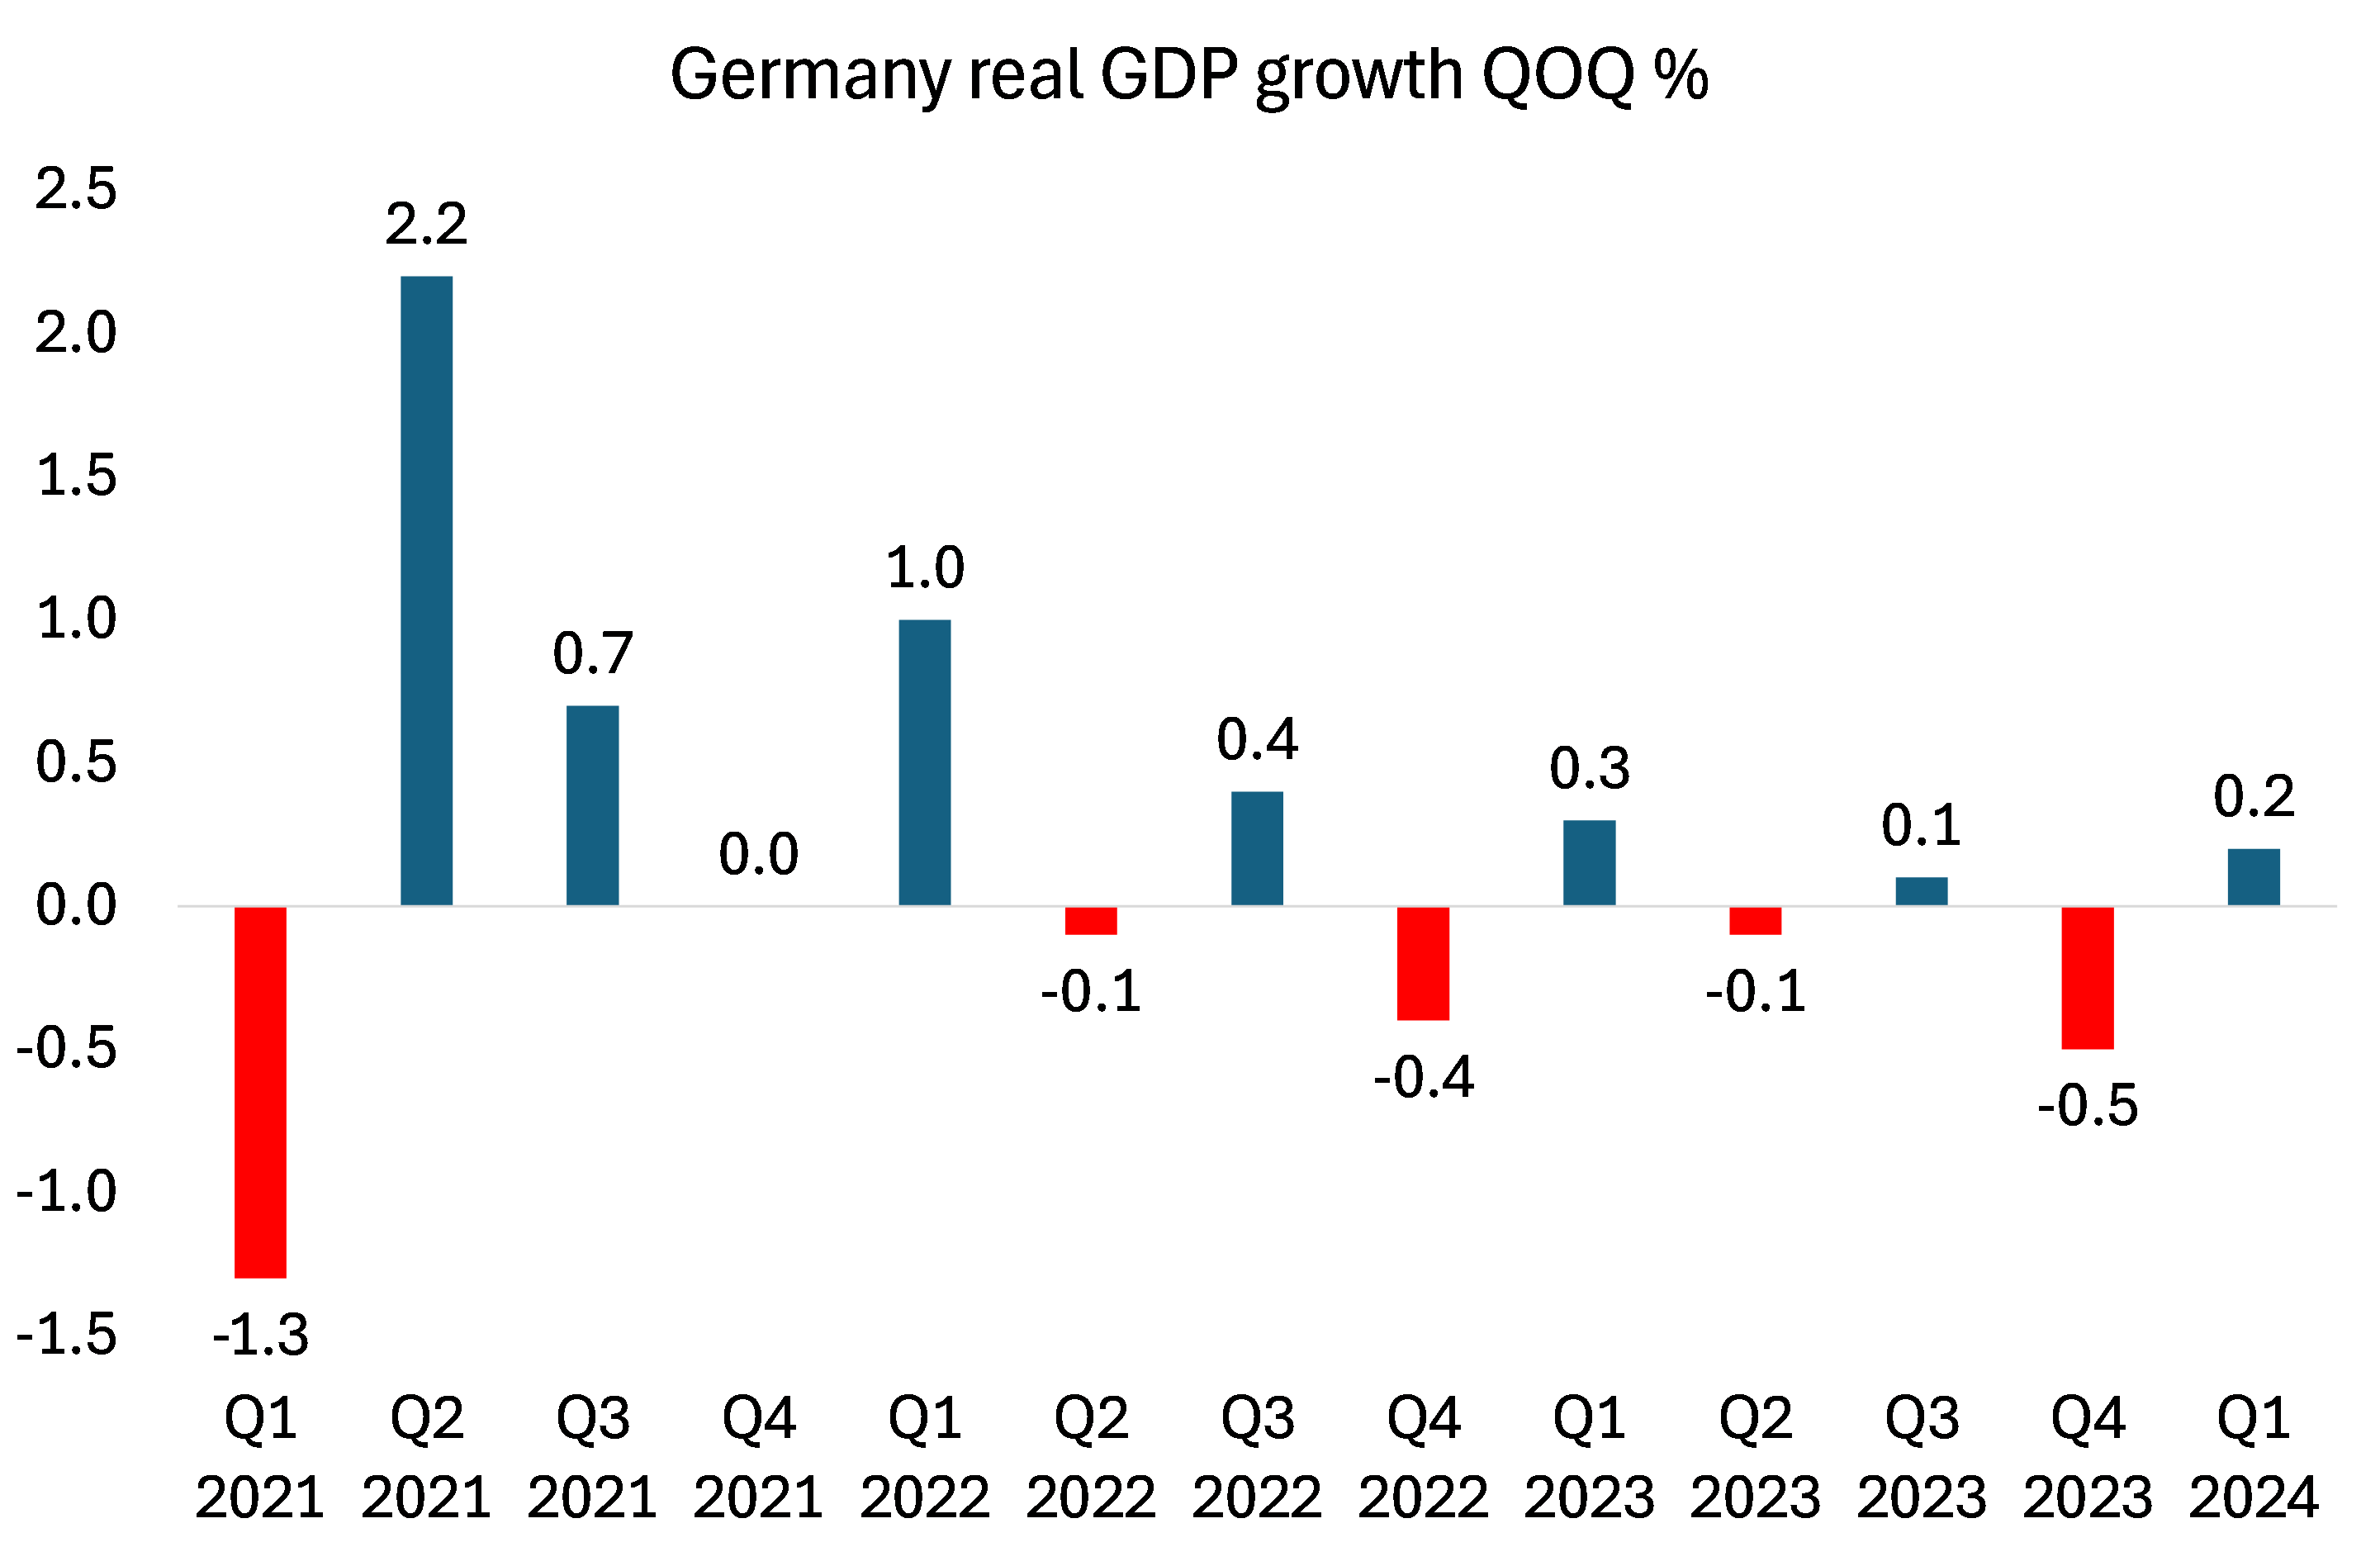
And if we drill down into the Eurozone itself, we get the full picture of the disaster of the German economy, previously the manufacturing powerhouse of Europe. Since 2021, there have been five quarters of contraction out of 12 and only one quarter higher than 1%.
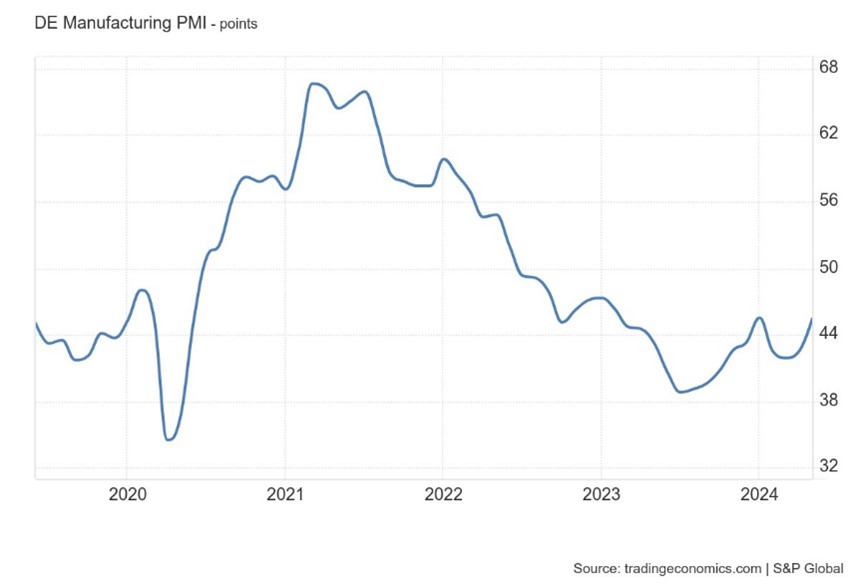
That’s a performance worse than permanently stagnant Japan. Germany’s manufacturing sector activity is not achieving a soft landing – not even a curate’s egg. It is a total car crash, nearly back to the pandemic of 2020.
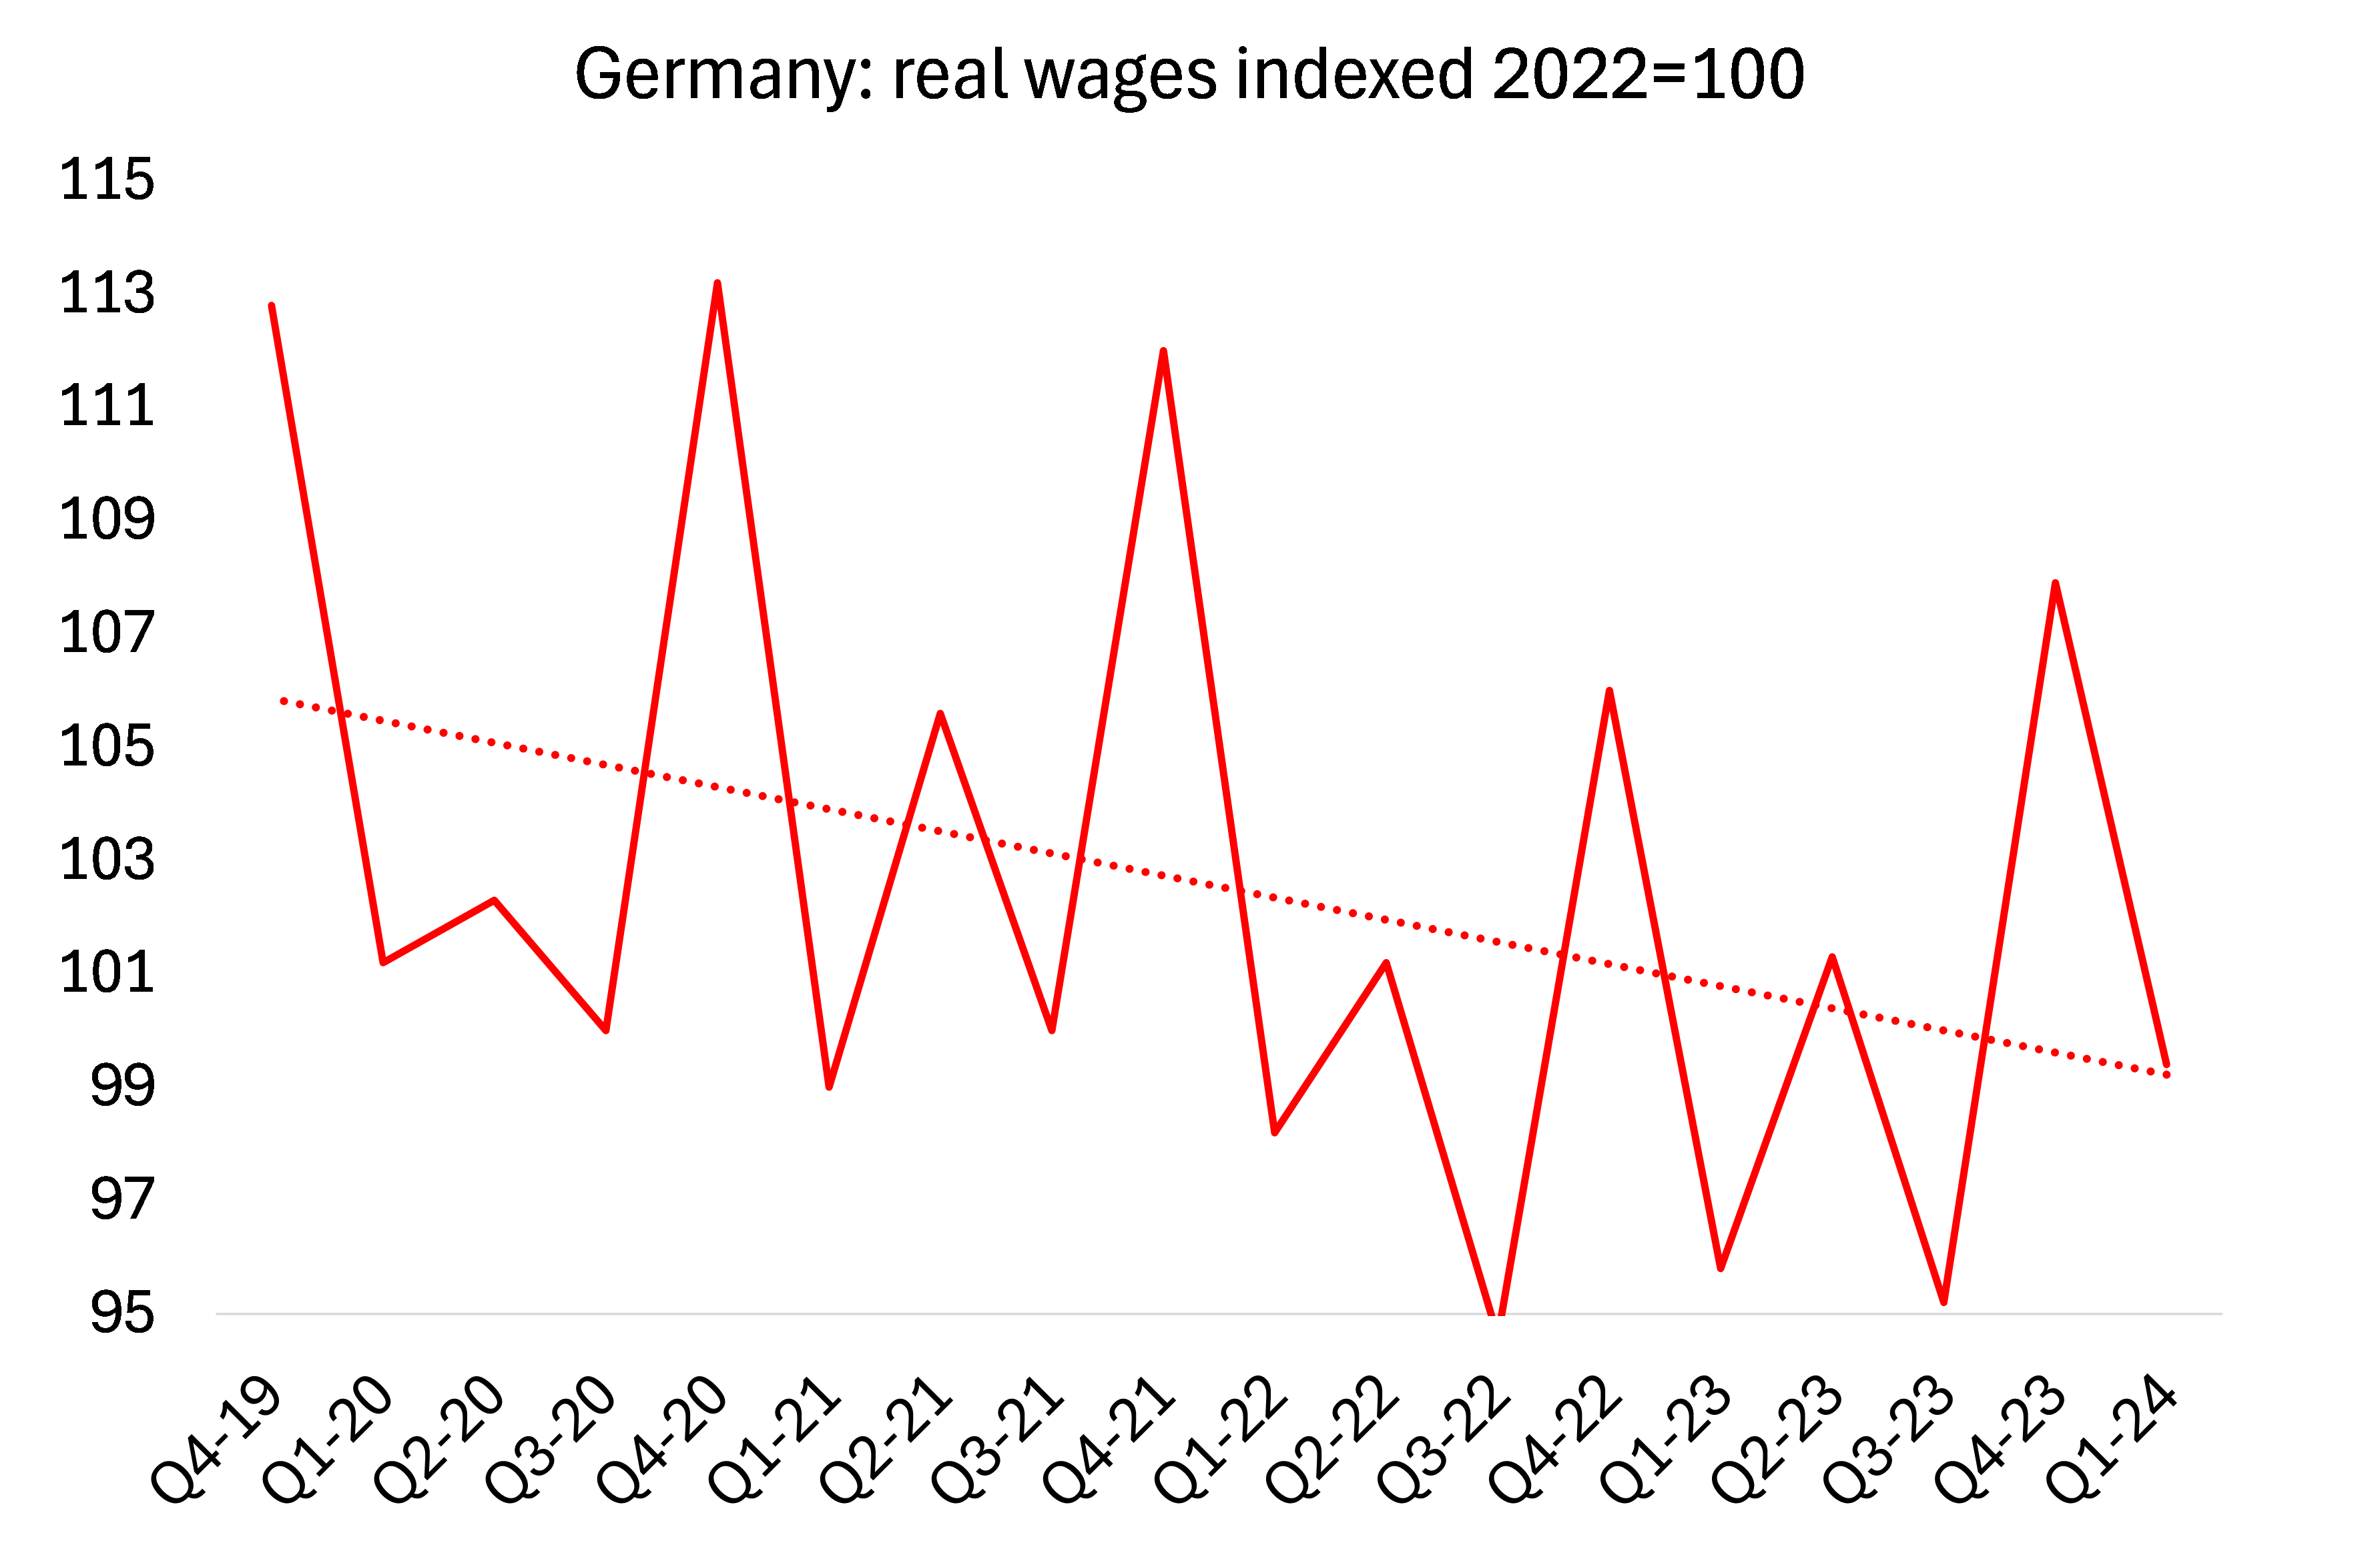
No wonder German workers’ real wages have plummeted in the last four years – down a staggering 6% since the end of the pandemic in 2020, despite a modest recovery in the last half of 2023. And no wonder that the ‘hard right’ parties in Germany have done so well in the recent EU Assembly elections.
Meanwhile inflation rates in the major economies are looking sticky. Prices have risen on average 20% since the end of the pandemic. The rate of that rise slowed through 2023. But now the rates are no longer falling, and in some countries, they are picking up again. The EZ inflation rate is still above the European Central Bank (ECB) target of 2%. Indeed, it rose in May to 2.6% yoy. Core inflation (which excludes food and energy) also rose to 2.9% yoy. Indeed, the ECB has raised its forecast for annual inflation for 2024 to 2.5% and for next year to 2.2%. It does not see its 2% inflation target being met before 2026! At the beginning of 2021, inflation was just 0.9% and it peaked at 10.6% in October 2022. That means, even if the ECB forecasts are proved right, the ECB target will have been breached for nearly five years! So much for the efficacy of central bank monetary policy.
This month, the ECB tentatively cut its interest rate by 25bp to 4.25%, the first cut since the ECB started raising rates from 0.5% in July 2022 to (supposedly) curb inflation. That’s because it is worried that the Eurozone economy cannot sustain any economic recovery while the cost of borrowing to invest or spend remains so high. In contrast, the US Federal Reserve held its policy interest-rate unchanged at its last meeting. It remains at a 23-year high of 5.5%. Again, contrary to the hopes of the Fed, US consumer price inflation has stopped falling. The Fed members now expect inflation to remain near 3% and for the 2% inflation target also not to be met before 2026!
Much is made of the low unemployment rate and net growth in jobs in the US. Officially, the US economy added 272K jobs in May 2024, the most in five months. But the unemployment rate rose to 4% in May. And all the net rise in jobs comes from part-time work. Part-time jobs rose 286k in May, but full-time jobs fell 625k. Indeed, in the last 12 months, full-time jobs have shrunk by 1.1m while part-time jobs rose 1.5m. After taking into account inflation, real weekly earnings are still some 7% below where they were four years ago and have been flat in the last year. As a result, the number of Americans doing multiple jobs hit 8.4m in May, rise of 3m since 2020. It needs two jobs to make ends meet. So the US economy is not shooting along as the mainstream pundits claim. The acceleration in growth in 2023 seems to be over.
The main reason for slowing growth in the US in the first quarter of this year was a drop-off in growth in the consumption of goods and business investment (the boom in building offices and factories is over). And there are two reasons for that. First, there has been an absolute fall in corporate profits, down $114bn in the non-financial sector. And second is the high Fed interest rate, which means the continuance of high mortgage rates for households and debt servicing costs for many weak unprofitable companies. That’s a recipe for more bankruptcies ahead.
We all read about the huge profits being made by the so-called Magnificent Seven of social media and technology behemoths. But it only these companies that are doing well. The market capitalization of 10 largest US stocks accounts for over 13% of global stock market value This is way above the Dot-com bubble peak of 9.9% in March 2000. In a blaze of unprecedented rise in stock market price, Nvidia, AI chip company has become the most highly valued in the world, surpassing Apple and Microsoft.

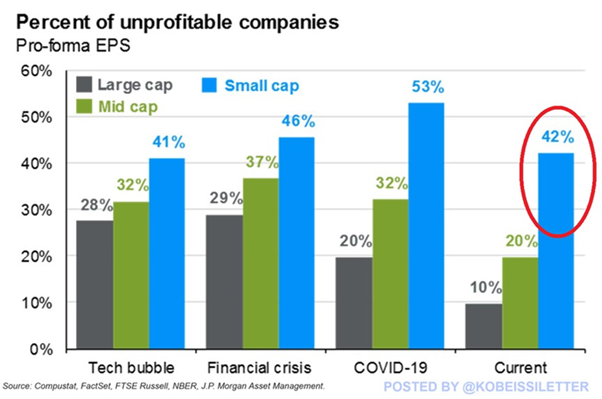
In contrast, 42% of US small-cap companies are unprofitable, the most since the 2020 pandemic when 53% of small caps were losing money. Small-cap companies are struggling.
There is no escape for stagnant domestic economies through increased trade. Global trade has been floundering for years and suffered a sharp downturn during the pandemic slump. World trade actually contracted in 2023.
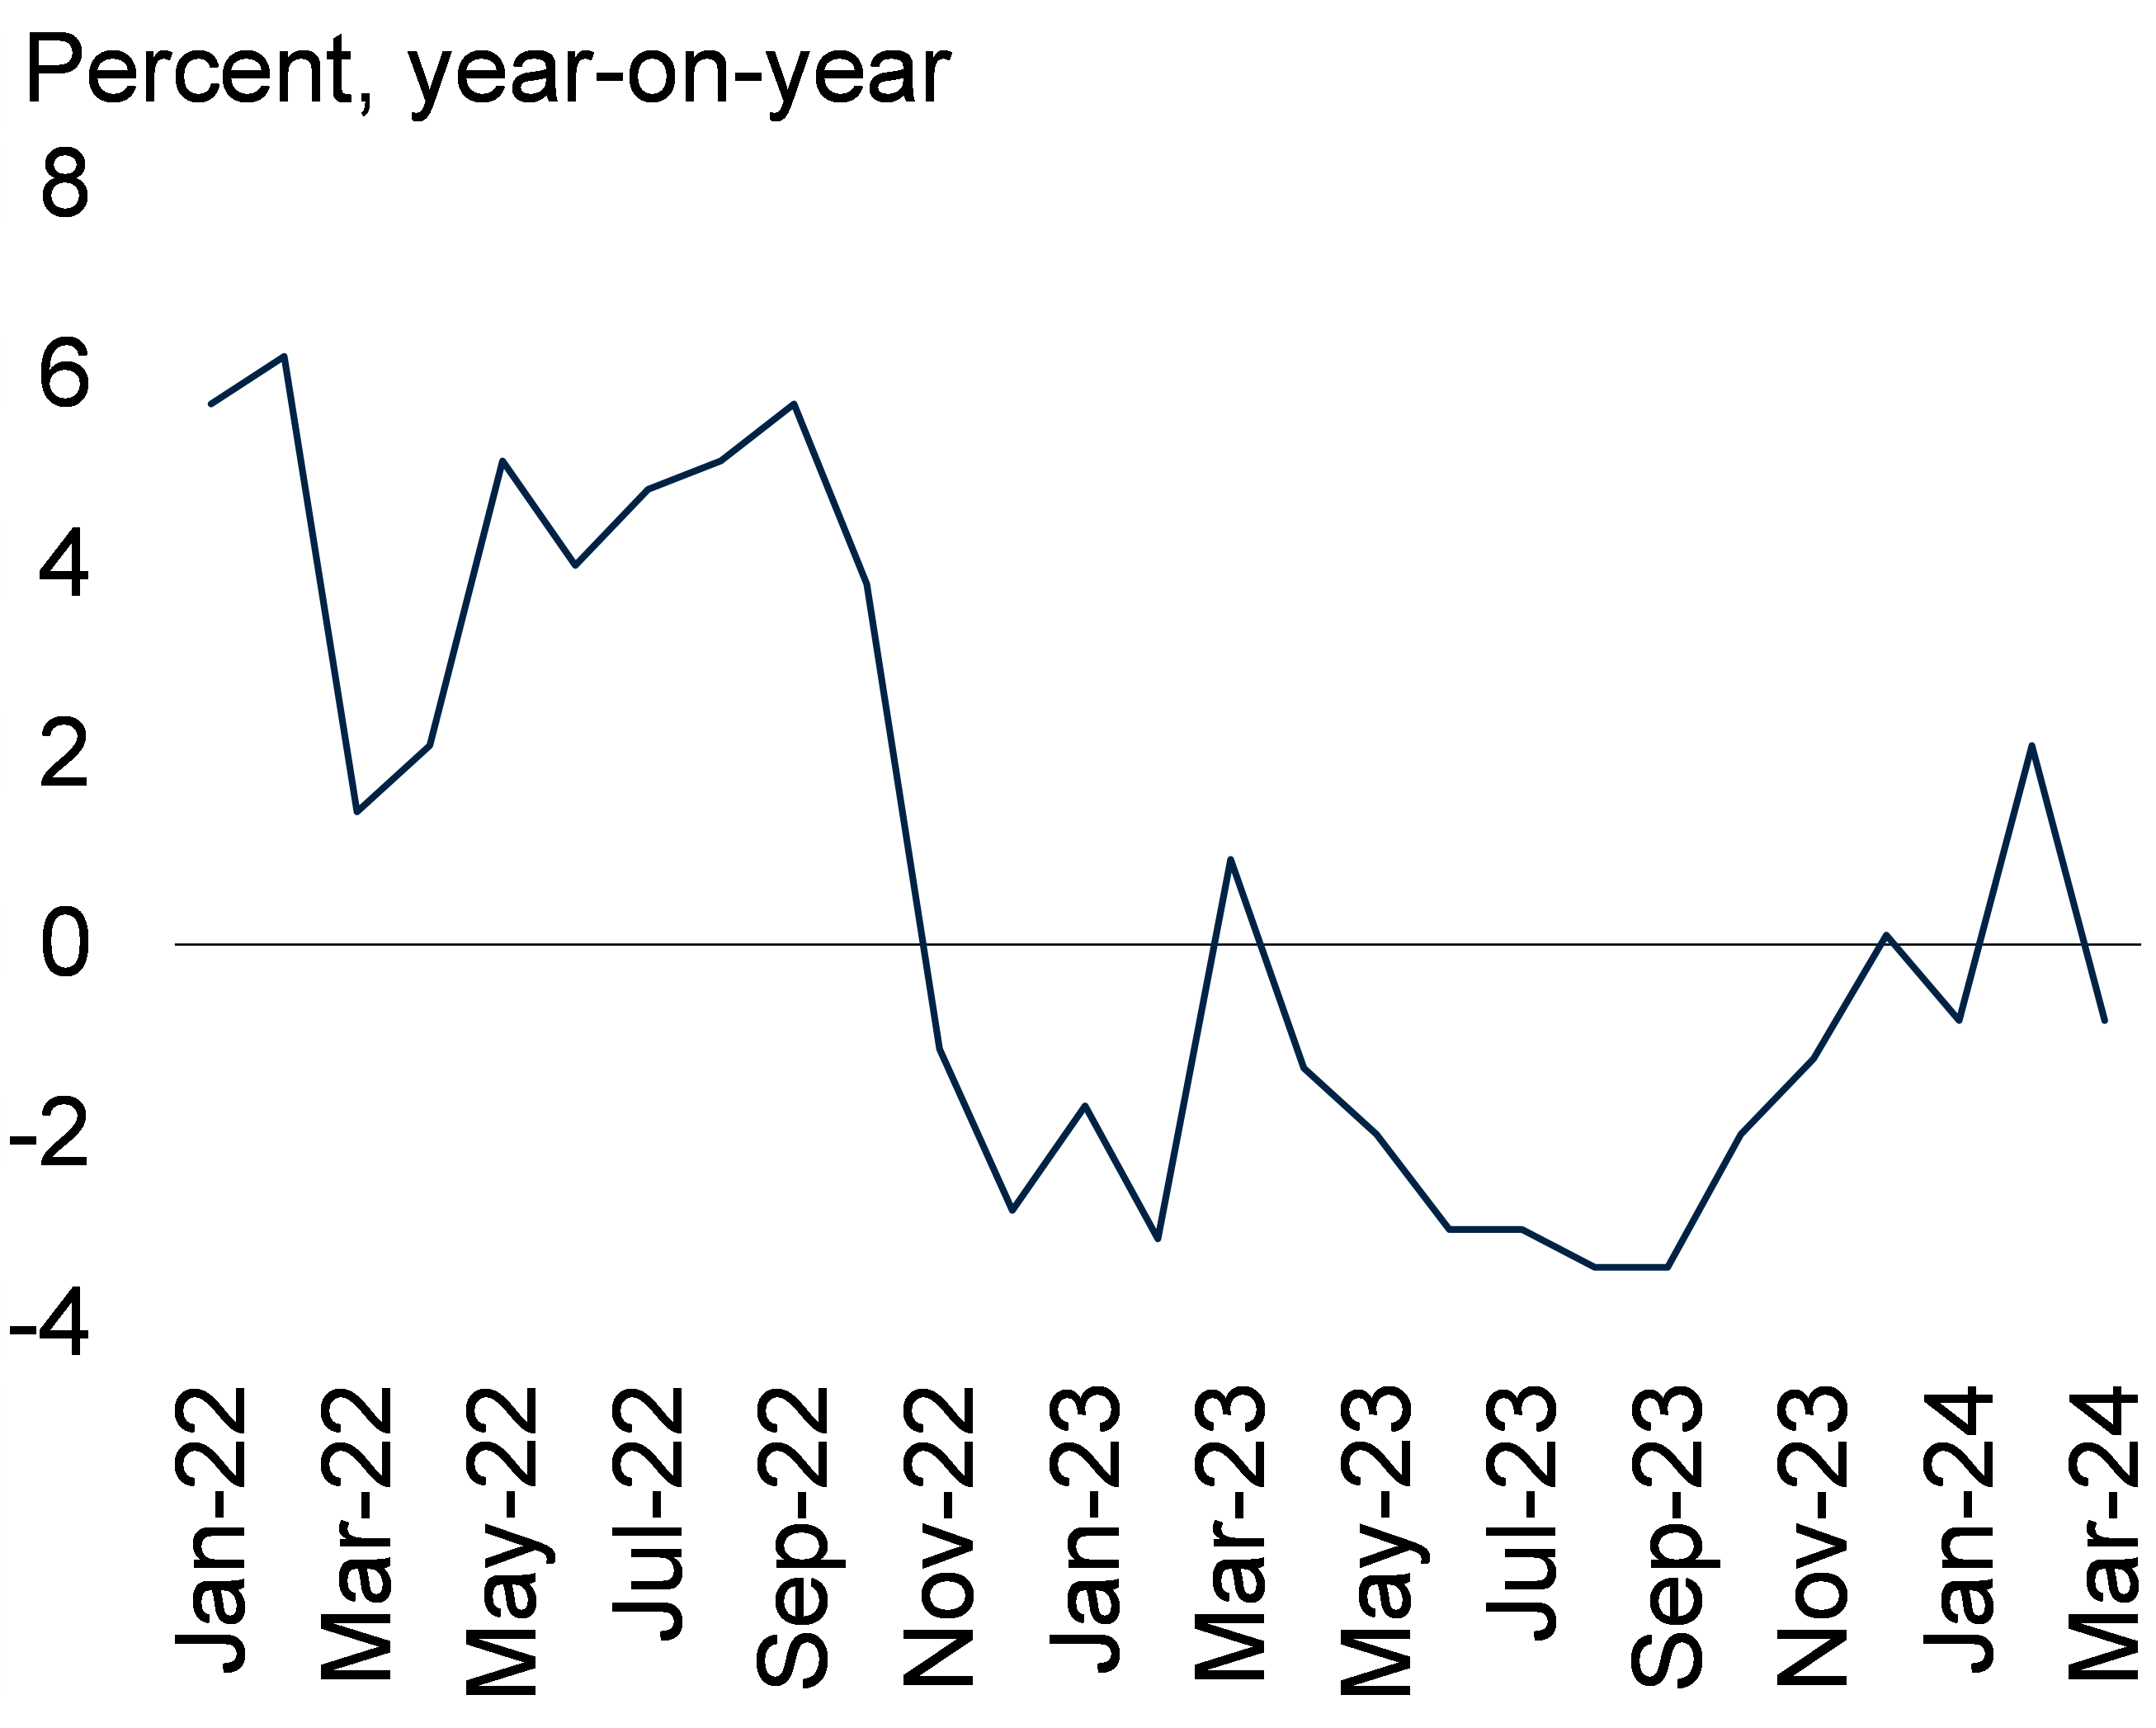
Source: CPD
Again, no wonder the US and its allies have launched at attack on China’s export success by imposing tariffs and other sanctions on Chinese goods. To combat that, China has switched (been forced?) into other markets rather than the US and Europe.

But the great tariff war has hardly started. Recent measures by Biden are going to be ‘trumped’ in 2025 if ‘the Donald’ is re-elected this year. Trump plans to impose a 10 per cent levy on all US imports and a 60 per cent tax on goods coming from China. The tariffs will fund his plans to extend a series of tax cuts, which he introduced while president in 2017, beyond 2025. Indeed, Trump is talking of imposing tariffs sufficiently high to allow him to end income tax altogether!
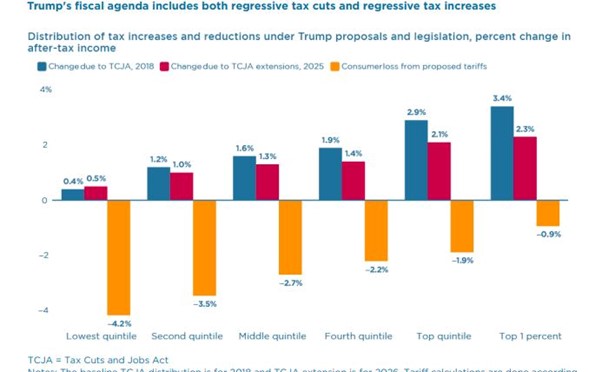
A recent study suggests that Trump’s policies are “sharply regressive tax policy changes, shifting tax burdens away from the well-off and towards lower-income members of society”. The paper, by Kim Clausing and Mary Lovely, puts the cost of existing levies plus Trump’s tariff plans for his second term at 1.8 per cent of GDP. It warns that this estimate “does not consider further damage from America’s trading partners retaliating and other side effects such as lost competitiveness.”
This calculation “implies that the costs from Trump’s proposed new tariffs will be nearly five times those caused by the Trump tariff shocks through late 2019, generating additional costs to consumers from this channel alone of about $500bn per year,” the paper said. The average hit to a middle-income household would be $1,700 a year. The poorest 50 per cent of households, who tend to spend a bigger proportion of their earnings, will see their disposable income dented by an average of 3.5 per cent.
Mainstream economists continue to claim that the major economies have achieved a ‘soft landing’ and things are now on an even keel. But a recent survey found that 56% of Americans thought the US was in a recession and 72% thought inflation was rising. Economists like Paul Krugman reckon European and American households seem to be ‘out of touch’. But who is really out of touch? American households or the expert economists?
June 9, 2024
EU elections: last chance saloon for unity?
Elections for the European Assembly or European Union (EU) parliament finish today. Citizens in 27 member states of the EU are voting for 720 members of the Assembly. Current opinion polls suggest that the two main ‘centrist’ groups of members (the centre-left Progressive Alliance of Socialists and Democrats and the centre-right European People’s Party) will lose more ground to those on the left or right of the centre; but particularly the so-called ‘hard right’ parties in the EU.
These right parties generally oppose immigration, further EU integration economically and politically, an end to ‘green’ policies and are reluctant to support the EU leaders’ foreign policy of backing the US and NATO over the war in Ukraine. The ‘hard right’ is split on many of these issues but they are still set to gain votes because of weak European economic expansion, particularly since the end of COVID pandemic slump, that has sent living standards down due to high price inflation, stagnant output and declining exports and investment.
The ’European’ economy (if we can consider it as one regional unit) has been in serious trouble. After each global economic crisis (2008-9 Great Recession and the 2020 pandemic slump), the economy has struggled to recover, failing to return to its previous (weakening) trajectory of growth, worse compared to the US.

Indeed, the economic story for Europe since it formed its various political and economic entities (Common Market, European Union, Eurozone) has been one of relative decline in the 21st century. Back in the 1980s, Europe contributed 25% of world GDP, while growing at about 2% a year. In the 2020s, Europe’ share of world GDP had dropped to under 15% with growth barely 1% a year.

Indeed, in 2023, the key core countries like France and Germany were in outright recession after two years of accelerating inflation driven by high energy prices, as cheap Russian gas and oil was ditched (as part of the sanctions against Russia) in favour of expensive liquid gas imported from the US and elsewhere. As a result, Europe’s manufacturing sector has been contracting for the last two years (in the graph below 50 means contraction).

Investment growth has been very weak (and non-existent in the productive sectors like manufacturing).

There are still large disparities between the rich core of Europe and the poorest EU states, ie those in Eastern Europe that joined after the collapse of the Soviet Union and gained accession in 2004 and those in the southern parts of the region. However, relative stagnation in core Europe, particularly in recent years, has meant that the new 2004 members have closed the gap somewhat in living standards with the core.
In 2004, 75 million people across ten accession countries became citizens of the EU. Between 2004 and 2019, the GDP per capita of these countries almost doubled. According to the World Bank, based on its PPP measure, eight of the ten countries that joined the EU in 2004 were in the middle-income group in 2004 (except for Cyprus and Malta) and are now in the high-income group. One study reckons that almost a third of their current level of standard of living can be attributed to their accession to the EU (the opening-up of trade, easy movement of labour and capital flows as well as EU social funding). That contributed about half of the increase in GDP per capita between 2004 and 2019.
But to some extent, this ‘convergence’ (experienced by all new EU entrants in the past) is an illusion. Faster per capita real GDP growth over the core has been achieved mostly by falling populations, not by faster national output growth. People in the poor Eastern European states emigrated to the western states for work, just as people in the southern states of Spain, Italy, Portugal and Greece had done in the past. They sent money back and so GDP per person rose.

Indeed, one big issue for Europe is the likely decline in population (particularly the working age population) as fertility rates fall. There are five countries in the world where the workforce is projected to grow by more than 10 per cent over the next 35 years. They are Ireland, Australia, the US, Canada and Norway. Two other countries, the UK and Sweden, are projected to have increases of between 5 and 10 per cent. Every other developed country should expect their working populations to fall. In Japan, it is falling already and is projected to decline by 35 per cent by 2050.
Germany faces a decline of nearly 30 per cent; Portugal, Italy and Greece by more than 20 per cent. The top ten countries with the fastest shrinking populations are all in Eastern Europe according to UN projections. Bulgaria, Latvia, Moldova, Ukraine, Croatia, Lithuania, Romania, Serbia, Poland, Hungary, are estimated to see their population shrink by 15% or more by 2050. For Ukraine, that forecast has increased.
Bulgaria is the world’s fastest shrinking country, with its population is expected to drop from 7 million in 2017 to 5.4 million in 2050. In Latvia, the population is estimated to drop from 1.9 million in 2017 to 1.5 million, whilst in Moldova, the population is estimated to shrink from 4 million to 3.2 million.
Europe needs to compensate for this demographic deficit with a significant rise in productivity. But Europe’s productivity levels (however, generously you measure it) remain 25% below that of the US, which has also experienced a slowdown in its productivity growth since the 1990s.

At the moment, many countries are reliant on a series of EU support schemes and exemptions that aim at softening the financial blow of the Covid-19 pandemic, including the Recovery and Resilience Facility (RRF), which saw EU countries issue joint debt for the first time. They are still providing a lifeline to countries with the most debt. The EU is pouring billions of euros into green and digital projects through this dedicated fund — worth over €700 billion. But this is set to run out at the end of 2026 and Germany and France are split over whether to maintain EU public spending and subsidies to sustain growth at the expense of rising deficits and debt; or cut back to meet previous EU budget targets.
One area where spending limits will not be imposed is defence. The message of the centrist party governments of northern Europe is that NATO and the US must be backed in its war with Russia over the invasion of Ukraine. Finland and Sweden, previously ‘neutral’ on NATO, have now joined, claiming a Russian threat to ‘European democracy’. Europe’s leaders’ message to its citizens is to ‘prepare for war.’ Military spending is up 7% this year with a target of 2% of GDP by each NATO member. That will eat into civil spending over the rest of this next EU parliament.
Europe’s capitalist sector is deeply worried. They fear being squeezed between the US and China in their intensifying geopolitical war, with exports to China, a previously big market, falling away while investment in China is reversed under US instructions. Already the war in Ukraine has badly hit European industry and increased costs across the board.
The profitability of capital in the core of Europe has slumped badly since the end of the Great Recession and through the Long Depression of the 2020s and with no recovery after the pandemic slump of 2020. France’s profitability is down over 30%, Germany’s over 25%.
Source: AMECO database
Even the new member states in the east (excepting Poland) have seen profitability falling.

Source: AMECO database
Europe’s relative decline economically and politically looks set to continue through this next EU Assembly period, and with increasing division and conflict in the Assembly and among member states on what direction to take. Voter turnout in Assembly elections is low: 42-51% in the last four votes. Interestingly, those Eastern European states that have gained most economically (at least for the business sector) have the lowest polling ratios (all well below 40%).
That does not mean that the EU is heading for a break-up. There is still strong support among Europe’s citizens for the idea of a ‘united Europe’, although support has fallen back since the pandemic and the subsequent inflationary spiral.

Throughout the Long Depression of the 2010s after the global financial crisis and the Euro debt crisis, not surprisingly, a majority of Europe’s citizens reckoned the economy was in bad way. Now surveys show that sentiment is about 50:50. It is generally people who consider themselves on the left that show the greatest support for the continuance of the EU. But a majority of those who consider themselves right wing are also in favour – even where there are EU-sceptic governments like Hungary or Slovakia. It is only in France and the UK that a majority of right-wing voters want to leave the EU. The UK left in 2020, with dire results for the UK economy and households.
However, if Europe’s economies continue to lose ground and European capital is increasingly squeezed by the global power battle between the US and China, that majority support for the EU idea may dissipate by the time of the next EU Assembly.
June 6, 2024
AI again
About this time last year, I tackled the subject of artificial intelligence (AI) and the impact of the new generalised intelligence language learning models (LLMs) like ChatGPT etc.
In that post I mainly dealt with the impact on jobs for workers being replaced by AI LLMs and the corresponding effect on boosting the productivity of labour. The standard forecast on AI came from the economists at Goldman Sachs, the major investment bank. They reckoned if the technology lived up to its promise, it would bring “significant disruption” to the labour market, exposing the equivalent of 300m full-time workers across the major economies to automation of their jobs. Lawyers and administrative staff would be among those at greatest risk of becoming redundant (and probably economists!). They calculated that roughly two-thirds of jobs in the US and Europe are exposed to some degree of AI automation, based on data on the tasks typically performed in thousands of occupations.
Most people would see less than half of their workload automated and would probably continue in their jobs, with some of their time freed up for more productive activities. In the US, this would apply to 63% of the workforce, they calculated. A further 30% working in physical or outdoor jobs would be unaffected, although their work might be susceptible to other forms of automation.

But Goldman Sachs economists were very optimistic and euphoric for the productivity gains that AI could achieve, possibly taking capitalist economies out of the relative stagnation of the last 15-20 years – the Long Depression. GS claimed that ‘generative’ AI systems such as ChatGPT could spark a productivity boom that would eventually raise annual global GDP by 7% over a decade. If corporate investment in AI continued to grow at a similar pace to software investment in the 1990s, US AI investment alone could approach 1% of US GDP by 2030.

But US technology economist Daren Acemoglu was sceptical then. He argued that not all automation technologies actually raise the productivity of labour. That’s because companies mainly introduce automation in areas that may boost profitability, like marketing, accounting or fossil fuel technology, but not raise productivity for the economy as a whole or meet social needs.
Now in a new paper, Acemoglu pours a good dose of cold water on the optimism engendered by the likes of GS. In contrast to GS, Acemoglu reckons that the productivity effects from AI advances within the next 10 years “will be modest”. The highest gain he forecasts would be just a total 0.66% rise in total factor productivity (TFP), which is the mainstream measure for the impact of innovation, or about a tiny 0.064% increase in annual TFP growth. It could even be lower as AI cannot handle some harder tasks that humans do. Then the rise could be just 0.53%. Even if the introduction of AI raised overall investment, the boost to GDP in the US would be only 0.93-1.56% in total, depending on the size of the investment boom.
Moreover, Acemoglu reckons that AI will widen the gap between capital and labor income; as he says: “low-education women may experience small wage declines, overall between-group inequality may increase slightly, and the gap between capital and labour income is likely to widen further”. Indeed, AI may actually harm human welfare by expanding misleading social media, digital ads and the IT defense-attack spending. So AI investment may add to GDP but lower human welfare by as much as 0.72% of GDP.
And there are other dangers to labour. Owen David argues that AI is already being used to monitor workers on the job, recruit and screen job candidates, set pay levels, direct what tasks workers do, evaluate their outputs, schedule shifts, etc. “As AI takes on the functions of management and augments managerial abilities, it may shift power to employers.” Shades of the observations of Harry Braverman in his famous book of 1974 on the degradation of work and destruction of skills by automation.
Acemoglu recognises that there are gains to be had from generative AI, “but these gains will remain elusive unless there is a fundamental reorientation of the industry, including perhaps a major change in the architecture of the most common generative AI models.” In particular, Acemoglu says that “it remains an open question whether we need models that engage inhuman-like conversations and write Shakespearean sonnets if what we really want is reliable information useful for educators, healthcare professionals, electricians, plumbers and other craft workers.”
Indeed, because it is managers and not workers as a whole who are introducing AI to replace human labour, they are already removing skilled workers from jobs they do well without necessarily improving efficiency and well-being for all. As one commentator put it: “I want AI to do my laundry and dishes so that I can do art and writing, not for AI to do my art and writing so that I can do my laundry and dishes.” Managers are introducing AI to “make management problems easier at the cost of the stuff that many people don’t think AI should be used for, like creative work….. If AI is going to work, it needs to come from the bottom-up, or AI is going to be useless for the vast majority of people in the workplace”.
Is AI going to save the major economies by delivering a big leap forward in productivity? It all depends on where and how AI is applied. A PwC study found productivity growth was almost five times as rapid in parts of the economy where AI penetration was highest than in less exposed sectors. Barret Kupelian, the chief economist at PwC UK, said: “Our findings show that AI has the power to create new industries, transform the jobs market and potentially push up productivity growth rates. In terms of the economic impact, we are only seeing the tip of the iceberg – currently, our findings suggest that the adoption of AI is concentrated in a few sectors of the economy, but once the technology improves and diffuses across other sectors of the economy, the future potential could be transformative.”
OECD economists are not so sure that is right. In a paper they pose the problem: “how long will the application of AI into sectors of the economy take? The adoption of AI is still very low, with less than 5% of firms reporting the use of this technology in the US (Census Bureau 2024). When put in perspective with the adoption path of previous general-purpose technologies (e.g. computers and electricity) that have taken up to 20 years to be fully diffused, AI has a long way to go before reaching the high adoption rates that are necessary to detect macroeconomic gains.”
“Findings at the micro or industry level mainly capture the impacts on early adopters and very specific tasks, and likely indicate short-term effects. The long-run impact of AI on macro-level productivity growth will depend on the extent of its use and successful integration into business processes.” The OECD economists point out that it took 20 years for previous ground-breaking technologies like electric power or PCs to ‘diffuse’ sufficiently to make a difference. That would make the 2040s for AI.

Moreover, AI by replacing labour in more productive, knowledge-intensive sectors, could cause “an eventual fall in the employment shares of these sectors (that) would act as a drag on aggregate productivity growth,”

And echoing some the arguments of Acemoglu, the OECD economists suggest that “AI poses significant threats to market competition and inequality that may weigh on its potential benefits, either directly or indirectly, by prompting preventive policy measures to limit its development and adoption.”
And then there is the cost of investment. Just gaining access to the physical infrastructure needed for large scale AI can be a challenge. The sort of computer systems needed to run an AI for cancer drug research typically require between two and three thousand of the latest computer chips. The cost of such computer hardware alone could easily come in at upwards of $60m (£48m), even before costs for other essentials such as data storage and networking. A big bank, pharmaceutical firm or manufacturer might have the resources to buy in the tech it needs to take advantage of the latest AI, but what about a smaller firm?

So contrary to the conventional view and much more in line with Marxist theory, the introduction of AI investment will not lead to a cheapening of fixed assets (constant capital in Marxist terms) and therefore a fall in ratio of fixed asset costs to labour, but the opposite (ie a rising organic composition of capital). And that means further downward pressure on average profitability in the major economies.
And there is the impact on global warming and energy use. Large language models such as ChatGPT are some of the most energy-guzzling technologies of all. Research suggests, for instance, that about 700,000 litres of water could have been used to cool the machines that trained ChatGPT-3 at Microsoft’s data facilities. Training AI models consumes 6,000 times more energy than a European city. Furthermore, while minerals such as lithium and cobalt are most commonly associated with batteries in the motor sector, they are also crucial for the batteries used in datacentres. The extraction process often involves significant water usage and can lead to pollution, undermining water security.
Grid Strategies, a consultancy, forecasts US electricity demand growth of 4.7 percent over the next five years, nearly doubling its projection from a year earlier. A study by the Electric Power Research Institute found that data centres will make up 9 per cent of US power demand by 2030, more than double current levels.

Already that prospect is leading to a slowdown in plans to retire coal plants as power demand from AI surges.
Maybe these investment and energy costs can be reduced with new AI developments. Swiss technology firm Final Spark has launched Neuroplatform, the world’s first bioprocessing platform where human brain organoids (lab-grown miniaturized versions of organs) perform computational tasks instead of silicon chips. The first such facility hosts the processing prowess of 16 brain organoids, which the company claims uses a million times less power than their silicon counterparts. This is a frightening development in one sense: human brains! But luckily it is a long way from implementation. Unlike silicon chips, which can last for years, if not decades, the ‘organoids’ only last 100 days before ‘dying’.
Contrary to the GS economists, those at the frontier of AI development are much less sanguine about its impact. Demis Hassabis, head of Google’s AI research division puts it: “AI’s biggest promise is just that — a promise. Two fundamental problems remain unsolved. One involves making AI models that are trained on historic data, understand whatever new situation they are put in and respond appropriately. ” AI needs to be able to “understand and respond to our complex and dynamic world, just as we do”.
But can AI do that? In my previous post on AI, I argued that AI cannot really replace human intelligence. And Yann LeCun, chief AI scientist at Meta, the social media giant that owns Facebook and Instagram, agrees. He said that LLMs had “very limited understanding of logic . . . do not understand the physical world, do not have persistent memory, cannot reason in any reasonable definition of the term and cannot plan . . . hierarchically”. LLMs were models learning only when human engineers intervene to train it on that information, rather than AI coming to a conclusion organically like people. “It certainly appears to most people as reasoning — but mostly it’s exploiting accumulated knowledge from lots of training data.” Aron Culotta, associate professor of computer science at Tulane University, put it another way. “common sense had long been a thorn in the side of AI”, and that it was challenging to teach models causality, leaving them “susceptible to unexpected failures”.
Noam Chomsky summed up the limitations of AI relative to human intelligence. “The human mind is not like ChatGPT and its ilk, a lumbering statistical engine for pattern matching, gorging on hundreds of terabytes of data and extrapolating the most likely conversational response of most probable answer to a scientific question. On the contrary, the human mind is a surprisingly efficient and even elegant system that operates with small amounts to information; it seeks not to infer brute correlations among data points but to create explanations. Let’s stop calling it artificial intelligence and call it for what it is ‘plagiarism software’ because it does not create anything but copies existing works, of artists, modifying them enough to escape copyright laws.”
That brings me to what I might call the Altman syndrome. AI under capitalism is not innovation aiming to extend human knowledge and relieve humanity of toil. For capitalist innovators like Sam Altman, it is innovation for making profits. Sam Altman, the founder of OpenAI, was removed from controlling his company last year because other board members reckoned he wanted to turn OpenAI into a huge money-making operation backed by big business (Microsoft is the current financial backer), while the rest of the board continued to see OpenAI as a non-profit operation aiming to spread the benefits of AI to all with proper safeguards on privacy, supervision and control. Altman had developed a ‘for-profit’ business arm, enabling the company to attract outside investment and commercialise its services. Altman was soon back in control when Microsoft and other investors wielded the baton on the rest of the board. OpenAI is no longer open.
Machines cannot think of potential and qualitative changes. New knowledge comes from such transformations (human), not from the extension of existing knowledge (machines). Only human intelligence is social and can see the potential for change, in particular social change, that leads to a better life for humanity and nature. Rather than develop AI to make profits, reduce jobs and the livelihoods of humans, AI under common ownership and planning could reduce the hours of human labour for all and free humans from toil to concentrate on creative work that only human intelligence can deliver.
June 1, 2024
Mexico: from AMLO to Sheinbaum
Mexico has its general election this Sunday. With a population of over 130 million, Mexico is among the 15 largest economies in the world and the second-largest economy in Latin America.
Andrés Manuel López Obrador, known as AMLO, has been president since 2012 but he has had two terms and so cannot stand again. His party, Moreno, that he formed in 2012, is putting up the former mayor of the capital city, Mexico City, Claudia Sheinbaum. Sheinbaum is facing opposition from Xochitl Galvez, representing a coalition of ‘business-friendly’ parties. The campaigning has now ended and Sheinbaum holds a 21-point lead in the opinion polls over Gálvez.

AMLO’s presidential victory in 2018 was seen as a shift to the left in the interests of working people in Mexico over the long standing rule of the corrupt and pro-capitalist parties of PRD and PAN. In 2018, AMLO campaigned on three key issues: rising pervasive and daily violence across the country; endemic corruption among politicians and officials; and high and rising inequality between rich and poor.
How did AMLO do on those issues? Well, there seems to have been little improvement in violence and crime. ‘Intentional homicides’ have fallen a little since 2018 but are still way higher than in 2010. In 2020, Mexico had the worst record in the top Latin American countries on this measure. But remember this longstanding crime wave is mainly a product of drug cartel wars – and the huge drug export industry is really a consequence of consumer addiction in the US and criminal elements there.

What about corruption? AMLO has stood for being the most incorrupt president that Mexico has had since the 1930s. The corruption index from Transparency International shows that corruption among officials and professions is indeed a little better than in 2018 (the lower the score, the higher the corruption), but still way worse than in the 2000s.

What about inequality of incomes and wealth? Well, according to the World Inequality Database, in 2012, the top 1% of Mexican income earners took 27.4% of all personal income and the top 10% took 64.1%, while the bottom 50% took just 5.4%. The latest figures are for 2022 and they show the top 1% taking 26.8% and the top 10% taking 64.6%, while the bottom 50% had just 6.0%. So there has been no visible improvement in income inequality under the AMLO years.
Professor Aberlardo Marina, economist at Universidad Autónoma Metropolitana Mexico, shows that AMLO’s program of raising the minimum wage levels and other social benefits has helped incomes for those at the bottom. In the last six years, the minimum wage increased by 82% and manufacturing wages rose 27%.

Source: Marina
As a result, the share of GDP going to labour has increased from a low under the pro-capitalist Pena presidency at 24.6% in 2012 to 27.6% in 2022, while the profit share has fallen back. But the share going to labour is still way down compared with the 1970s before the onset of neoliberal policies adopted by pro-capitalist governments in Mexico (and globally). Then wage share fell and profit share rose.

Source: Marina
When it comes to inequality of wealth, the situation for the majority is even worse. In 2012, the top 1% of wealth holders had 27.4% of all personal wealth in Mexico; the top 10% had staggering 80%, while the bottom 50% had negative wealth (more debt than assets). In 2022, the top 1% had 26.8% of all personal wealth; the top 10% had 79.1% and the bottom 50% still had negative wealth. So again, no visible improvement.

And when we look at poverty ratios, although the ‘extreme poverty’ rate (earning less than $2.15 day) has fallen under AMLO, lifting 8.8 million Mexicans out of poverty – a big gain – Mexico still has a greater share of people living on less than $3.65 a day than the Latin American average.

Mexico has the lowest tax-to-GDP ratio in the OECD. The rich are not paying much in tax…

… forcing the government to run large budget deficits and borrow more to finance welfare spending and public services.

Besides these issues, what is the state of the Mexican economy? Over the last three decades, Mexico has underperformed in terms of growth. Its economic growth has averaged just above 2% a year between 1980 and 2022, limiting any progress in convergence relative to high-income economies. Indeed, since the pandemic, the average real GDP growth rate has been just 0.7%, although in 2020 and 2023, following the rebound after the pandemic, the economy expanded by over 3% each year. Stripping out population increases, we find that Mexico’s per capita GDP is still lower than in 2018.

Over the decades, Mexico’s capitalist sector has failed to deliver on productive investment and thus on productivity growth. Professor Marina shows that productive investment (ie excluding construction of homes and real estate) has never been higher than 17% of GDP and has fallen under AMLO’s presidency. And there was stagnation during the Long Depression of the 2010s.

Source: Marina
Productivity levels are lower than ten years ago, although there has been some recovery since the pandemic.

The reason that Mexico’s capitalists are not investing productively, despite a high profit share and low taxes, is that the profitability of Mexican capital has been in secular decline and so productive investment has been rejected in favour of real estate and financial speculation. And much of the profitability has ended up in American companies.

Mexican capital is dominated by American capital. Since becoming part of NAFTA (the free trade area of the US, Canada and Mexico), then renamed the US-Mexico-Canada (USMCA) trade agreement as imposed under Trump, Mexico’s economy increasingly depends on exports to the US and investment from the US companies to take advantage of Mexico’s cheap labour. Exports have been booming, up over 11% this year. On the other side of the equation, remittances by Mexicans working abroad (mainly in the US), have rocketed to 4% of GDP.

More recently,with the US applying trade sanctions against Chinese goods, Mexico has increasingly become a ‘third party’ conduit for Chinese imports into the US.

All this has helped Mexico’s external accounts. In 2023, goods trade was virtually in balance and the overall current account deficit was only 1.4% of GDP.

Source: Marina
This kept the peso relatively strong against the dollar, rising from MXN19.2/USD in 2018 to MXN17.8/USD in 2023 – although the peso is still down 30% since 2012.

Stronger growth in the last two years has got the official unemployment rate down to new lows, although the high rate of ‘informal’ (casual) jobs hides the reality of employment in Mexico.

But the economy is not looking so good from here. Sheinbaum will face major challenges. The US economy is slowing down from the ‘sugar rush’ burst after the end of the pandemic and the end of Biden fiscal stimulus. If Trump is returned as president in 2025 and imposes his plan for widespread tariffs and restrictions against all imports, Mexico may be hit hard.
Meanwhile the domestic economy is getting weaker. Industrial production was down 3% in March, the first decline since 2021. Manufacturing activity surveys reveal that the sector is contracting. And retail spending by Mexican households is also declining. Real GDP growth is set to slow to under 2% in 2024.
AMLO’s presidency improved the lot of the bottom 50% of Mexicans. However, the fundamental problems of a weak economy, underinvested by capital, of extreme inequalities of income and wealth, of high levels of corruption and crime (with drug cartels running free), have not been resolved.
The problem is that AMLO’s programme was fundamentally Keynesian, aiming to use public investment to ‘prime the pump’ of private investment. He continued to rely on the capitalist sector to deliver rather than putting the public sector and planning in charge by taking control of the banks (mainly foreign), the state oil company PEMEX and the major multi-national operations within Mexico. Such a radical transformation would have provoked a vicious response from domestic capital and US imperialism (such has been applied to Venezuela). So AMLO and Sheinbaum are not prepared to go down that road.
If over the rest of this decade, the world economy slows or goes into recession and Mexico cannot export its way out of such a crisis, pressure will be on Sheinbaum to apply ‘fiscal austerity’ to reverse the gains made by labour under AMLO. When Lula in Brazil gave way to Dilmar Rousseff as president, a similar situation to Mexico now, the downturn in the world economy in the 2010s forced Rousseff to adopt pro-capitalist measures, eventually leading to her downfall through impeachment by Congress. Sheinbaum will need to avoid a similar fate as Mexico’s first woman president.
May 28, 2024
South Africa: hanging on
South Africa has a general election today with 28m citizens registered to vote. Since the end of the apartheid regime three decades ago, the African National Congress (ANC) has won all the elections with substantial majorities. But this time there is the possibility that the ANC will poll less than 50% of those voting.
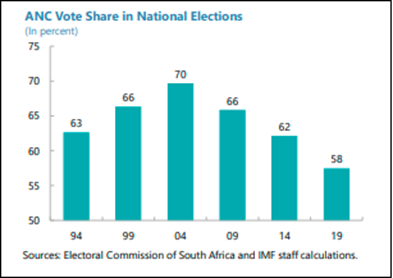
The loss of the ANC majority, if it happens, will not be due to any increase in the vote share of the main opposition party, the mainly white-led liberal Democratic Congress (DC), whose strength is concentrated in Cape province. The DC’s vote share is stuck at about 23%, more or less the same as in the last election in 2019.
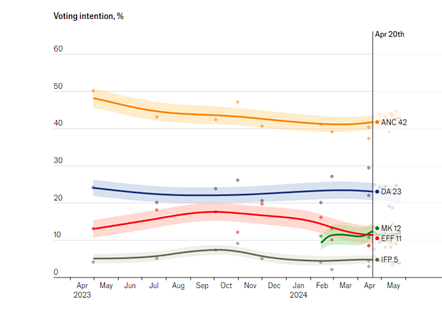
The potential loss of votes by the ANC is to two supposedly more radical parties, split-offs from the ANC. First, there is the party of ex-President Jacob Zuma called uMkhonto we Sizwe (MK) that is polling about 10% and would take votes away from the ANC in the eastern Zulu heartlands. Zuma has been indicted for corruption and abuse of power when president.
The real worry for the ANC and behind them, South Africa’s business elite, is the rise of Julius Malema’s Economic Freedom Fighters (EFF). The EFF appeals to younger voters with its program to strip land from the wealthy, seize assets from the mining companies and spend the proceeds on education, free WiFi and electricity and 24-hour doctors’ clinics. Both the MK and the EFF are showing around 11% of the vote in the opinion polls.
Why is there the possibility that the ANC, the party of South Africa’s overwhelming black majority with the historic legacy of Nelson Mandela, will poll less than 50% of the vote for the first time? When I covered the 2019 election in a post, I wrote that “In those 25 years, the majority have not seen any startling improvement in their living standards, education, health and public services. Indeed, for many, particularly young blacks, things are even worse. Inequality of incomes, wealth and land is extreme; corruption in government and in the party of the black majority, the African National Congress (ANC), is rife.”
Now in 2024, the situation for most South Africans is even worse than in 2019. Since 2019, there has been the brutal experience of the COVID pandemic, the ensuing economic slump and a feeble recovery since. Economic growth has continued to slow almost to a stop. Indeed, real GDP per person is lower than in 2019 and even 2012.

The official unemployment rate is still well over 30% (8m people) and near 60% for job-seekers between 15 and 24 years old.

Manufacturing output is contracting and the deficit on international trade is widening. Government debt to GDP after the experience of COVID has reached a record near 70% of GDP.
In general, life for the majority of South Africans has worsened since 2019. The World Bank has what it calls a Human Development Index (HDI) which measures key factors like life expectancy, health, education etc. South Africa’s HDI has dropped sharply since 2019.
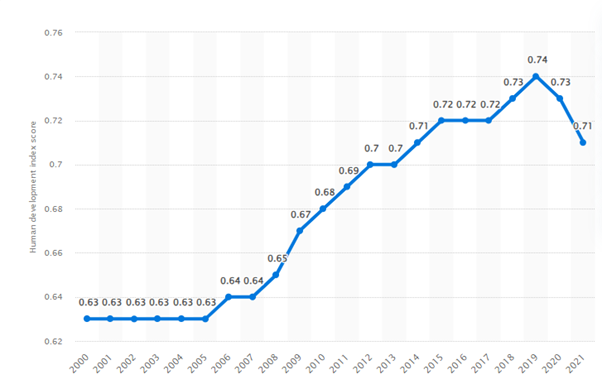
Indeed, South Africa’s HDI level has been rapidly surpassed or equalled by its economic peers globally, like China, Brazil and even Indonesia.
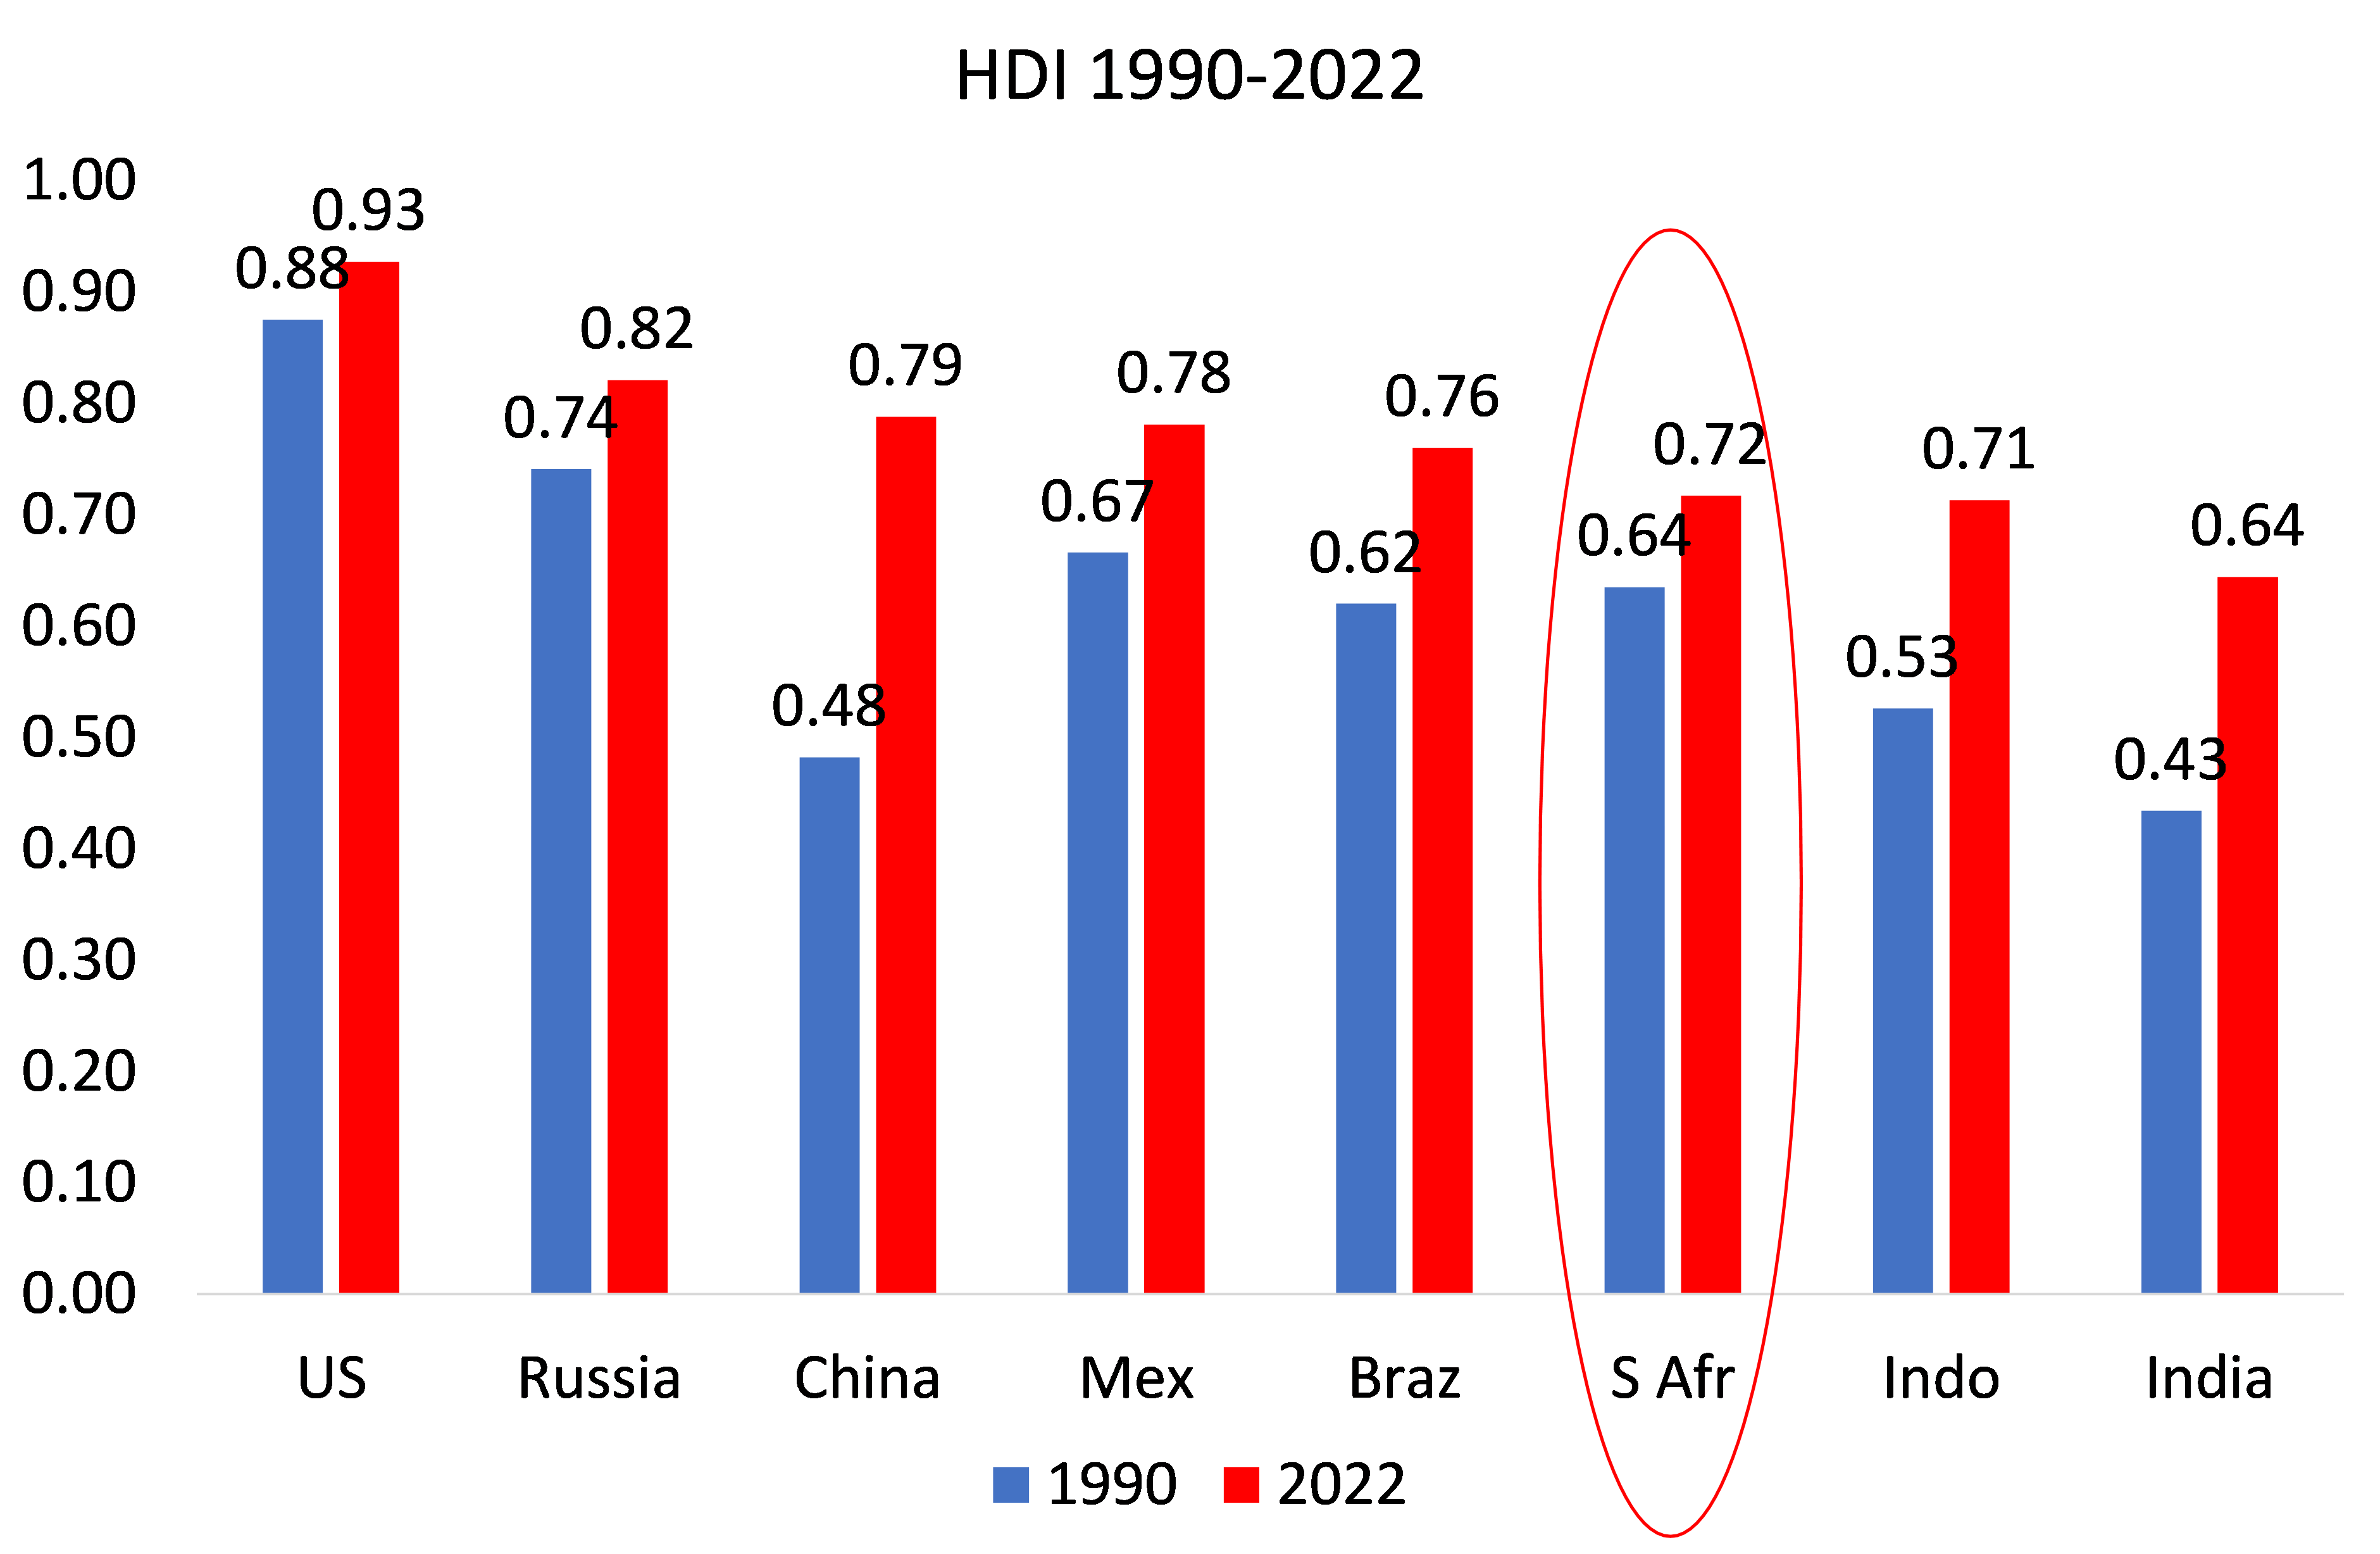
Only the high level US HDI has grown more slowly than South Africa since 1990, when the apartheid regime was coming to an end.
GrowthUS5.9Russia10.8China63.5Mex17.3Braz22.6S Afr12.9Indo35.6India48.4Growth in HDI index since 1990And then there is inequality and poverty. On World Bank levels, some 64% of citizens are living in poverty. Progress on extending access to basic services (such as water, electricity, and refuse collection) has stalled. Vulnerability to hunger has increased since the COVID-19 pandemic. An estimated 12.9 percent of the population was at risk of hunger in 2022, despite the expansion of social grants.

And South Africa remains the most unequal country in the world, having seen a widening gap between the haves and have-nots since the end of apartheid in 1994, according to the World Bank. The bank’s report, titled Inequality in Southern Africa: An Assessment of the Southern African Customs Union (Sacu), released this week, shows that the union is the world’s most unequal region with a consumption inequality over 40 percent higher than the averages for both sub-Saharan Africa and other upper-middle-income countries, the report found.

The World Bank report notes South Africa is characterised by “high wealth inequality and economic polarisation (particularly across labour markets)”. Wealth inequality is higher than income inequality, with estimates showing that the top 10% of the population hold 71% of its wealth, whereas the bottom 60% hold only 7%. This compares with 50% and 13% respectively for the OECD. No other country in the world can compete with South Africa’s inequality of income and wealth.

That inequality isn’t only seen in income and wealth distribution; it also manifests itself in unequal access to opportunities—education, health, and jobs—and regional disparities. When the HDI is adjusted for inequality of income and wealth, South Africa looks even worse. The World Bank’s HDI reduces South Africa to the level of India!
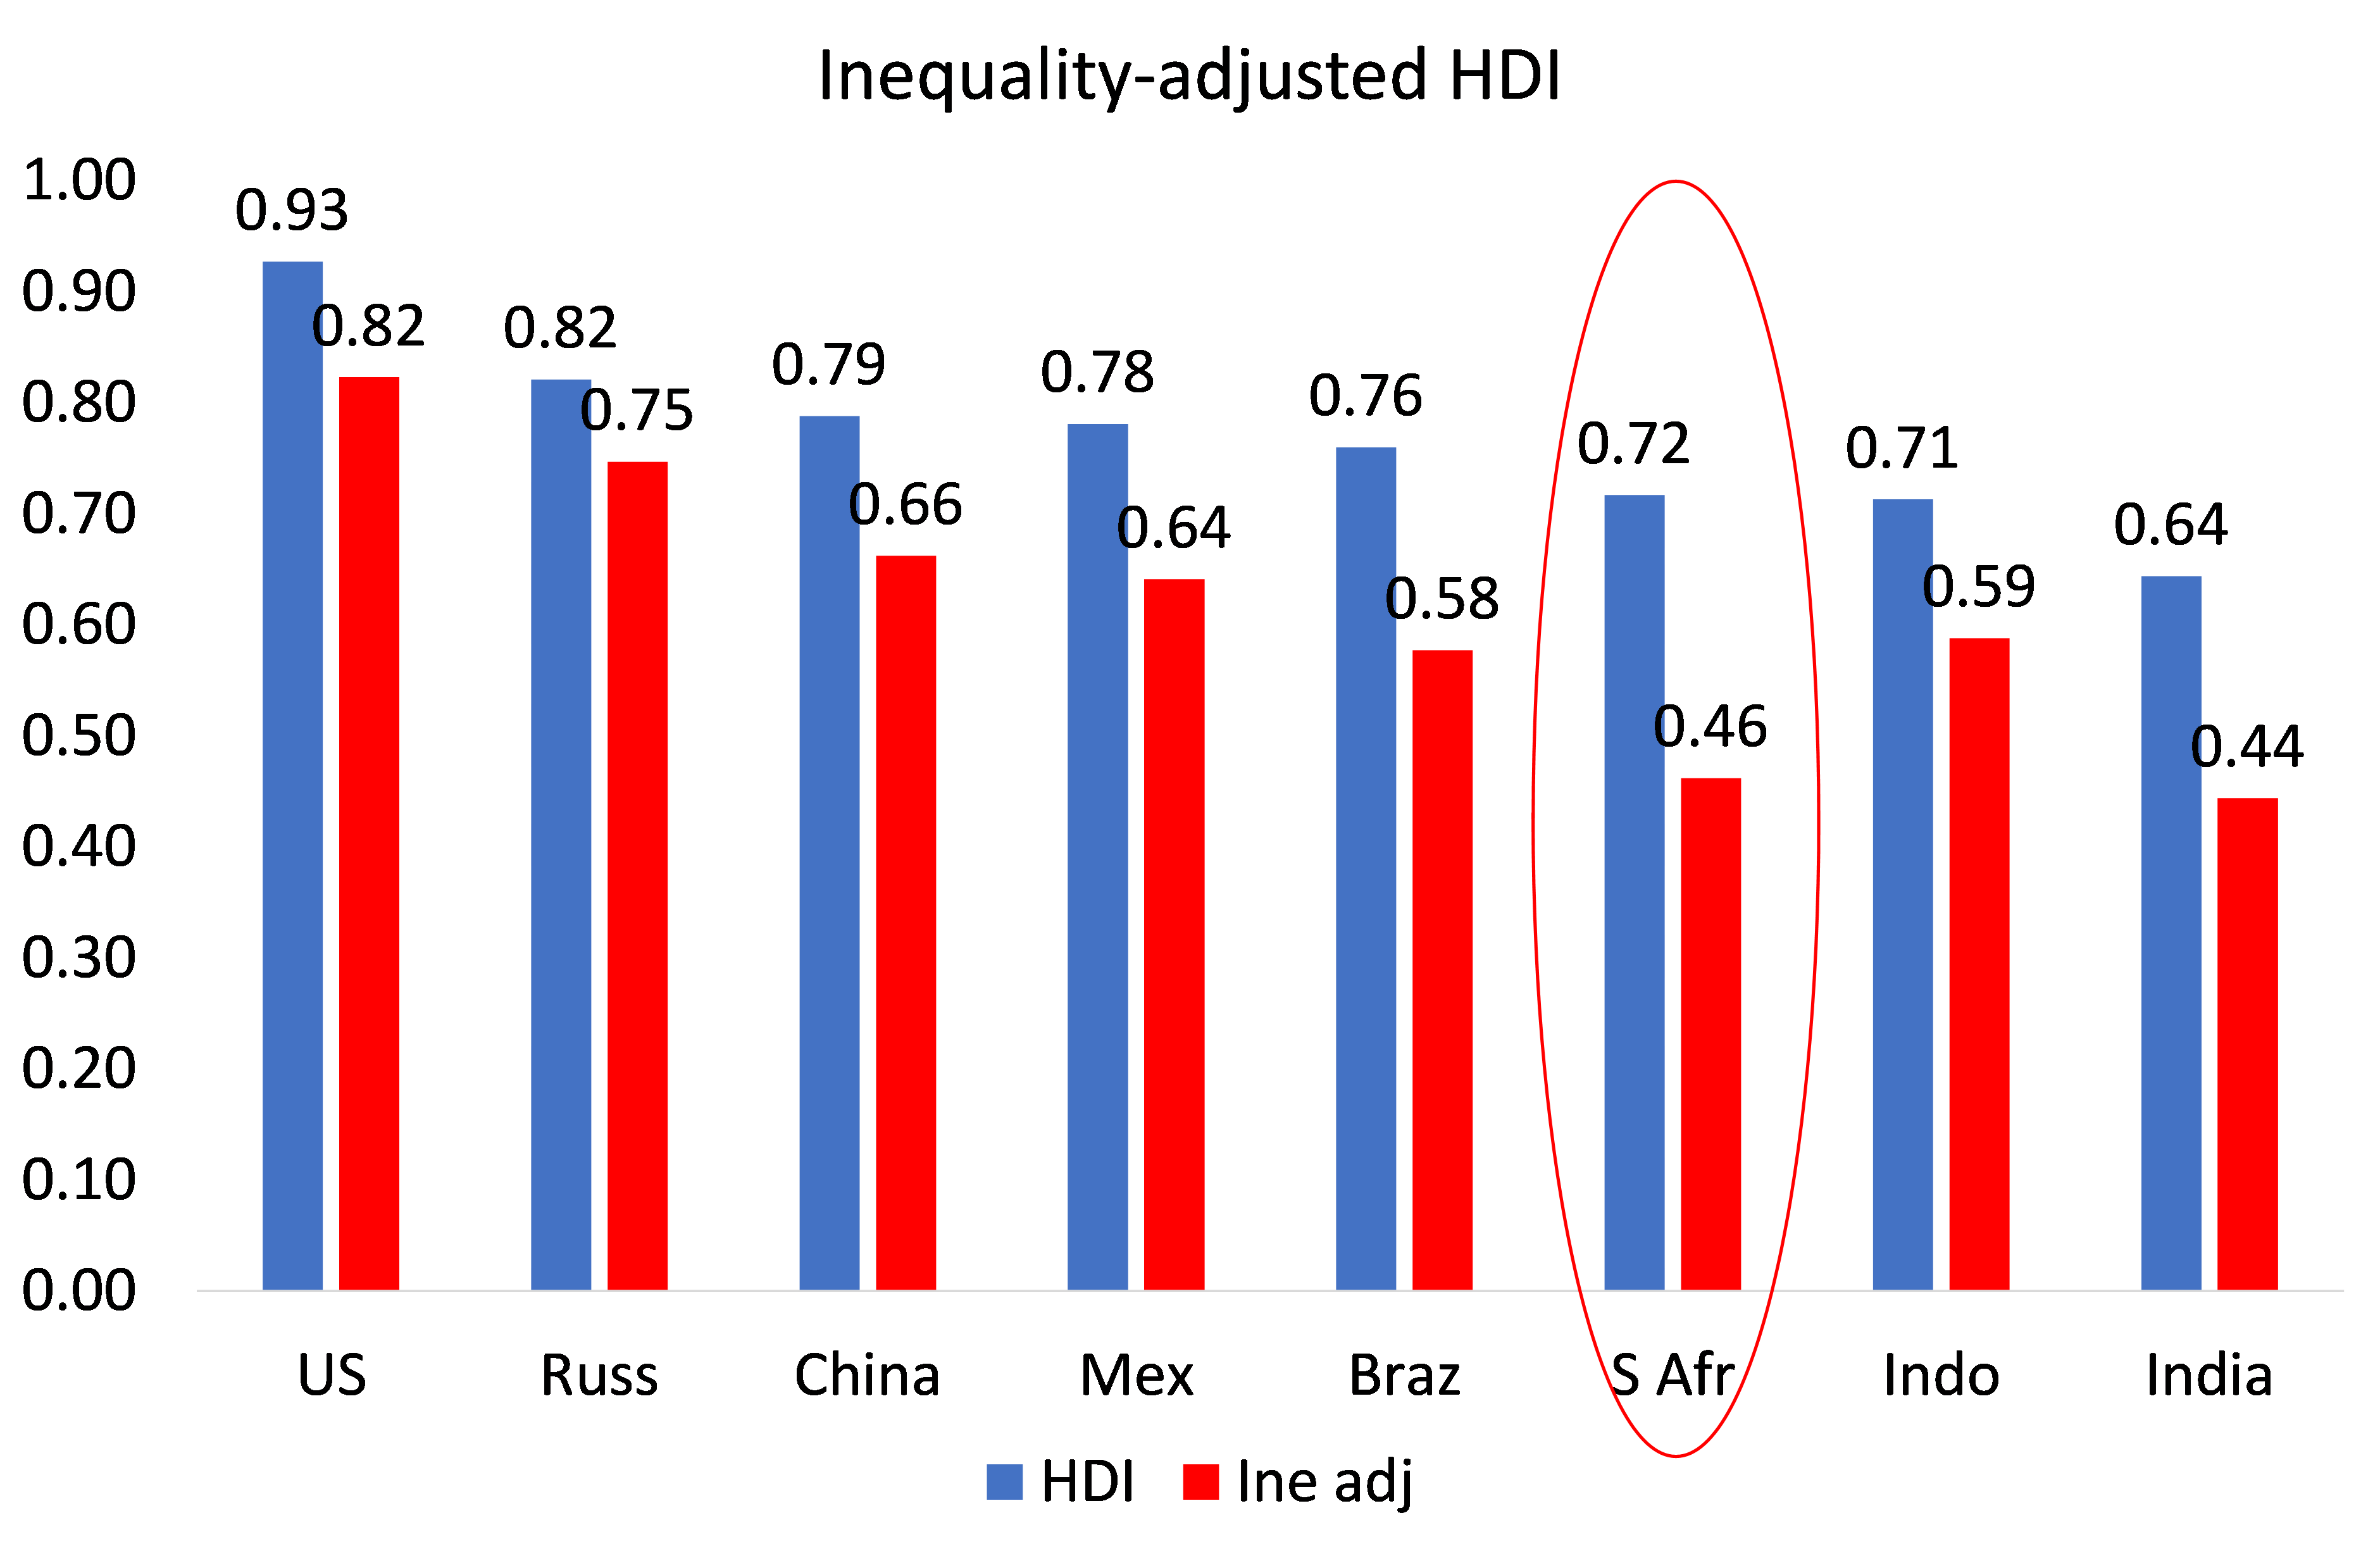
The bottom line is that South African capitalism presided over by the ANC has failed. It is decrepit and corrupt, generating power shortages and widespread crime. Crime is estimated to reduce annual GDP levels by 10%.

South African capital may have some large mining companies that make good profits, but the overall profitability of capital is low and falling. The big gains in profitability that arose after the end of apartheid have faded since the Great Recession of 2008 and ensuing Long Depression experienced globally. South African capital is heavily dependent on world economic growth and trade and is being strangled accordingly.

Source: Penn World Tables 10.01
South Africa’s business elite is desperately hoping that the ANC under President Ramaphosa will manage to survive with a majority in parliament that avoids any forced coalition with the radical EFF. The government is now claiming that it has resolved the electricity power outages, a perennial scourge for the daily lives of South Africans. Eskom, the state electricity provider, has now been able to keep the power on for 50 days. The government plans privatisation of power and transport on the grounds that this will ensure supply. After the election, the business elite will be pushing for more ‘business friendly’ measures on taxes, deregulation etc.
For its part, in an attempt to reduce voter support for the radical parties, the ANC has taken the plunge to win votes with a promise to introduce state health insurance for all citizens and a ‘basic income’ grant for the unemployed (but only within four years of winning the election). This would cost $17bn a year, which the ANC says will be funded by higher taxes, without specifying.
There is certainly room to raise taxes on the wealthy. An individual with a taxable income of ZAR100 000 used to pay tax at an effective rate of 33.8% in 1995; they paid tax at 19.8% in 2011 and 18% in 2022, on what the Alternative Information & Development Centre (AIDC) calls “the corporate income tax race to the bottom”. According to AIDC, a progressive net wealth tax of between 3% and 7% on the top 1% of the richest people in the country could raise more than R143 billion in revenue each year, which would cover most of the cost for a universal basic income grant.

However, the ANC seems reluctant to go down that road to fund any basic income, in case the wealthy and foreign investors desert the country. These measures will indeed worry the business elite and foreign investors. But then big business’ own proposed policies of privatization, tax cuts and deregulation are anathema to the electorate.
Indeed, the hopes of business for the improved health of South African capitalism are illusory. The South African economy cannot progress on a capitalist basis, with its massive inequalities, weak productive investment and trade deficits. The best forecasts for annual real GDP growth are for only 1.3% over the next parliament. That will never create enough jobs for unemployed youth (even if they get some ‘basic income’) and nothing is proposed to deal with the massive inequalities. The trade deficit is expected to widen. Public investment is projected to fall further while the government debt ratio will rise to near 80% of GDP.
Current President Cyril Ramaphosa is a former trade unionist who turned himself into a ‘businessman’ to make millions. He now presides over a corrupt administration in a weak and stagnant economy and a society with extreme poverty and inequality. South African capitalism is a basket case. How long can it hang on without a massive reaction from its people?
May 27, 2024
What went wrong with capitalism?
Ruchir Sharma has a book out called What went wrong with capitalism? Ruchir Sharma is an investor, author, fund manager and columnist for the Financial Times. He is the head of Rockefeller Capital Management‘s international business, and was an emerging markets investor at Morgan Stanley Investment Management.
With those credentials of being ‘inside the beast’ or even ‘one of the beasts’, he ought to know the answer to his question. In a review of his book in the Financial Times, Sharma outlines his argument. First, he tells us that “I worry about where the US is leading the world now. Faith in American capitalism, which was built on limited government that leaves room for individual freedom and initiative, has plummeted.” He notes that now most Americans don’t expect to be “better off in five years” — a record low since the Edelman Trust Barometer first asked this question more than two decades ago. Four in five doubt that life will be better for their children’s generation than it has been for theirs, also a new low. And according to the latest Pew polls, support for capitalism has fallen among all Americans, particularly Democrats and the young. In fact, among Democrats under 30, 58 per cent now have a “positive impression” of socialism; only 29 per cent say the same thing of capitalism.
This is bad news for Sharma as a strong supporter of capitalism. What has gone wrong? Sharma says that it’s the rise of big government, monopoly power and easy money to bail out the big boys. This has led to stagnation, low productivity growth and rising inequality.
Sharma argues that the so-called neoliberal revolution of the 1980s that supposedly replaced Keynesian-style macro management, reduced the size of the state and deregulated markets was really a myth. Sharma: “the era of small government never happened.” Sharma points out that in the US, government spending has risen eight-fold since 1930 from under 4 per cent to 24 per cent of GDP — and 36 per cent including state and local spending. Alongside tax cuts, government deficits rose and public debt rocketed.
As for deregulation, the result was actually “more complex and costly rules, which the rich and powerful were best equipped to navigate.” Regulatory rules actually increased. As for easy money, “fearful that mounting debts could end in another 1930s-style depression, central banks started working alongside governments to prop up big corporations, banks, even foreign countries, every time the financial markets wobbled.” So there was no neoliberal transformation freeing up capitalism to expand, on the contrary.
But is Sharma’s economic history of the period after the 1980s really right? Sharma tries to portray the post-1980s period as one of bailouts for banks and companies during crises in contrast to the 1930s when central banks and governments followed the policy of ‘liquidation’ of those in trouble. Actually, this is not correct, saving corporate capital and the banks was the driving force of the Roosevelt New Deal; liquidation was never adopted as government policy. Moreover, the 1980s were mostly a decade of high interest rates and tight monetary policy imposed by central bankers like Volcker, seeking to drive down the inflation of the 1970s. Indeed, Sharma has nothing to say about the ‘stagflation’ of the 1970s – a decade, according to him, where capitalism had small government and low regulation.
Sharma makes much of the rise in government spending including ‘welfare spending’ in the last 40 years. But he does not really explain why. After the rise in spending and debt during the war, much of the increased spending since has been due to a rise in population, particularly a rise in the elderly, leading to an increase in (unproductive for capitalism) spending on social security and pensions. But the rise in government spending was also a response to the weakening of economic growth and investment in productive capital from the 1970s. As GDP grew more slowly and welfare spending grew faster, then government spending to GDP rose.
Sharma says nothing about other aspects of the neo-liberal period. Privatisation was a key policy of the Reagan and Thatcher years. State assets were sold off to boost profitability in the private sector. In this sense, there was a reduction in the ‘big state’, contrary to Sharma’s argument. Indeed, starting as early as the mid-1970s, public sector capital stock was sold off. In the US, it has been halved as a share of GDP.

Source: IMF investment and capital stock database, 2021
Similarly, post the 1980s, public sector investment as a share of GDP has been nearly halved while the private sector share has risen 70%.

It’s not the ‘big state’ that is in control of investment and output decisions, it is the capitalist sector. This hints at the reason for reducing the role of the public sector. The problem for capitalism in the late 1960s and 1970s was the drastic fall in the profitability of capital in the major advanced capitalist economies. That fall had to be reversed. One policy was privatization. Another policy was the crushing of the trade unions through laws and regulations designed to make it difficult if not impossible to set up unions or take industrial action. Then there was the move of manufacturing capacity out of the ‘Global North’ to the cheap labour regions of the Global South, so-called ‘globalization’. Combined with weakening trade unions at home, the result was a sharp drop in the share of GDP going to labour along with cheap labour abroad; and a (modest) rise in profitability of capital.

Sharma admits that “globalisation brought more competition, keeping a lid on inflation in consumer prices” against his thesis of monopoly stagnation, but then argues that globalization and low imported goods prices “solidified a conviction that government deficits and debt don’t matter.” Really? Throughout the 1990s onwards, governments tried to impose ‘austerity’ in the name of balancing budgets and reducing government debt. They failed, not because they thought that ‘deficits and debt don’t matter’ but because economic growth and productive investment slowed. Public sector spending cuts were significant, but the ratio to GDP did not fall.
Sharma reckons that ‘recessions were fewer and farther between’ in the post-1980s period. Hmm. Leaving out the huge double slump of the early 1980s (another key factor in driving down labour power), there were recessions in 1990-1, 2001 and then the Great Recession of 2008-9, culminating in the pandemic slump of 2020, the worst slump in the history of capitalism. Maybe fewer and farther between, but increasingly damaging.
Sharma notes that after each slump since the 1980s, economic expansion has been weaker and weaker. This appears as a mystery for proponents of capitalism. “Behind the slowing recoveries was the central mystery of modern capitalism: a collapse in the rate of growth in productivity, or output per worker. By the outset of the pandemic, it had fallen by more than half since the 1960s.”
Sharma presents his explanation: “a growing body of evidence points the finger of blame at a business environment thick with government regulation and debt, in which mega-companies thrive and more corporate deadwood survives each crisis.” The bailouts of the big monopolies (‘three of every four US industries have ossified into oligopolies’) and ‘easy money’ have kept a stagnating capitalism crawling along, breeding ‘zombie’ companies that only survive by borrowing.
Sharma puts the horse before the cart here. Productivity growth slowed across the board because productive investment growth dropped. And in capitalist economies, productive investment is driven by profitability. The neo-liberal attempt to raise profitability after the profitability crisis of the 1970s was only partially successful and came to an end as the new century began. The stagnation and ‘long depression’ of the 21st century is exhibited in rising private and public debt as governments and corporations try to overcome stagnant and low profitability by increasing borrowing.

Sharma proclaims that social “immobility is stifling the American dream.” Whereas, in the rosy past of ‘competitive capitalism’, through dint of hard work and entrepreneurial drive, you could go from rags to riches, now that is not possible. But the ‘American dream’ was always a myth. and those that did become billionaires in their lifetime did not do so without sizeable start-up funds from parents etc.
And let me add, Sharma’s thesis is entirely based on the advanced capitalist economies of the Global North. He has little to say about the rest of the world where most people live. Has social mobility been stymied or never existed? Is there a big state with massive welfare spending in these countries? Is there easy money for companies to borrow? Are there domestic monopolies squeezing out competition? Are there bailouts galore?
That brings us to Sharma’s main message about what is wrong with capitalism. You see, for Sharma, capitalism as he envisages it no longer exists. Instead, competitive capitalism has morphed into monopolies bolstered by a big state. “Capitalism’s premise, that limited government is a necessary condition for individual liberty and opportunity, has not been put into practice for decades.”
The myth of a competitive capitalism that Sharma projects sounds similar to the thesis of Grace Blakeley in her recent book, Vulture Capitalism, where she argues that capitalism has never really been a brutal battle between competing capitalists for a share of the profits extracted from labour, but instead a nicely agreed and planned economy controlled by big monopolies and backed by the state.
In effect, both Sharma and Blakeley agree on the rise of ‘state monopoly capitalism’ (SMC) as the reason for what went wrong with capitalism. Of course, they differ on the solution. Blakeley, being a socialist, wants to replace SMC with democratic planning and workers coops. Sharma, being ‘one of the beasts’, wants to end monopolies, reduce the state and restore ‘competitive capitalism’ to follow its ‘natural path’ to provide prosperity for all. Sharma: “capitalism needs a playing field on which the small and new have a chance to challenge — creatively destroy — old concentrations of wealth and power.”
You see, capitalists, if left alone to exploit the labour force, and freed of the burden of regulations and for having to pay for welfare spending, will naturally flourish. “The real sciences explain life as a cycle of transformation, ashes to ashes, yet political leaders still listen to advisers claiming they know how to generate constant growth. Their overconfidence needs to be contained before it does more damage.” So, according to Sharma, capitalism will be fine again, if we let the capitalist cycles of boom and slump play out naturally and not try to manage them.
“Capitalism is still the best hope for human progress, but only if it has enough room to work.” Well, capitalism has had plenty of room to work for over 250 years with its booms and slumps; its rising inequalities globally; and now its environmental threat to the planet; and the increasing risk of geopolitical conflict. No wonder 58% of young Democrats in the US would prefer socialism.
May 20, 2024
Tariffs, technology and industrial policy
Last Tuesday, the trade and technology war launched by the US on China back in 2019 took another ratchet up.

The US government announced a new series of protectionist measures on Chinese goods imported into the US. It included a quadrupling of the tariff rate to 100% on Chinese electric vehicle (EV) imports, doubling the levy on solar cells and more than tripling the fee on Chinese lithium-ion EV batteries. These tariffs are equivalent to an annual $18bn of Chinese goods on top of the previous $300bn slapped down under Trump.

The new tariffs specifically target ‘green goods’, most notably EVs, but tariffs on lithium-ion batteries, critical minerals and solar cells will also be substantially increased. The measures are set to take effect this year (with the exception of graphite, where Chinese dominance is most stark, so tariffs begin in 2026).
China is the world leader in EV production and innovation. Chinese EVs are now better and cheaper than their Western counterparts. Biden’s intention is to stave off Chinese competition while stimulating domestic EV supply. But China’s EV imports are only 2% of the US market. And all the goods that these new tariffs were slapped on constitute only about 7% of US-China trade. What this shows is that, even the US government recognizes that the US still relies heavily on Chinese goods imports and cannot cut them all dead.

That’s because the tariff and technology war is not just about protecting the ailing US auto industry. China is totally dominant in EV manufacture because it’s also totally dominant in battery (cell) manufacture. And it’s also totally dominant in the manufacture of the chemicals that go into those cells (cathode & anodes).

China is also utterly dominant when it comes to the refining of the materials that then go into the chemicals that then go into the cells which go into the EVs. [image error]
China has scaled up its green industries rapidly. It now produces nearly 80% of the world’s solar PV modules, 60% of wind turbines and 60% of electric vehicles and batteries. In 2023 alone, its solar-power capacity grew by more than the total installed capacity in the US.
To avoid the impact of previous US measures, Chinese firms have been rerouting their supply chains through third countries with pre-existing Free Trade Agreements with the US—Morocco, Mexico and Korea chief among them. This has enabled ‘backdoor’ access to the American market. Over 80% of solar cells imported into the US now come via Vietnam, Malaysia, Thailand and Cambodia.
The US is now trying to break this back-door move. In its “Foreign Entity of Concern” ruling, US automakers won’t be able to receive government tax credits if any company in their battery supply chain has 25% or more of its equity, voting rights or board seats owned by a Chinese government-linked

Will these protectionist measures work? While the previous tariff measures did reduce the number of Chinese solar panels coming to the US (with an 86% drop over the 2012-2020 period), the billions in subsidies, from first Obama and then Biden, did not revitalise the US solar industry. On the contrary, the American global market share of the solar industry has considerably decreased since the original tariffs were placed — from 9% in 2010 to 2% today. Meanwhile, China’s share of the industry rose from 59% to 78%. There’s no reason to believe that the recent tariff increase will reverse this trend. There’s even less hope that they will help spur a domestic EV industry.
The new policy of many governments in the Global North is so-called ‘industrial policy’. Instead of leaving it to ‘free markets’, governments must now intervene to subsidise and direct finance and regulations in order to boost key industries and reduce the impact of foreign competition. The Inflation Reduction Act (IRA) under Biden is an example of this. The IRA includes almost $400 billion in subsidies (through grants, loans and tax credits) aimed at boosting the US ‘cleantech’ sector.
The US attempts to paint China as a rogue nation using “non-market practices” to “game the system”. US Secretary of the Treasury Janet Yellen visited China and claimed that “China is really not playing by the rules in the sense that they have enormous subsidies in critical areas of advanced manufacturing” and “[Biden] wants to make sure that the stimulus that’s being provided through the Inflation Reduction Act support[s] these industries”. It seems that China’s industrial policy of subsidies is ‘gaming the system’, while US industrial policy of similar subsidies is just ‘protecting’ US industry. This argument is accompanied by the ludicrous claim that China is dumping its goods in world market below costs because it has ‘over-capacity’.
There is a big difference in the nature of ‘industrial policy’ in China and that of the US. According to an unpublished study by the OECD, Chinese state aid to Chinese companies is nine times the size of the state aid in OECD nations. Chinese businesses benefit from government subsidies equivalent, on average, to 3.7% of their revenues. This compares to average state aid of only 0.4% of revenues for countries in the ‘rich world’.

This aid can take the form of direct grants from governments, to support a company or help it to build a plant; or special low taxes charged to specific companies or sectors, and lower-than-market interest rates on loans.
There are two things here. First, China’s state aid is mostly low-cost loans to industry, while in the OECD it is mainly tax concessions. That’s important because in China’s case, the state banks can direct resources and keep control of the allocation; in the case of the OECD, tax concessions simply leave the private sector to do what they want.
Second, China’s state aid aims at boosting manufacturing and export sectors, not protecting weak and ailing industries from foreign competition. In the case of the US, industrial policy measures like tariffs and the IRA are aimed at doing the opposite. found that the latter approach of ‘import substitution’ undermines growth in the long term since it creates ‘excessively coddled, inefficient industries’.
It is thus no surprise that while the US government tries to block Chinese EV imports with tariffs, US firms are trying to recapture the EV market by licensing the superior technology of lead Chinese firms! Ford (in Michigan) and Tesla (in Nevada) are partnering with China’s CATL to make batteries. CATL says that it has structured its licensing deal with Ford so that it is compliant with “foreign entity of concern” rules. For its part, Tesla already uses Chinese BYD cells in Germany; Ford and GM use BYD batteries. Even Trump doesn’t like the idea of a ‘great wall’ against Chinese FDI in America. Speaking at an Ohio rally in March, he signalled an openness to Chinese firms building plants “in Michigan, in Ohio, in South Carolina”—so long as they were prepared to employ American workers.
Moreover, Trump and Biden’s imposition of tariffs risks hindering the adoption of low-emission technologies by American businesses and consumers. Many sectors of US business are worried that not only will climate goals set by the administration fail (although they are anyway) but also input costs will increase with rising import prices for key components. That will reduce profitability. And cost increases could be passed on to the consumer, leading to further upward pressure on inflation for Americans, without any guarantee that American industry will be boosted. The US Institute for Supply Management reckons there would be a large hike in costs for businesses to stop sourcing from China. “If industry hadn’t made these big moves 25 to 30 years ago, you wouldn’t have the quality of life you have in the United States today,” said ISM economist, estimating that many product inputs might cost as much as 30-40% more. “That would have made everyday goods much more expensive for Americans to buy.”
And here we get to the bigger picture. US manufacturing hasn’t seen productivity growth in 17 years. That makes it increasingly impossible for the US to compete in key areas, and Biden’s ‘industrial policy’ will fail to deliver unless it can end that stagnation. China’s manufacturing sector is now the dominant force in world production and trade. Its production exceeds that of the nine next largest manufacturers combined.

At the same time, the US lead in key digital technology is being fast undermined by China. Behind the trade war on tariffs is the chip war. The chip war started back in 2018 when the then President Trump banned US agencies from using any systems, equipment and services from Huawei, a Chinese telecommunications giant. Then in 2020, Chinese officials were barred entrance into the US for named officials and their immediate families. And Trump prohibited all US institutional and retail investors from investing or purchasing from Chinese companies and imposed sanctions against several businesses in China for supplying Russian Military networks. In 2022, the Biden administration announced limits on sales of new semiconductors to China.
Microchips are the new oil – the scarce resource on which the modern world depends. Today, military, economic and geopolitical power are built on a foundation of computer chips. Virtually everything from missiles to microwaves, smartphones to the stock market runs on chips. Until recently, America designed and built the fastest chips to maintain its lead as the superpower. But in the 21st century, America’s edge has been undermined by competitors in Taiwan, Korea, Europe, and, above all, China. Now China spends more money each year importing chips than it spends importing oil and is pouring billions into a chip-building initiative to catch up to the US.
Global Semiconductor Market Share (%), by Major Country

Under Biden, the US administration introduced the Chips Act as part of a series of measures designed to weaken China’s tech capabilities and global influence. The main goal was to provide $52 billion in manufacturing grants and research investment and to introduce a 25% investment tax credit to chip producers in the US. But any entity that utilises CHIPS funding is prohibited from “engaging in any significant transaction involving the material expansion of semiconductor manufacturing capacity in China”. The US is planning more sanctions including an export ban of semiconductor manufacturing equipment for NAND memory chips with more than 128 layers. The aim is that by blocking China’s biggest NAND company and foreign company-owned memory chip fabs in mainland China, foreign memory chip makers will have to locate outside China, as the world’s leading supplier, TSMC, is now doing.
China is still a generation behind the current cutting-edge 3nm chips. But the technology gap is closing. AUKUS Pillar 2 focused research reveals that China is leading in high-impact research in 19 of these 23 technologies and has a commanding lead in hypersonics, electronic warfare and in key undersea capabilities.
The US hegemony over manufacturing, trade and technology is weakening. The position of the imperialist bloc of G7-plus nations in global GDP is now only twice as large as China compared to 300 times in 1970.

We can measure the relative change in the economic positions of the US and China over the last 40 years in value terms. Marxist economic theory first looks at the technical composition of capital (TCC) to see that relation. TCC measures the amount of fixed assets (machinery, structures etc) in money terms per worker employed. Back in the early 1990s, China’s TCC was no more than 3% of that of the US economy. Now, according to my latest estimates, it is over 38%. Still nowhere near on par, but at current rates China would close the gap within another 20 years at most.

When an economy has a huge technological advantage in its industries over another, Marxist economic theory argues that in world trade it can gain a transfer of value from countries it trades with that have lower technology (TCC). Given international prices for global trade, economies with a technological lead can gain from an unequal exchange (UE) of value.
The US runs a huge trade deficit in goods with China because it imports so many competitively priced Chinese goods.

But that has not been a problem for the US capitalism up to now because it gets a net transfer of surplus value (UE) from China even though it runs a trade deficit. Using world input-output tables, Rémy Herrera, Zhiming Long, Zhixuan Feng, Bangxi Li found that “inequality operated in U.S.-China trade over the period between 1995 and 2014. In total, transfers of international values largely took place for the benefit of the United States. Expressed in current dollars, at the end of the period, this “redistribution” approached $100 billion, or nearly 0.5 percent of U.S. value added.”
However, as China’s ‘technology deficit’ with the US began to narrow in the 21st century, US UE gains began to disappear. “China has indeed succeeded in significantly reducing the importance of this unequal exchange, with its disadvantage in the transfer of wealth gradually diminishing: the proportion of this unfavorable transfer in the Chinese added value fell from -3.7 percent to -0.9 percent between 1995 and 2014. As a matter of fact, China had to trade fifty hours of Chinese labor for one hour of U.S. labor in 1995, but only seven in 2014.”

The Herrera et al study was based on ‘static’ input-output’ data and only goes up to 2014. In 2021, G Carchedi and I did a similar study using a ‘dynamic’ model of UE going up to 2019. We found a similar fall in the negative transfer of surplus value from China to the US as the technology gap narrowed. During the post Great Recession years (what I have called the decade of the Long Depression), China’s value loss on UE fell 40% as a share of China GDP.
It is this fast-disappearing profit from trade with China that is the real driver of the US attack on the Chinese economy, its exports and semi-conductor industry. The US is losing its imperialist profit extraction from trade with China and increasingly being squeezed out of world markets by Chinese goods.
The decline in US hegemony in trade and production is repeating what happened to UK hegemony in the 19th century. In 1885, Friedrich Engels pointed out that when a capitalist economy is dominant worldwide, it is in favour of ‘free trade’, as Britain was from the 1840s to 1870s. But free trade breeds rivals and after the experience of the depression of the 1880s, British policy changed from ‘free trade’ to protectionist measures for its colonial empire. Engels perceptively identified that it was the depression of the 1880s that broke the British hegemony. “England’s monopoly of the world market is being increasingly shattered by the participation of France, Germany and, above all, of America in world trade, a new form of evening-out appears to come into operation.” (See my book, Engels 200).
Engels also made the point that even if Britain were to maintain its hegemony in the 19th century, it would be no way out for British capitalism. “The commercial crises would continue, and grow more violent, more terrible.” This is a lesson for now too. Even if the US were successful in weakening and curbing the rise of its major economic rivals, crises in its capitalist economy would still persist.
In the emerging American capitalism of the late 19th century, there was a case for protection, reckoned Engels. “it is also the only good aspect of protectionism – at any rate in the case of most of the continental countries and of America.” On the other hand, protection was no good if it stopped an economy from becoming competitive in world markets. And indeed, in periods of healthy capitalist growth, there was an acceleration in the globalisation of trade (and capital flows), as in the period 1850-70 and later from mid-1890s, and of course from 1980s. But in periods of depression, then protectionism becomes the cry, particularly if the hegemonic power is under threat, as was Britain from the 1890s or the US now.
The latest tariff measures won’t be the last. The US elite is determined to strangle the Chinese economy, not only to ‘protect’ its weakening industrial sectors, but also eventually bring about ‘regime change’ in China itself. The US reckons it still has time as China and the so-called BRICS nations are still well behind the economic and financial power of the US-led imperialist bloc.

But the cost to the US economy and the profitability of US industry will be considerable, and even more to the real incomes of Americans.
The international agencies like the IMF and the World Trade Organisation are worried for the future of the major capitalist economies. The IMF economists reckon a “severe fragmentation of the global economy after decades of increasing economic integration could reduce global economic output by up to 7%”, or about $7.4 trillion in today’s dollars. That’s equivalent to the combined size of the French and German economies, and three times sub-Saharan Africa’s annual output. The losses could reach 8-12% in some countries, if technology is also decoupled”. Even limited fragmentation could shave 0.2% off of global GDP now.

But America’s ruling elite see that cost as worthwhile if it brings China to its knees. The struggle between the emerging imperialist powers in the late 19th century ended in two world wars in the 20th century. The attempt of US imperialism to destroy the emerging economic and political power of China poses the same risk.
Michael Roberts's Blog

- Michael Roberts's profile
- 35 followers

