
Michael Roberts's Blog, page 7
January 24, 2025
Davos 2025: Trump v Von der Leyen
Every January, the World Economic Forum (WEF) convenes in the luxury ski resort of Davos, Switzerland. This year, as usual, some 3000 people attended from over 130 countries to discuss the problems, challenges and future of capitalism. Around 350 governmental leaders, including 60 heads of states and government, from all key regions (except Russia, China and India) were there, along with many chief executives and oligarchs of the multi-nationals, most arriving in their private jets.
This year, the usual topics of global warming and poverty hardly got a look in. What dominated the thought of the ‘great and good’ in the world economy was AI. The theme of the WEF 2025 was ‘Collaboration for the Intelligent Age’. AI is the buzz for the leaders of capitalism; the technology that is going transform economies with faster real GDP growth and productivity and this will bring prosperity for all – or so the hope is. The WEF launched a report, AI in Action: Beyond Experimentation to Transform Industry, arguing just that, with various caveats. The representatives of the AI leaders gushed. “The technology is moving at an incredible rate,” says Matt Garman, Chief Executive Officer of Amazon Web Services.
In previous posts, I have discussed the prospect of AI transforming economies over the next decade or so. Suffice it to say now that there is massive expenditure on AI development and the infrastructure involved being made by US and other AI companies to deliver. Companies will need hundreds of billions in new incremental AI revenues to maintain their current margins due to these new outlays. Projections from Lawrence Berkeley Labs show data center power demand doubling from its current 4.4% of US electricity generation, and Independent System Operators like PJM and MISO are scrambling to add new generation capacity based on what they’re seeing. But that could lead to a revenue gap that reduces profitability sharply – according to a study by JP Morgan.

AI investment is also hiking energy demand. By 2026, the International Energy Agency (IEA) predicts electricity consumption for data centres alone could reach 1,000 TWh – roughly the equivalent to the energy consumption of Japan. So ‘powering the Intelligent Age’ will be a huge task and will have a profound impact on global electricity demand and supply. It comes with wider implications for industries and their decarbonization and net zero goals, with rapidly advancing technologies devouring energy at rates far higher than those seen today. And then as discussed before, there are huge implication for jobs and labour incomes. AI investment could expand 160% over the next two years. As a result, datacenters’ use of water and land could have a serious impact on the environment.
Newly inaugurated President Donald Trump addressed the WEF by satellite and wasted no time in telling his audience that the US was going to enter a ‘golden age’ propelled by energy production, AI, deregulation and lower taxes – and countries that might seek to stand in its way better look out.

Trump said the US would need to double its energy production, partly to fuel AI. So he will fast-track the approvals for new power plants, which companies can site next to their plants – something not currently possible under regulations. Companies will be able to fuel it with anything they want, including coal as a backup, “good, clean coal”, because “nothing can destroy coal, not the weather, not a bomb”.
Trump wants to get the oil price down so that energy prices for investment (not so much for households) are lowered. To do this, he wants the US and the world to “drill baby, drill.” Unfortunately for him, that may not happen. Oil pipeline, gas pipeline and transmission line projects in the US have practically ground to a halt as the great shale and fracking revolution in US oil production has started to peter out. According to Goehring & Rozencwajg LLC, a research firm specializing in contrarian natural resource investments, US shale output is ‘in the early innings’ of a protracted decline, with depletion, not market dynamics or regulatory overreach, the chief culprit. They predicted that the explosive production growth triggered by the shale revolution would flatline in early 2025. However, the reality could be worse. According to data by the EIA, shale crude oil production peaked in November 2023 and has declined about 2% since then while shale dry gas production peaked that same month and has since slipped by 1% or 1 billion cubic feet per day.

What might save Trump’s demand for lower oil prices despite supply growth fading is that global demand growth for oil products is also dropping. Demand growth was hacked nearly in half in 2024 compared to 2023.

Lower energy prices could be important for Trump’s policies if it meant that inflation keeps falling and stays low. The problem is that, right now, the opposite trend is the case. The US headline inflation rate was rising in the last part of 2024, driven by a turn in energy and food prices and some underlying ‘sticky’ components like car and health insurance, rents and hospitality costs. The Federal Reserve is not winning the war against inflation.
Jack Rasmus has pointed out that the official US estimate of the rise in the price level for American household since 2020 is around 24%. But that number does not properly account the rise in prices for many basic food staples like bread, milk, eggs, chicken, etc. that have risen 30-40% since 2020. The true cost of shelter (home prices, rents) has risen even more. The prices for homes nation-wide are up 39% according to the Shiller home price index. But households’ mortgage costs—i.e. what households actually pay out of their monthly budgets— are up 113%! US official price indexes like the CPI do not include mortgage interest rates. Mortgage inflation due to rising interest costs has thus risen far faster and higher at 113% than the 39% for the price of buying a house. The inflation for shelter (houses and rents & related costs) is even higher if home insurance costs, home repairs, and other fees that define ‘shelter’ in government statistics are included. Interest rates on credit cards rose from 16% to 24%, bank auto loans roughly doubled to 9% on average for car purchases, while student loans surged to 6.8% and more. “When interest inflation is properly accounted for—along with increases in local government property and other taxes, fees, and other charges not considered by the government’s Consumer Price Index—the true inflation experienced by US households since January 2021 is easily 35%-40% and therefore much higher than the official CPI number of 24%.”
And then there are Trump’s plans to hike tariffs on imports, not just on producer goods from other countries, but also in key consumer sectors. That is very likely to put upward pressure on prices for households, unless the US dollar keeps rising in exchange value compared to other currencies. But that may not continue. Trump is demanding that the Federal Reserve cuts rates in 2025. If the Fed concedes, the dollar may fall as inflation rises – a conflict of outcomes for Trump. However, there are increasing indications that the Fed, still hoping to win the war on inflation, will hold interest rates where they are, despite Trump’s pressure, especially as Trump’s planned tariff hikes and deportations of undocumented migrant workers would push up prices and labour costs for US industry.
According to Vice President Vance, the Trump Administration plans to deport roughly 1 million undocumented workers per year. The current number of undocumented workers in the US is estimated at 11.7 million, but the rate of increase is falling.

The Immigration Council estimates that a deportation program could cost $88 billion per year if implemented. And as I have pointed out before, net immigration has been crucial to US economic growth in recent years. Cutting that back, the PIIE estimates, would lead to a real GDP decline of 1.2%-7.4% by 2028, with similar declines in employment as a result. Probably, however, deportations will not reach that level and ‘legal’ immigration of skilled workers will continue at some pace under Trump.

Trump’s domestic policies are much clearer to follow. He wants to make significant further cuts in income tax and corporate profits tax, while at the same time cutting back government spending, particularly at the federal level – classic neoliberal ‘trickle down’ economics.

Cutting government spending won’t be so easy as legions of neo-liberal governments have found. US government ‘discretionary’ spending is already slashed to ribbons. Welfare, medicare etc are ‘entitlement’ spends, much more difficult to reduce. Trump’s new cutting Tsar, Elon Musk, will find that the only areas he can cut are in defense spending! Federal employment of 3m people is at its lowest level as a share of US employment in 85 years (~2%). Within Federal workers, the largest employer is the Dept of Defense (excluding active military) followed by the Postal Service and Veterans Affairs. Musk’s most likely targets, the Environmental Protection Agency, Securities and Exchange Commission and the Department of Labor combined account for less than 1% of federal workers, while the Department of Education accounts for just 0.14%.

Talking of ‘defence spending’, in his Davos speech, Trump came back to his regular demand that European governments start paying for their own defence and to support Ukraine. He said he would demand that NATO members pay 5% of their GDPs in defence, more than doubling the current average. Such a shift in spending towards the military would be crippling for Europe’s public finances, when national governments in the EU are supposed to invest more on climate control and AI digitisation, while at the same time achieving primary fiscal surpluses over the medium run to meet EU fiscal rules.

Nevertheless, Trump ranted on about how Europe’s “regulatory regime” treated America “very badly” and “very, very unfairly with the VAT taxes and all of the other taxes they impose”. Europe’s regulation of US tech firms takes billions from Apple, Google and Facebook, he said. Europe doesn’t buy US farm products or US cars, but instead sends cars to the US by the millions. This results in “hundreds of billions of dollars of deficits” with the EU, so “We’re going to do something about it.”
All this made the Davos speech by EU Commission President Von der Leyen particularly feeble. She recognised that Europe was falling behind the US in new technologies investment.

“To sustain our growth in the next quarter of the century, Europe must shift gears.” She announced that the European Commission is about to present a roadmap to growth, called the Competitiveness Compass. What will this roadmap advocate for the ‘existential challenge facing Europe (Mario Draghi) and given Trump’s plans to trash Europe’s economies? It’s not more public investment, but instead a reliance on EU-wide private capital finance.
“Europe needs a deep and liquid capital market.” You see, European companies cannot raise the funding they need, “because our domestic capital market is fragmented” ie too small. What’s answer? The Commission wants to create a European Savings and Investments Union – “with new European saving and investment products, new incentives for risk capital and a new push to ensure the seamless flow of investment across our union.” So it’s more money for financial capital and more profits for investors.
The second policy move is to deregulate European industry: “too many firms are holding back investment in Europe because of unnecessary red tape.” The European single market still has too many national barriers, so Europe needs one single set of rules.
The third policy is to lower energy costs. You see, Russia cut off Europe’s energy supplies (!) and so costs have risen. And now the US provides over 50% of our LNG supply. Der Leyen admitted that “households and businesses saw sky-high energy costs and bills for many are yet to come down. Now, our competitiveness depends on getting back to low and stable energy prices.”

How is this to be done? With more ‘clean energy’ from renewables and new technologies, like fusion, enhanced geothermal and solid-state batteries; but not by more public investment but by mobilising “more private capital to modernize our electricity grids and storage infrastructure.”
So Europe’s answer to Trump is to rely yet more on US energy imports; to hope that the private sector will invest in new technologies because Europe will ‘deregulate’; and the financial sector will lend more for investment rather than speculate in financial assets. I leave you to judge how likely it is that this strategy will succeed.
The future, as painted in Davos by Trump and Von der Leyen, is one of more barriers to trade between countries; and more deregulation so that bankers and industrialists can do what they want, whatever the damage to consumers safety and rights and whatever the impact on the environment and the climate. Von der Leyen said that the Paris Agreement on climate targets was vital to maintain (even though its target limit was passed in 2024), while Trump has taken the US out of the agreement (again). More to the point, relying on the private sector to deliver on increased investment in technology and climate control to turn the world economy around will prove, yet again, to fail.

Meanwhile, inequality of wealth and incomes around the world continues. Every year at Davos, Oxfam presents a damning report of inequality and every year the attendees at Davos generally ignore it. This year Oxfam economists found that “billionaire wealth has risen three times faster in 2024 than 2023. Five trillionaires are now expected within a decade. Meanwhile, crises of economy, climate and conflict mean the number of people living in poverty has barely changed since 1990.” The report pointed out that most billionaire wealth is taken, not earned – “60% comes from either inheritance, cronyism and corruption or monopoly power.” The wealth of each of the richest 10 men has grown by almost US$100 million a day in 2024 on average. “Even if you saved US$1,000 daily since the first humans, 315,000 years ago, you still would not have as much money as one of the richest ten billionaires. If any of the richest 10 billionaires lost 99% of their wealth, they’d still be a billionaire.”

UK finance minister Rachel Reeves also rolled up to Davos. At a breakfast event on the second day, someone asked Britain’s chancellor how she felt about “wealth creation” – was she relaxed, in a Blairite sense? “Absolutely,” Reeves replied. “Absolutely relaxed.” Apparently, the grotesque level of wealth in the Oxfam report and openly shown by the oligarchs attending Davos did not worry her. She reminded me of a previous Labour minister in Tony Blair’s government, Peter Mandelson (now ironically UK ambassador to Trump’s US), who once infamously said that he was “intensely relaxed about people becoming filthy rich”… “if they paid their taxes” (which, of course, they hardly do).

IMF chief Kristalina Georgieva was also at Davos, of course. She reminded a select group of global political, business, and civil society leaders of Keynes’ words from a 1930 essay, written against the backdrop of the Great Depression, the rise of communism and fascism, and national and international despair. She loves quoting Keynes. This time she quoted: “I predict that both of the two opposed errors of pessimism which now make so much noise in the world will be proved wrong over time: the pessimism of the revolutionaries who think that things are so bad that nothing can save us but violent change, and the pessimism of the reactionaries who consider the balance of our economic and social life so precarious that we must risk no experiments.” Apparently, there is a middle way of optimism that does not require revolution, but does require change.
Keynes wrote this after a speech to his students at Cambridge urging them not to accept Marxist critiques and remain optimistic that capitalism would take humanity forward. What followed after 1930 was a deep depression in the major economies, the rise of fascist and nazi forces, WW2 and the holocaust. Let’s hope that Georgieva’s reference to Keynes does not herald a repeat of that in the 2030s.


January 20, 2025
Inequality in the 2020s
Empirical evidence on economic inequality has mushroomed in the last two decades. I refer here to economic inequality (income and wealth) as opposed to social inequality (life expectancy, access to health and education, levels of pollution etc), because the former drives the inequalities in the latter.
Economic inequality can be looked in several different ways. First, there is inequality of incomes earned (wages and profits); then there is inequality of net personal wealth (assets owned after debt is accounted for); then there is inequality of capital assets (the size of companies and ownership of stocks). Then there is global inequality ie the inequality of income and wealth between nations; and inequality of income and wealth within nations. Inequality is a relative measure, not an absolute one.
Let’s take inequality of incomes first. The basic measure of income inequality is the Gini coefficient of income inequality, which captures the overall fairness of the distribution. A gini coefficient of one would mean all income received in any one year went to just one person. A coefficient of zero would mean that income was equally shared by all. All countries in the 21st century have a coefficient between these two extremes.
Recently much has been made by some mainstream economists that this coefficient has been either flat or falling for the past two decades in Britain, America and much of western Europe. The ratio between the earnings of the top and bottom 10 per cent has also flattened out; if anything, it has been falling. World Inequality Report data show that the share of national income going to the richest ten percent has increased in nearly every country from 1980. But that inequality of income appears to have flattened out since 2010.

The reason is not a reversal of rising inequality; it’s because the disparity between earnings at the very top of the income scale and the middle-income groups has trended wider since the turn of the millennium, while the gap between the bottom and the middle has narrowed. The super earners are pulling away from the middle (up from 6x to 7x) and lower-income earners have reduced the gap with the middle (from 5x to 4x).

Sustained increases in the minimum wage have been a big part of this story in Britain. And in both the US and the UK, low-skilled workers have benefited (and middle-skilled workers suffered) from a ‘hollowing out’ in the middle of the jobs distribution. In the US, the highest-paying jobs are increasingly shared among a handful of ultra-high-status occupations. Tech workers now account for one in six of the top 5% of salaries, up from one in 20 in 1990. No single group had this dominance in the past.
None of this does away with the clear increase in income inequality within countries that has happened nearly everywhere since the 1980s. The poorest 50% of the population consistently lags behind the top 10% of the population in every region, even though this gap is more pronounced in the Middle East, Latin America, and Africa, compared to Europe. Worldwide, the top 10% of income earners take more than 50% of all income received, while the bottom 50% take just 5%.

Within some countries, inequality has reached extreme levels. For instance, South Africa ranks as one of the most unequal countries, with the richest 10% capturing 65% of national income. Yemen also exhibits significant inequality, with the top 10% earning 59.5% of income and the top 1% alone claiming 25%.

In the OECD, the US is the most unequal country in the OECD, with 21% of national income going to the richest 1% – the same as in Mexico (21%), and slightly more than in South Africa (19%).
Then there is global inequality of incomes, ie the disparity between incomes for adults in poor and rich countries; and in average incomes in each country. In 2023, the global average per capita national income (including the ‘in-kind’ value of public services) stood at about €12,800 per year (PPP), or €1,065 per month. However, this figure hides huge disparities between regions. For example, the average income in Sub-Saharan Africa was just €240 per month, compared to over €3,500 in North America and Oceania, a difference of 1 to 15.
Rapid economic growth in Asia (particularly China and India) has lifted many people out of extreme poverty. But the global richest 0.1 percent and 1 percent have reaped a much greater share of the economic gains, according to the World Inequality Report. In 2020, the richest 1 percent pocketed 20.6 percent of global income, up 2.8 percentage points since 1980. The top 0.1 percent pocketed 8.59 percent in 2020, up 1.98 percentage points since 1980. These ultra-rich individuals did take a hit in the 2008 financial crisis, but the richest top 0.1 percent have nearly regained the global income share they enjoyed in 2007.

The COVID-19 pandemic, the ensuing inflation and the rise in international conflicts have meant that global ‘extreme poverty’ rates have actually risen over the last four years. Declines in the less-extreme forms of global poverty more common in middle-income countries have continued, but at a much slower pace than during the 2010s. Unless something changes, the World Bank warns of a possible “lost decade” for ‘the war’ on global poverty.
Annual per-capita output in the US is $73k—roughly 26 times the average for the low-income countries. Even lower-middle-income countries like India, Nigeria, and the Philippines average only one-ninth of America’s economic output. That lower GDP represents less consumption of food, healthcare, and technology, less investment in infrastructure, education, and housing, and less general welfare for billions of people across the globe.

Inequality of incomes both between countries and within countries pales into comparison with inequality of wealth. As I have reported before, the latest UBS Global Wealth Report shows that the top 1.5% of personal wealth holders take around 48% of all global personal wealth, while the bottom 40% of the world’s population own nothing (after debts).

“Ultra high net worth individuals” — the wealth management industry’s term for people worth more than $30 million — hold an astoundingly disproportionate share of global wealth. These wealth owners held 6.5 percent of total global wealth, yet represent only a tiny fraction (0.003%) of the world population.

While wealth concentration is increasing in nearly every country, it takes significantly more wealth to rank among the top 1% in different countries. According to the Knight Frank Wealth Report, in the US, you need to be sitting on at least $5.8 million to join this elite club. That’s 5.4 times as much as the minimum needed to be in the top 1% in China, the second largest economy and 1.5 times as much as in Germany, the third-largest economy.

The world’s 26 richest billionaires, according to the latest UBS Global Wealth Report, owned an astonishing $2.872 trillion in wealth, as of 2023. This combined wealth is greater than the total goods and services most nations produce on an annual basis, according to World Bank GDP data.

Compared to other countries, the US saw the largest expansion of its billionaire class in 2024, according to the UBS Billionaire Ambitions Report. By the Switzerland-based investment bank’s count, the number of American billionaires rose from 751 in 2023 to 835 in 2024. By contrast, China’s nine-digit club shrunk from 520 to 427 as a real estate crisis and financial market turmoil pushed many newly minted members below the $1 billion mark.

OECD statistics show that the top 1 percent in the US holds 40.5 percent of national wealth, a far greater share than in other OECD countries. In no other industrial nation does the richest 1 percent own more than 27 percent of their country’s wealth.

China has had rapid growth in this top wealth tier. But while that country has more than four times as many people as the US, the number of high net-worth Americans is 4.8 times greater than the number in China.

It’s almost impossible to grasp the magnitude of US wealth inequality. Think of it this way: $100,000 saved for retirement is a 4.3-inch stack of $100 bills; $1M is 43 inches; and $1billion is 3,600 feet ie 12 football fields (the world’s tallest building is 2,722 feet). Yet Elon Musk has $486bn; that’s 330 miles high or 60 Mt. Everests stacked!

And when you use the gini index for both income and wealth for each country, the difference is staggering. Take a few examples. The gini index for the US is 37.8 for income distribution (pretty high), but the gini index for wealth distribution is 85.9! Or take supposedly egalitarian Scandinavia. The gini index for income in Norway is just 24.9, but the wealth gini is 80.5! It’s the same story in the other Nordic countries. The Nordic countries may have lower than average inequality of income but they have higher than average inequality of wealth.

Which countries have the worst inequality in personal wealth? Here are the top ten most unequal societies in the world.

You might expect to find some of these countries listed here in the top ten: ie very poor or ruled by dictators or the military. But the top ten also includes the US and Sweden. So both a ‘neoliberal’ advanced economy and a ‘social democratic’ economy make the list: capitalism does not discriminate when it comes to wealth.
Nevertheless, the US stands out as leader in the top G7 advanced economies in wealth and income inequality.

Indeed, can we discern whether high inequality in wealth is closely correlated with inequality in incomes? Using the WEF index, I found that there was a positive correlation of about 0.38 across the data: so the higher the inequality of personal wealth in an economy, the more likely that the inequality of income will be higher.

The question is which drives which? This is easily answered. Wealth begets wealth. And more wealth begets more income. A very small elite owns the means of production and finance and that is how they usurp the lion’s share and more of the wealth and income.
Another important aspect of wealth inequality is that is mainly achieved by inheritance through generations. Donald Trump became a billionaire because his father was already near being one; Elon Musk got going with millions in support from his father. The American dream of rags to riches through hard work and entrepreneurial skills is just that a dream, not reality.
And a study by two economists at the Bank of Italy found that the wealthiest families in Florence today are descended from the wealthiest families of Florence nearly 600 years ago! So the same families are still at the top of the wealth pile starting from the rise of merchant capitalism in the city states of Italy through the expansion of industrial capitalism and now in the world of finance capital.
And talking of the shockingly high inequality of wealth in ‘egalitarian’ Sweden, new research from there reveals that good genes don’t make you a success but family money, or marrying into it, does. People are not rich because they are smarter or better educated. It is because they are either ‘lucky’ and/or inherited their wealth from their parents or relatives (like Donald Trump). Researchers found that “wealth is highly correlated between parents and their children” and “Comparing the net wealth of adopted and biological parents and that of the adopted child, we find that, even prior to any inheritance, there is a substantial role for environment and a much smaller role for pre-birth factors.” The researchers concluded that “wealth transmission is not primarily because children from wealthier families are inherently more talented or more able but that, even in relatively egalitarian Sweden, wealth begets wealth.”
But as I have argued before, wealth concentration is really about the ownership of productive capital, the means of production and finance. It’s big capital (finance and business) that controls the investment, employment and financial decisions of the world. A dominant core of 147 firms through interlocking stakes in others together control 40% of the wealth in the global network according to the Swiss Institute of Technology. A total of 737 companies control 80% of it all. This is the inequality that matters for the functioning of capitalism – the concentrated power of capital. And because inequality of wealth stems from the concentration of the means of production and finance in the hands of a few; and because that ownership structure remains untouched, any increased taxes on wealth will always fall short of irreversibly changing the distribution of wealth and income in modern societies.
The power of capital also exerts itself internationally between nations. Excluding countries with a population of less than 10 million, the ten richest countries all receive positive net foreign income on their capital. In contrast, the world’s ten poorest countries are former colonies, most located in Sub-Saharan Africa. They display the opposite trends compared to the richest. Most of these countries pay significant net foreign income to the rest of the world. In other words, these countries are sending out more money than they are receiving from foreign investments. This drain limits their capacity to invest in areas such as infrastructure, healthcare, and education – key to lifting them out of poverty. No wonder they can never ‘catch up’ and close the gap with the Global North.
Another of the by-products of this grotesque level of income and wealth concentration is that the poorest 50 percent of the world population is responsible for just 12 percent of global carbon emissions, but is exposed to 75 percent of income losses (relative to what incomes would be in a world without climate change).

By contrast, the world’s richest 10 percent accounts for close to half of all emissions, but faces just 3 percent of relative income losses, according to analysis by World Inequality Lab. Thus we have a clear example of how economic inequality breeds social inequality and takes the bulk of humanity and nature close to the brink.
January 14, 2025
The exceptional economy
Next week US president Joe Biden finishes his term of office, to be replaced by the Donald. Biden would have been extremely popular with the American public and probably would have run and got a second term as president, if US real GDP had increased by 4.5-5.0% in 2024, and if during the whole of his period of office since end 2020, real GDP had risen 23%; and if per American, real GDP had risen 26% over those four years. And he would have been congratulated if the Covid death rate during the 2020-21 pandemic had been one of the lowest in the world, and the economy avoided the pandemic slump in production.
Above all, he would have been feted if the inflation of prices in goods and services after he came into office was just 3.6% in total over four years. That would have meant that, with wages rising at 4-5% a year, real incomes for average American households would have risen significantly. At the same time, strong growth would have allowed the financing of important new infrastructure spending in the US that could have led to an extensive rail network across the country using super fast trains; and with bridges and roads that did not collapse or crumble along with environmental projects to protect people and homes from fires and floods, and the introduction of cheap electric vehicles and renewables. How Biden would have been popular.
And with extra revenue from strong growth, the Biden administration would have been able to balance the government budget and curb or reduce government debt. And with zero to low inflation, interest rates on borrowing would have been near historic lows, enabling households and companies to afford mortgages and finance investment in new technologies.
And what if US companies had sold a record level of exports of goods and services to the rest of the world, running up a sizeable surplus on trade, despite various tariffs and sanctions against American companies from other trading nations. In running trade surpluses, American banks and companies would have been able to build up foreign exchange reserves and invest in projects abroad, strengthening America’s influence in the world in a beneficial way.
Unfortunately, none of these things happened to the US economy in the four years of Biden’s presidency. Instead these were features of China’s economy. In 2024, China’s real GDP rose about 4.5%, while the US was up 2.7% (faster than anywhere else in the top G7 economies, but still only 60% of China’s growth rate). And throughout Biden’s term, China growth rate outstripped the US.

Moreover, the gap betweeen China and the US on real GDP growth per person was even greater.

US annual inflation has been way higher than in China. Indeed, US prices rose a cumulative 21% since 2020 compared to just 3% in China.

Interest rates set by the US Fed are still at 4.5%, while the People’s Bank of China has a 3% rate. And interest rates on mortgages and corporate debt in the US are well above 5% compared to 1.5% in China. Average real disposable income in the US has been flat since 2019, while it has risen 20% in China. Under Biden, bridges fall down, roads crumble and rail networks hardly exist. Far from running a trade surplus of $1 trillion as China does, the US runs a sizeable trade deficit of $900bn.

While China runs a surplus on payments and receipts with other countries or around 1-2% of GDP a year, the US runs a current account deficit of 3-4% of GDP a year. At the same time, US industry and banks have huge net liabilities with the rest of world at 76% of GDP. Such a net liability would put all other countries vulnerable to a run on their currencies – but the US escapes this because the US dollar remains the world reserve currency. In contrast, China has a net asset position of 18% of GDP.
And yet, despite all this, we are continually told by Western ‘expert’ economists and the media that China is on the brink of financial meltdown (George Magnus); or alternatively going into permanent stagnation like Japan has done over the last three decades (Michael Pettis); and that China is producing too much that it cannot sell ie. it has overcapacity (Brad Setser). And China has a corporate debt crisis that will eventually bring the whole economy down (said by just about everybody). And China will stagnate because of a ‘lack of demand’, even though wage and consumption growth is way faster than in the US.
The Western consensus is that China is mired in huge debt, particularly in local governments and real estate developers. This will eventually lead to bankruptcies and a debt meltdown or, at best, force the central government to squeeze the savings of Chinese households to pay for these losses and thus destroy growth. A debt meltdown seems to be forecast every year by these economists, but there has been no systemic collapse yet in banking or in the non-financial sector. Instead, the state-owned sector has increased investment and the government has expanded infrastructure to compensate for any downturn in the over-indebted property market. If anything, it is America that is more likely to burst a bubble than China.
And as for ‘Japanication’, this is also nonsense. In 1980s Japan, companies used property and land to lever up and buy more commercial property or expand into other economically unviable projects. When the bubble collapsed, the corporates and the banks carried the weight of the downturn. In contrast, the problems In China are in residential property, not in commercial.

Hence, China’s real estate prices never went up as much as during the land speculation frenzy in Japan in the 1980s. Average residential sales prices per square meter have risen 7.3% annually since 2007, well below the increase in annual nominal GDP of about 12% over that same period. In Tokyo, home prices grew 13% annually, well above nominal GDP growth of about 8% in the 1980s.
While Japan’s productive base declined from the 1990s, that is not happening in China. China is now the world’s manufacturing superpower. Its production exceeds that of the nine next largest manufacturers combined. It took the US the better part of a century to rise to the top; China took about 15 or 20 years. In 1995, China had just 3% of world manufacturing exports, By the beginning of Biden’s term, its share had risen to over 30%.

Then there is China’s so-called demographic challenge of a declining workforce and population. But this decline is nowhere as severe as in Japan. China’s birth rate has been comfortably higher than those of Japan and the Asian tigers. China’s population under 20, at 23.3%, is still considerably higher than its Asian counterparts (16-18%) and not so far behind the US (25.3%) and aboce Europe (21.9%). The country’s 65 and older population, at 14.6%, is also lower than that of the developed world (20.5%).
As for so-called overcapacity, this is another myth broadcast by Western experts. China’s export success does not mean that China depends on exports for growth. China is growing mainly because of production for the home economy.
Remember, China’s economy has never suffered a decline in national output since 1949. And as John Ross has pointed out, if the Chinese economy continues to grow 4-5% a year over the next ten years, then it will double its GDP – and with a falling population, raise its GDP per person even more; ie more than two and half times as fast as the US.
Why is China exceptional? It is because it is an economy that is planned and led by state-owned companies, so it can ride most obstacles way better than a privately owned system of capitalist production as in the US. (Compare the US COVID death rate at 3544 deaths per million to China’s 85 (latest figures). China’s most important industries are run by SOEs: finance, energy, infrastructure, mining, telecommunications, transportation, even some strategic manufacturing. The total capital of companies with some level of state ownership in China is 68% of total capital of all firms (40 million). The vast majority of Chinese companies in the Fortune Global 500 list are SOEs. SOEs generate at least 25% of China’s GDP in the most conservative estimates, and other studies have found them to contribute to 30-40+% of GDP.

Donald Trump takes over next week in the US. He wants to make America great again. He wants to make America ‘exceptional’. But that adjective best describes China, not the US.
January 7, 2025
ASSA 2025 part two: the radical – climate, labour and imperialism
In part two of my report on the proceedings of ASSA 2025, I look at the sessions of radical economics organised by the Union of Radical Political Economics. I was unable to attend or link to any of these sessions, so this post is based on a review of the abstracts and papers submitted.
Unlike the mainstream sessions at ASSA, the issues around artificial intelligence (AI) did not appear in the radical sessions. Instead it was climate change, inflation, financialisation and imperialism.
On climate change, David Cayla of the University of Angers argued that the ecological transition from fossil fuels was less a matter of financial resources and more about allocating physical resources and human labor towards goods and services that may not provide immediate consumer gratification. How can we organize a new economic model, emphasizing ecological investment over consumer comfort, without necessarily resorting to global de-growth?
Organizing the climate transition in just a few decades could be compared to entering a war economy. This imposes serious constraints on the economy’s capacity to produce consumer goods and services. Cayla denied the need for any radical transformation of the social structure of capitalism because the war economies of WW2 showed that the market can function under constraining conditions. “Of course, it is always possible to imagine another economic system; however, even if achieving the ecological transition imposes enormous constraints on the economy, this does not mean that it is in itself, or by nature, incompatible with the market economy.” Really? All the recent works by eco-socialists compellingly show just that, in my view.
In another presentation, John Willoughby of the American University rejected Friedrich Engels idea that “economic life can be organized based on a democratic popular plan” as it “overly simplifies the complexity of economic organization and grievously misleads advocates of socialist organization.” Willoughby returns to the theory of ‘market socialism’ using market prices to allocate resources in a socialist economy. “Marx and Engels’ utopian vision rests on their inadequate appreciation of the complexity of planning, and their disdain for all the anti-social effects of market organization. While the latter is a compelling critique, it is one-sided and ultimately unconvincing. A regulated market will be an indispensable institution for a new socialist order in which workers are able to manage a greater part of their own affairs.” Hmm…
Ali Alper Alemdar of St. Francis College looked at the profitability of ‘digital labor platforms’. He argued that platform workers are crucial to profitability, enabling higher fees, more potent network effects, and higher data accumulation, essential for expanding platform capital and achieving profitability. Indeed, platform capital is the backbone of profitability.
Debamanyu Das of the University of Massachusetts-Amherst argued that, as the energy transition advances, the stronger will be the need for critical minerals, leading to a race between countries for capturing these minerals. This was a new form of imperialism emerging. Core advanced nations (and China) are shifting focus from acquiring territories to acquiring mining corporations in peripheral countries, many of whom were formerly colonies of the imperial powers, resulting in the concentration of power in the hands of a select few multinational corporations.
Michele Naples of the College of New Jersey looked at the efficacy of the Keynesian theory of inflation supported by some in the mainstream discussion (see my post). Her study showed a strong negative impact of inflation on real wage growth. Inflation is always redistributive, it cannot create new value, only reallocate whatever real income there is. When inflation accelerates, the Fed intervenes to slow economic activity. This prevents workers from getting higher nominal wages. In 2021, when the Fed initially allowed price increases, it tightened credit conditions, claiming to prevent a wage-price spiral. Naples confirmed what many other studies have shown: namely that inflation predominantly increased profits and very little was accounted for by wage changes, contrary to Keynesian theory.
Bhavya Sinha of Colorado State University highlighted the trend of declining labour shares across countries and industries due to offshoring and subcontracting productive activities across borders. Exclusive rights to resources that are abundant in developed economies are protected via institutional arrangements but the labour force is increasingly subordinated to global capital. The share of value added thus continues to be weighted towards developed economies that not only protect exclusive rights on knowledge inputs through patents and copyrights but also influence the choice of technology in liberalized global markets.
Sinha assessed the impact of this on the labour share in countries. He found parallel trends of rising foreign value added in gross exports, rising backward linkages in global value chains (GVCs) and declining labour shares across regions of the world over the period 1995-2018. So increased integration into GVCs was negatively associated with labour shares of value added.

This globalization of production extended the system of unequal exchange between industries and countries to between labor and capital within an industry across countries.
On climate change, Robin Hahnel of the American University addressed the relationship between climate policies at different levels. No country can solve the problem of climate change on its own because reducing carbon emissions is a global public good which creates a perverse incentive for every country to attempt to ‘free ride’ (not reduce its own emissions), and instead wait to benefit when other countries reduce their emissions. Therefore, we need effective international cooperation.
Hahnel pointed out that only two countries were responsible for more than 10% of global carbon emissions in 2015 — China was responsible for 30% and the US was responsible for 15%. China emitted more than the US. But the population of the US was only 325 million in 2015, and the population of China was 1.4 billion – more than four times as large! Emissions per capita was only 7.7 tons in China, but was 16.1 tons in the US. And if we compare cumulative emissions from 1970–2015, the US ranks first, the countries that now comprise the European Union rank second and China is a distant third, even though China has a much larger population than either the US or the EU.
The problem of dealing with climate change is not that we do not know what solutions are – at the international, national, and state levels. The problem is not that we need to resort to untested technologies like carbon capture and storage or geoengineering. The problem is simply overcoming the political obstacles that stand in our way to launching any program both internationally and domestically. The most important obstacle is the fossil fuel industry. Having said that, Hahnel strangely concluded that “fortunately, all this can still be done without replacing capitalism globally or in the United States, because that will take more time than we have to prevent climate change before it is too late.” But perhaps the latter will require the former?
Robert Pollin of the University of Massachusetts-Amherst looked at the policies needed to support workers losing their jobs in energy transition. He reckoned that workers should be provided with three critical guarantees to accomplish this: no loss of jobs, compensation and pensions. Current transition policies do not provide such guarantees for assuring workers that they will not experience major living standard declines. And yet, the cost of ‘just transition’ is not high, according to Pollin, using a study of West Virginia’s fossil fuel industry dependent workers. It would amount to an annual average of about $42,000 per worker, or about 0.2 percent of West Virginia’s GDP. For the U.S. economy overall, a ‘just transition’ programme’s costs would total to about 0.015 percent of GDP.
There were also several presentations on debt and finance capital, all based on post-Keynesian financialisation models, which I don’t propose to discuss yet again in this post.
That’s it really all from the radical sessions: something on climate change; on financialisation; on imperialist exploitation; on planning; but nothing on AI – the key subject taken up by the mainstream. An interesting contrast: the mainstream looks for a saviour for capitalist slowdown; the heterodox and radical look at the contradictions within capitalist production..
January 6, 2025
ASSA 2025: part one – AI, AI, AI..
Every year, I report on the annual proceedings of ASSA, the Alliance of Social Science Associations, run by the American Economics Association. It is the biggest economics conference in the world, with over 13,000 economics students and professors attending and hundreds of papers presented in sessions over three days. And there are addresses by the ‘great and good’ of mainstream economics, attended by hundreds. But also, there are sessions organized by radical economics groups, attended by handfuls.
This year the conference in San Francisco was dominated by one theme: artificial intelligence (AI). Previous conferences have concentrated on climate change or economic growth or inflation. Not this year, and this is no surprise as AI is seen by mainstream economics as the likely great saviour of capitalism in the major economies. The hope is that poor economic growth in the major economies, particularly in the productivity of labour and productive investment, can be overcome by a boom in AI investment and the consequent huge and sustained productivity boost that AI will deliver, thus transforming economic expansion through the rest of this decade and beyond: an AI-driven revolution.
So there were many sessions on how AI would affect the future of work and on its impact on the wider economy. In one web recorded session, several top economists in the field outlined AI’s impact. Tom Mitchell of Carnegie Mellon University told the large audience that AI was a powerful and fast-developing technology, that was not perfect and not always accurate, but it was improving fast. AI was likely to automate routine tasks — like tracking inventory or stocking warehouses — and partially automate high-skill tasks, like writing legal documents. AI could help workers whose jobs require judgment, problem-solving and decision making — like teachers, health technicians, or customer service agents — do their jobs better. As AI gets better and is applied in more ways or leads to other innovations, it would make people more productive. The speed of that change, however, remains uncertain and there is no guarantee that any benefits will be shared equally. “AI raises big questions about fairness, privacy, safety, national security and civil discourse. How society handles these concerns will shape how much AI affects our lives and jobs.” Indeed.
John Horton (Massachusetts Institute of Technology) argued for AI-based economic forecasts. They “align closely with the accuracy and distribution of human predictions, and perform especially well at medium-and long-term horizons, often outperforming human forecasts.” So AI economic forecasting could be a low-cost alternative to human forecasting (not good news for economists).
In another session on the economic implications of AI, Alena Wabitsch (University of Oxford) examined the link between labour market developments and AI in 16 European countries over the period 2011- 2019. She found that only very few countries show a decline in employment shares of occupations more exposed to AI-enabled automation. So positive news. In contrast, Pamela Mishkin from Open AI looked at Generative Pre-trained Transformer (GPT) models and found that approximately 80% of the US workforce could have at least 10% of their work tasks affected by the introduction of GPTs, while around 19% of workers may see at least 50% of their tasks impacted. Not so good. Longji Li (IMF) in another study found that the advanced economies faced higher exposure than the so-called emerging economies due to a higher employment share in professional and managerial occupations. Workers in the upper tail of the earnings distribution were more likely to be in occupations with high exposure, but also could potentially gain from AI.
Most interesting were the presentations by Susan Athey from Stanford University. She argued it was difficult to measure just what the causal effect of AI would be on productivity and work. “AI has enormous positive potential for society,” Athey said in her opening remarks, noting the value of AI-driven solutions related to education, training, remote work, government services, medicine, and other areas.

But while that might mean a wider array of general-purpose applications, from retail recommendations to medical-outcome predictions, it also meant more ‘black-box processes’ within the AI model that even the engineers building them might not fully understand. She worried that “Businesses may be indifferent between a worker and a machine from a cost perspective. And if they’re indifferent, they’ll go with the machine to protect their bottom line.” Indeed, we “can’t always count on companies to take the longer-term perspective.”
Athey outlined forks in the road for the impact of AI. The first fork was economic growth, particularly productivity growth. “Boosting productivity growth may be the globe’s most fundamental economic challenge.” But the impact of AI on this could be limited. Despite the rapidly improving technical capabilities of AI, its adoption by businesses may continue to be slow and confined to large firms. The economics of AI may turn out to be of a very narrow labour-saving variety. Displaced workers might disproportionately end up in even less productive and less dynamic jobs, further muting any aggregate benefit to the long-term productivity growth rate of the economy.
On the other hand, AI could end up complementing workers—freeing them to spend more time on nonroutine, creative, and inventive tasks rather than just replacing them. As a result, more workers can spend more time working on novel problems and a growing share of the labour force would increasingly come to resemble a society of research scientists and innovators. The result is an economy not simply at a higher level of productivity, but at a permanently higher growth rate.
The second fork was income inequality. In the first scenario, AI leads to higher income inequality. Technologists and managers design and implement AI to substitute directly for many kinds of human labour, driving down the wages of many workers. The number of jobs under threat from AI competition eventually grows much larger. Or alternatively, AI leads to lower income inequality because the main impact of AI on the workforce is to help the least experienced or least knowledgeable workers be better at their jobs. If employers shared these gains with workers, distribution of income would become more equal.
The third fork was industrial concentration, which has risen dramatically in many advanced economies. AI could make this worse as only the largest firms intensively use AI in their core business. Alternatively, if open-source AI models become widely available, this would give small businesses access to industry-leading production technologies they could never have had before.
Doubts about the speed of any impact on economies were high. Diane Coyle of Cambridge University reckoned that “we should temper our expectations about AI’s economic impact, at least in the foreseeable future. Although the AI industry itself is poised to grow rapidly, there is little reason to expect that it would significantly boost GDP growth in the short or medium term.” James Manyika from Google reckoned that “Right now, everyone from my old colleagues at McKinsey Global Institute to Goldman Sachs are putting out these extraordinary economic potential numbers — in the trillions — [but] it’s going to take a whole bunch of actions, innovations, investments, even enabling policy . . . The productivity gains are not guaranteed. They’re going to take a lot of work.” The use of generative AI to draft software code is not enough. “In the US, the tech sector is about 4 per cent of the labour force. Even if the entire tech sector adopted it 100 per cent, it doesn’t matter from a labour productivity standpoint.” Instead the answer lies with “very large sectors” such as healthcare and retail.
All these presentations suggested to me that mainstream economics has no idea what the impact of AI will be. As Athey said: “we want to emphasize how deeply unpredictable the future of this technology is…We have raised more questions than we have answered, which reflects, in part, the nascent stage of AI adoption and impact.” This has been the argument of other doubters like recent Nobel prize winner Daren Acemoglu.
The other big topic of the mainstream part of the conference was on the causes of the recent post-COVID pandemic inflationary spike, on the efficacy of the response of the monetary authorities and whether inflation could return to pre-pandemic levels and/or meet the official central bank targets of 2% a year,or not.
There was a gathering of famed mainstream American economists to discuss this. Former Federal Reserve Chair and now fellow of the Brookings Institution, Ben Bernanke reckoned that the recent acceleration of inflation had been caused by a ‘supply shock’. He referred to a paper that he and former IMF chief economist Olivier Blanchard had produced to confirm this empirically. Rising inflation was not primarily cause by excessive demand but by supply shortages. This meant that the spike was ‘transitory’ and central bank monetary policy of tightening interest rates would not cause a recession. He did not explain why, if that were the case,why hike interest rates as the Fed had done, if inflation were the result of temporary energy and food price rises along with supply chain blockages after the end of the pandemic.
John Cochrane of the right-wing neoclassical Hoover Institution wasted no time in rejecting Bernanke’s view. Inflation did not accelerate because of price rises in food and energy. They were just changes in ‘relative prices’ in a few sectors. What caused inflation across the board was the high government spending built up during the pandemic and afterwards, along with a huge money supply boost to fund this spending. Inflation was the fault of the ‘accommodation’ of the monetary authorities. If the government has not boosted spending and the Fed had not boosted money supply, then inflation would have fallen away because there would have been no spending power among households.
Christina Romer of the University of California-Berkeley took a position between these two stools. Yes, there were supply disruptions and we also had a fiscal expansion. Yes, there were supply shortages, but we also got a massive demand boost from government spending for all, which was not targeted. People could spend more after the pandemic was over, but in a period of shortages. And monetary ‘accommodation’ supported that. The Fed was too slow to raise rates due to its previous policy of trying to get inflation up pre-pandemic.
Jason Fulman, former White House chief economist, also argued that inflation was mainly demand-led. Fiscal spending rose by 10% of GDP along with a build-up of household savings available to spend of another 6% of GDP. When all this was released, spending outstripped an economy with an output gap of only 3% of GDP, causing inflation.
Ben Bernanke fought back. Inflation was ‘exogenous’ not the result of domestic fiscal spending. Without the fiscal and monetary response, there would have been a huge rise in unemployment. The Fed’s policy of ‘quantitative easing’ was not ‘monetary accommodation’ to help excessive fiscal spending, but the Fed response to avoid unemployment. Cochrane reiterated his argument that it was a choice made by the authorities: they spiralled fiscal spending with no indication that it would be reversed. Instead, fiscal austerity was needed and monetary easing should have been avoided. The authorities should have followed the policy of Fed chair Volcker in the late 1970s when he hiked interest rates and advised tight fiscal policy. That stopped inflation. Bernanke reacted that trying to control the fiscal balance never works in controlling inflation or employment (so much for Keynes!) and Volcker’s policy only led to a slump. Cochrane responded that higher output actually comes with lower inflation; Keynesian theory is wrong.
What will happen to inflation now? Everybody agreed that inflation rates looked ‘sticky’ and will not get back to 2% a year any time soon. But everybody also agreed that Trump’s proposed tariff rises and tax cuts will have only a modest effect on growth and inflation. Indeed, the last time there were high tariffs in the 1930s it was in a period of deflation. Going forward, Cochrane wanted fiscal austerity ie running budget surpluses to reduce government debt. He denied that this would promote a slump. All seemed to agree that the Fed should follow some rules aiming to find the equilibrium point for interest rates that kept unemployment and inflation low. Bernanke reckoned that current Fed chair had it right: the Fed needs to ‘navigate by the stars’ ie the natural rate of interest, the R*.
What do we learn from all this debate? One side says the latest inflation spike was supply-led; the other side says it was demand-led. One side says the inflation spike was exogenous and transitory; the other side says it was caused by monetary expansion; one side says the answer to inflation is to try and find the ‘right’ interest rate to ‘balance’ the economy; the other side says it is best to stop excessive government spending and keep interest rates high.
So mainstream economics is divided and uncertain about the causes of inflation and what to do about it. Indeed, this is how I saw the inflation debate at the 2024 ASSA last year. I quote: “This cocktail of causes leaves with us with no explanation at all. No wonder Werning summed his address with the words: “that often we end up knowing less than we knew before” but that’s science for you.”
What should we conclude? First, the evidence is clear that the recent inflationary spiral was triggered by a food and energy price explosion caused by shortages and supply chain blockages after the end of the pandemic. But the reaction of the monetary authorities to these global shortages was to boost money supply and keep interest rates low to enable industry and households to buy goods and services at the rising prices. They were worried that if they did not do so, the pandemic slump would have continued. In the theory of inflation that G Carchedi and I have been working on, we argue that central banks increase the money supply as a reaction to slowing GDP and investment growth. They rely on monetary and fiscal policies to reverse slowing or declining productive sectors. But we argue this has little effect on investment and thus on output. Instead, it will increase inflation. In that sense, Cochrane is right.
Eventually, in 2022, the authorities sharply tightened monetary policy and reduced money supply and inflation rates subsided. But inflation has not returned to previous levels because growth in new value production remains weak, or in other words, productivity growth is still low in the major economies. All the mainstream economists in the debate agreed that higher productivity growth would allow for fuller employment and wage growth without higher inflation. Of course, they don’t know how that can be achieved – except if AI saves the day.
Let me finish part one of this review of ASSA 2025 on the session reflecting on one of the great mainstream economists of 20th century, Robert Solow, who died last year at the age of 99. Keynesian guru, Larry Summers called him, the “wittiest greatest economist of the 20th century; and the greatest wittiest economist of the 20th century.”

Solow was known for his work on developing the so-called Phillips curve for the US (Samuelson and Solow,1960). This curve shows the trade off between wage growth and the unemployment rate in an economy. This curve has since proved poor at forecasting changes in unemployment or wages. But the Fed still uses the Phillips curve despite the fact the so-called relation has flattened out and shifts violently.
Solow is more famous for his factor-accounting theory of long-term economic growth. Economic growth is due to factors of production ie investment in machinery etc and labour employment; as well as a mysterious ‘residual’ factor in the accounting that can be defined as innovation in technology, called total factor productivity (TFP). The objective of Solow’s theory of growth was to counter the theories of classical economics that economic growth would tend to slow due to falling profitability; and to counter Keynesian theory that growth was unstable and always on a ’knife-edge’ between boom and slump (inflation or unemployment). Solow’s factor accounting theory ‘proved’ that economic growth under capitalism could be smooth and sustained, as long as there was perfect competition in technology and labour markets.
The irony of Solow’s work is that he found that the accumulation of capital could not sustain growth forever because so much depended on the residual of ‘innovation’ ie TFP, which is not explained by factor accounting. Recent work by Marxist economists show that actually instability is also a built-in feature in Solow’s model arising from the underlying dynamics of profitability. There is an inverse relationship between the falling rate of profit and rising investment, not recognised in the Solow model.
The other memorial session was to proclaim the career of Ben Bernanke, the former Fed chair and expert on the Great Depression, as mentioned in the inflation debate above. Bernanke is one of the leading exponents of manstream macro economics. I wont go into this in detail as you can watch it here, except for these quotes below from the session.


Instead you can also look at many previous posts that I have done on Bernanke’s ideas and policies.
https://thenextrecession.wordpress.com/2015/10/07/ben-bernanke-courage-and-confusion/
https://thenextrecession.wordpress.com/2015/03/30/ben-bernanke-and-the-natural-rate-of-return/
https://thenextrecession.wordpress.com/2014/01/05/bernanke-has-failed/
https://thenextrecession.wordpress.com/2013/10/06/bernanke-banking-crashes-and-recessions/
https://thenextrecession.wordpress.com/2010/10/01/bernanke-in-denial/
I am reminded of Bernanke’s own forecasts about the global financial crash of 2008-9. In his statement to Congress in May 2007, when the sub-prime mortgage collapse was just getting under way. He told Congress “at this juncture . . . the impact on the broader economy and financial markets of the problems in the subprime markets seems likely to be contained. Importantly, we see no serious broader spillover to banks or thrift institutions from the problems in the subprime market”. He went to estimate that the likely losses to the financial sector of the mortgage crisis in the US would be “between $50 billion and $100 billion”. It turned out to be $1.5trn in the US and another $1.5trn globally.
Part two will cover the radical economics sessions at ASSA 2025.
December 31, 2024
Forecast 2025: roaring or tepid?
It’s time to make some forecasts on what will happen to the world economy and its major countries in 2025. Many people reckon that it is waste of time making such forecasts as they are never accurate and quite often the opposite happens. Of course, forecasts are wrapped in error, given the many variables involved that drive economies. Weather forecasts are still difficult to make and meteorologists are dealing with physical events and not (at least directly) with human actions. Nevertheless, weather forecasts up to three days ahead are now pretty accurate. And longer term climate change forecasts have been broadly borne out over the last few decades. So if we consider that economics is a science (albeit a social science) and I do, then making predictions (the long and the short) is part of testing theories and evidence in economics too.
This is what I said in a post for the forecast of 2024: “In sum, 2024 looks like being one of slowing economic growth for most countries and probably more slipping into recession in Europe, Latin America and Asia. The debt crisis in those countries in the so-called global south that don’t have energy or minerals to sell will worsen. So even if the US avoids an outright slump again this year, it won’t feel like a ‘soft landing’ for most people in the world.” I think that turned out to be broadly correct (for a change!).
2024 was the year of elections. There were 40 national elections, covering 41% of the world’s population and representing 42% of global GDP. And my forecasts for the outcomes in these were also pretty accurate. On the most important, the US presidential election, this is what I said: “there is no certainty about who will win; or whether Biden will actually stand again; or whether either Trump or Biden would even serve another full term.” So not very clear, but at least not wrong. Biden did not stand, Trump won (narrowly on the popular vote) and we don’t know if he will serve a full term.
The results of other elections were much more easily predicted: the UK, India, Indonesia, South Korea, Taiwan, South Africa came out as forecast. The surprises were the victory of a leftist party in Sri Lanka and the victory of the left as the largest party in the snap election in France. Nearly everywhere, the incumbent governments lost vote share and/or were defeated; and voter turnout was down, revealing the disillusionment of citizens with all the mainstream political parties. That trend is likely to continue in 2025 with elections in Germany, Canada, Australia, Czech and Norway; and in Latin America too (Ecuador, Chile and Bolivia).
What about the economy? 2024 ended with six out of the top seven capitalist economies either in stagnation or in outright recession, as measured on the basis of gross domestic product (GDP). And when measured on GDP per person, then even the US, the best performing of the G7 economies, did not do so well, while the rest were all stagnant at best. The reason for that was not an increase in populations through births and deaths, but through net immigration. Immigration boosted the labour force and national output in 2024 in the US, the UK, Australia and Canada. The long depression that started after the Great Recession of 2008-9, resumed after the pandemic slump of 2020 and continued in 2024.

The World Bank presented a dismal picture of the situation for most people in the world. In 2024, “Global extreme poverty reduction has slowed to a near standstill, with 2020-30 set to be a lost decade.” Around 3.5 billion people live on less than $6.85 a day, the poverty line more relevant for middle-income countries, which are home to three-quarters of the world’s population. “Without drastic action, it could take decades to eradicate extreme poverty and more than a century to eliminate poverty as it is defined for nearly half of the world.” With little progress on controlling global warming, “1.2 billion people faced climate-related hazards and high vulnerability, with South Asia and Sub-Saharan Africa among the most affected regions.”
Then there is the debt burden for so-called ‘developing countries’ – something I argued would worsen in 2024. The World Bank again: “The COVID-19 pandemic sharply increased the debt burdens of all developing countries—and the subsequent surge in global interest rates has made it harder for many to regain their footing. At the end of 2023, the total external debt owed by low- and middle-income countries stood at a record $8.8 trillion, an 8 percent increase from 2020. Interest payments for developing countries surged by nearly a third to $406 billion, leaving countries with less funds to invest in critical areas such as health, education, and the environment.”
The International Labour Organisation (ILO) found that in 2024 most working people suffered a reduction or no improvement in their wages after inflation is accounted for; and that is unlikely to improve much in 2025. Real wages remain below their pre-pandemic levels in many parts of the world. And the gaps in earnings between the world’s best and worst paid workers remains wide. The ILO calculated that in 2021 (adjusted for purchasing power), the bottom 10% of workers earned $250 per month, while the top 10% earned $4,199 per month for full-time work. “This means that the purchasing power of the median wage earner in low-income countries is about 6 per cent of the purchasing power of the median wage earner in high-income countries.” Globally, the lowest-paid 10% of workers earned just 0.5% of total wages, while the highest-paid 10% received 38% of the global wage bill.
In the first half of 2024, real wages remained lower than in 2019 before the pandemic in Germany, France, Italy and the UK, as well as in Japan and South Korea. Real wages were higher in the US, but only by 1.4%. Indeed, real wages in some countries—the UK, Japan and Italy—remain below levels recorded in 2008, the year of the Great Recession! By contrast, Chinese real wages were up 27% from 2019, while Brazil also recorded a big rise.
The World Inequality Lab updated its latest estimate of the inequality of income and wealth globally. The United States is the most unequal country in the OECD, with 21% of national income going to the richest 1% – the same as in Mexico (21%) and slightly more than in South Africa (19%). While real incomes for billions of people were stagnant or rose only slightly, incomes and wealth for the super rich rose at a record pace. The US stock market hit new highs and US oligarchs like Elon Musk and Jeff Bezos etc saw their net wealth rocket by billions to new grotesque highs.

In 2024, the US economy rose by about 2.5% in real GDP in 2024, creating the image of US ‘exceptionalism’: a strong economy, a strong dollar and fossil fuel and AI-driven expansion. So confident that the US economy will continue in this vein that BlackRock, the world’s largest investment fund, in its forecast for 2025, reckon that “Boom and bust cycles in capitalism are over”. BlackRock believes the world economy is currently in the process of being entirely “reshaped” by the emergence of five new “mega forces,” including the shift to net zero carbon emissions, geopolitical fragmentation, demographic trends, digitization of finance and AI. Apparently, this means that the global economy will break away from “historical trends” that have seen markets go through cycles of boom and bust for centuries.
BlackRock’s optimism is hardly surprising considering the huge gains in financial asset prices that they benefited from in 2024. But the major international economic agencies are less excited. In its latest World Economic Outlook, the IMF expects global economic growth to stay steady at about 3.2% this year. That growth rate is the weakest in decades and “downside risks are increasing and dominate the outlook.” The IMF expects that, while the US will continue to lead the way on growth among the advanced economies in 2025, US real GDP growth will slow to 2.2% in 2025, while the rest of the G7 will struggle to get above 1% a year. The US economy may still be expanding but not its industrial sector, the productive part. Industrial production sharnk in 2024, as it did in all the major economies.
The IMF is also worried that Trump’s plans to increase tariffs on the imports of goods from countries that do not play ball with his aim to ‘make America great again’ will lead to “lower output relative to our baseline forecast. Monetary policy could remain too tight for too long and global financial conditions could tighten abruptly.” That could halve the projected growth rate for 2025 and onwards.
The OECD takes a similar position on the global economy, if slightly more optimistic. The OECD expects the world economy to grow by 3.3% in 2025, a pickup from the 3.2% rate in 2024, with the US slowing just slightly to 2.4%. UNCTAD is much more pessimistic. “The global economy faces a new normal of low growth, high debt, weak investment and disrupted trade”. Its economists expect global growth to be 2.7% in 2025, which is down from the 3.0% annual average between 2011 and 2019 and well below the 4.4% average seen before the global financial crisis. For developing countries, the slowdown is sharper: “between 2024 and 2026, countries that make up more than 80 percent of the world’s population and global gross domestic product would still be growing more slowly than they did in the decade before COVID-19.”

What are the key economic factors that can help us judge how the major economies will perform in 2025? The first is international trade. Between 1995 and 2007, trade grew at twice the rate of global GDP. But since the 2008–2009 financial crisis, trade growth relative to GDP has stalled. Trump’s plans, if implemented (there is some doubt about that) would accelerate de-globalisation and the stagnation of world trade, particularly hitting the Global South economies. The investment bank, Goldman Sachs, usually very optimistic, sees a sizable blow to US GDP from a potential 10% tariff on all imported goods — in part due to higher consumer prices, which would reduce spending by Americans. And “this could end in a global trade war which, while it could take many forms, at the extreme could knock 2-3% off global GDP,” said consultancy Capital Economics. Based on current forecasts as above, a 3% hit to the world’s output would erase economic growth in 2025.

Behind the tariff war risk, is war itself. The Russia-Ukraine conflict is reaching a head – what Trump will do there remains uncertain. But he clearly intends to back Israel all the way even if that means open conflict with Iran next year. If that happens, then oil prices could jump, pushing up inflation again. And this is when the so-called ‘war against inflation’ launched by the major central banks of the world has not been won.
Yes, inflation of goods and services prices has fallen from its heights in 2022, but it has not fallen back to pre-pandemic levels, let alone to the central bank targets of 2% a year. Indeed, in the major economies there are signs that the inflation rate is turning back up. ‘Going the last mile’ on inflation, as it is called, is proving impossible. If that continues through 2025, then central banks will stop cutting their policy interest rates and so borrowing costs for companies and households will stay high.

This will increase the difficulty of servicing existing debt, especially for the Global South countries, as the dollar is likely to stay strong if US interest rates stay high and geopolitical conflict worsens.

If the cost of borrowing and servicing debt does not come down, there is an increased risk that the so-called ‘zombie’ companies (which do not make enough profits to cover their debt costs and must keep borrowing) will start to go bust. Over 40% of the top 2000 companies in the US are unprofitable, the most since the pandemic. At the same time, interest expense as a % of total debt of these firms hit 7.1%, the highest since 2003. US company bankruptcies in 2024 surpassed 2020 pandemic levels. Gross leverage—the ratio of debt to assets (and earnings) —of all US publicly traded nonfinancial firms remains high and hedge fund leverage is at or near the highest level in the past decade. So the risk of a financial crash is rising.

As Ruchir Sharma of the Rockefeller Foundation put it: “Awe of “American exceptionalism” in markets has now gone too far….Talk of bubbles in tech or AI, or in investment strategies focused on growth and momentum, obscures the mother of all bubbles in US markets. Thoroughly dominating the mind space of global investors, America is over-owned, overvalued and overhyped to a degree never seen before. As with all bubbles, it is hard to know when this one will deflate, or what will trigger its decline.” And there are signs. The US stock market index, the S&P, 500 fell 1.6% in December, with 6 or more sectors down 5% or worse.
The most important factor in looking at prospects for the world economy in 2025 must be global corporate profits (and profitability), as this is the driver of capitalist production and investment. If profits in the major companies of the world continue to rise in 2025, then financing debt and absorbing weak international trade can be coped with for another year.
I regularly do an estimate of global profits based on company profits in the US, Germany, the UK, Japan and China. Global profits growth as an average has been slowing towards zero. However, in the first three quarters of 2024, US corporate profits still rose 1.5% compared to 2023; China and the UK had a 5-6% rise, while German profits were stagnant and Japan’s fell.

Will profits pick up in 2025? The optimists like BlackRock are confident. They base their expectations on a seeming rise in labour productivity in the US in the last year, driven by gains from diffusion of AI across sectors. They see this as the start of a “Roaring Twenties” as happened in the US after the end of the Spanish flu epidemic in the 1920s.
There are few things to say about this apparent productivity boom. First, it is confined to the US. Europe’s economies are not experiencing such a boom – on the contrary. Second, the recent rise in productivity growth still puts the US trend pretty much the same as before the pandemic.

So there are no confirmed signs yet of a ‘step jump’ in productivity growth. Indeed, as I have discussed in previous posts, the diffusion of AI productivity gains could take a long time to emerge (if it emerges at all). It’s unlikely that AI investment will do the trick in 2025 – and certainly not outside the US, especially if there is no sustained pick-up in the profitability of capital in the major economies.
My best estimate of the average rate of profit on capital in the G7 economies does indicate a recovery from the depth of the pandemic slump. But this is led almost solely by a large rise in US profitability, as the other G7 economy profit rates have mainly stagnated. According to AMECO forecasts, the US rate of profit in 2025 will be 10.7% higher than in 2019, but 2-8% lower in the UK, France, Germany and Italy, with Canada and Japan up only 1-2%.

So what my profitability estimates suggest is that a recession in 2025 is unlikely; but on the other hand, it is too early to argue for any sustained rise in profitability across the G7 that could drive productive investment and productivity growth to new levels.
Most likely, in 2025, growth in Europe and Japan will continue to be close to stagnation; as well as Canada and Australia. Also economic growth and trade expansion in every country of the BRICS will be slower than in 2024. So rather than the start of the Roaring Twenties in 2025, more likely it will be a continuation of the Tepid Twenties for the world economy.
December 29, 2024
Top ten posts of 2024
This was the 14th year since I launched this blog. Over those years, I have posted 1279 times with over 5.7 million viewings and over 2.3m visitors. There are currently 8002 regular followers of the blog.
And there are 14380 followers of the Michael Roberts Facebook site, which I started nine years ago. On that Facebook site, I put short daily items of information or comment on economics and economic events. Of these followers, 79% are men and 21% women (not good!), mostly aged between 25-45 years.
In 2024, my blog viewings were slightly down from last year and from the record COVID year when everybody was stuck at home online. But I did more posts this year, 86 posts up from 83 last year and those that read them stayed on the site for more views with an average 3 views per visitor – a record.
Where do my blog viewers come from? From over 199 countries globally! Led by 116k viewings from the US (or about 25%); 60k from UK (12%). Brazil and Spain are the next largest viewers followed by Canada, Germany, France, India and Australia. Right at the other end of the spectrum, I have had viewings from Fiji, Liberia, Vanuatu, Greenland, Yemen, Mali, Timor, Haiti, New Caledonia and Gabon.
And at the beginning of 2020, I also launched the Michael Roberts You Tube channel. This now has 3300 subscribers, with 73 videos and 55,935 viewings. If you haven’t joined up yet, have a look at the channel, which includes presentations by me on a variety of economic subjects; interviews with other Marxist economists; and some zoom debates in which I participated.
My top three videos of 2024 were: Marx’s law of value and the challenges of the 21st century; What would Marx and Engels says about today’s global capitalist economy?; and Capitalism in the 21st century: a review of the book by G Carchedi and myself that was published in 2023.
In 2023 I also launched a Twitter site. That has only 313 followers. That’s partly because the blog and my Facebook site cover the same things and Twitter requires much more work on a daily basis so there are fewer posts. it seems in general that Twitter is beginning to flag in social media. But watch that Twitter space.
So what was the most popular (in terms of number of viewings) post on my blog in 2024?
Rather surprisingly it was my review of The State of Capitalism, the book written by the NAMe Collective with the lead from Professor Costas Lapavitsas from SOAS University, London. The authors seek to analyse all aspects of capitalism in the 21st century from a Marxist perspective. The book starts with an overview of capitalism in this century. The Collective argues that capitalism is much weaker than in the 20th century. And the roots of this weakness lie in a slower accumulation of capital, particularly since the ‘interregnum’ of the Great Recession of 2007-9. There are several important points in the book that I disagree with. This may be why the post was popular, because the review appears to have sparked a debate on these points from viewers.
https://thenextrecession.wordpress.com/?s=state
Second in the top ten list is another book review of mine – this time of the excellent Unequal Development and Capitalism by Brazilian Marxist economists Adalmir Antonio Marquetti, Alessandro Miebach and Henrique Morrone. They propose a model of economic development based on technical change, profit rate and capital accumulation, on the one hand, and institutional change, on the other. Together these two factors should be combined to explain the dynamics of catching up or falling behind for the countries of the Global South.
The book argues that catching up is not happening. The book’s economic model aligns with Marx’s view that underdeveloped countries should follow the path of technical change set by developed capitalist nations. But as the authors recognize “this trajectory often leads to a decline in the profit rate and, therefore, a decrease in the incentives for investment and capital accumulation. How to circumvent this problem is one of the central issues that a national development plan must face.” Without strong state intervention, the contradiction between a falling rate of profit and increasing the productivity of labour cannot be overcome.
https://thenextrecession.wordpress.com/2024/07/17/catching-up-and-falling-behind/
The big political event of 2024 was the US presidential election and the ensuing return of Donald Trump. Two posts on this made the top ten: my post on the challenges within the US economy and then on the underlying causes of Trump’s victory: the cost of living, immigration and the failure of the Democrats to address the class issues of working people. https://thenextrecession.wordpress.com/2024/11/02/the-us-presidential-election-part-one-the-economy/

Biden and Harris crowed about a vibrant, healthy, low unemployment US economy, better than anywhere else. But sufficient American voters were not convinced of this message coming from the so-called ‘liberal elite’, given their own experience. They reckoned they were losing out because of high prices and costs, precarious jobs and uncontrolled immigration that threatened their livelihoods, while the rich and educated in Wall Street and in the mega hi-tech companies made billions. Of course, Trump won’t change any of that – on the contrary, his pals and financial backers are a bunch of rogue billionaires who look to get yet richer from further cuts in taxes and deregulation of their activities.
https://thenextrecession.wordpress.com/2024/11/09/us-election-2024-inflation-immigration-and-identity/
The next three posts in the top ten were on Marxist economic theory. In one post, I engaged in a critique of a weird debate on Marx’s theory of value with an AI model (GZ) developed by a site called Marxism and Collapse (M&C). Their dialogue even involved the current President of Colombia, Gustavo Petro, a former academic. M&C claims that there is a fundamental weakness in Marx’s value theory, namely that it leaves out nature as a source of value. The AI model agreed and reckoned that we need to amend Marx’s value theory into some ‘general’ theory of value that incorporates ‘nature’. In the post, I argued that this change was unnecessary and it weakened Marx’s value theory as a penetrating and compelling critique of capitalism.
https://thenextrecession.wordpress.com/2024/10/03/marxs-theory-of-value-collapse-ai-and-petro/
A post on Marx’s law of profitability was next. In this, I discuss new evidence supporting the law produced by Tomas Rotta and Rishabh Kumar. They generate a new panel dataset of the key Marxist variables (labour values) from 2000 to 2014 using the World Input Output Database (WIOD).

They find that the average profit rate declined at the world level from 2000 to 2014. The big advantage of their analysis was that they could produce a rate of profit based on the productive sectors of economies. The rate of profit in these productive sectors best indicates the health and direction of the capitalist economy.
https://thenextrecession.wordpress.com/2024/01/23/marxs-law-of-profitability-yet-more-evidence/
The next post went right to the heart of Marx’s labour theory of value. It covered a debate between American Marxist economist, Fred Moseley and German Marxist scholar, Michael Heinrich on the interpretation of Marx’s theory, which took place at November 2023’s Historical Materialism conference in London. Heinrich criticises the traditional interpretation of the labour theory of value, according to which the value of commodities is determined solely in production, and argues instead that value is created only when it is converted into money through the sale of commodities on the market.

In a short book, Moseley argued for the labour theory of value interpretation. In the post , I explained why this apparently obtuse debate matters. If the theory of surplus value coming from the expenditure of human labour power disappears from any analysis of capitalism to be replaced by money, then we no longer have a theory of exploitation or any theory of crisis at all.
https://thenextrecession.wordpress.com/2023/12/23/marxs-value-theory-and-the-value-form-interpretation/
Perhaps the most important trend in 2024 has been the very fast decline of European capital since the end of the pandemic. That’s particularly the case for Europe’s manufacturing powerhouse, Germany. My post on this came in at No 7 on the list. The largest economy in Europe is in a slump. Indeed, German real GDP has shown no growth for five consecutive quarters and has really stagnated for the last four years.

This has led to the collapse of the SPD-led coalition government and an early general election has been called for February, with the so-called ‘populist’ hard right set to poll strongly.
https://thenextrecession.wordpress.com/2024/09/01/germany-the-end-of-eu-hegemony/
My post on the rise of private equity companies in 21st century capitalism was next in the top ten.

Over the last two decades, the vampires of private equity have gorged themselves on the profits of labour in the companies they have sweated, while avoiding sharing those profits with their investors or with governments through taxation. They engage in various forms of ‘financial engineering’ to increase their gains. And in doing so, they have leveraged key sectors of the economy into huge debts at the expense of productive investment. Now rising debt servicing costs are adding to the risk of a major financial crash, acting as a stake through the heart of many of these vampires.
https://thenextrecession.wordpress.com/2024/11/19/private-equity-vampire-capital/
Last but not least (at least for me) was my post on imperialism. In this post, I referred to some new measures made by the World Inequality Lab on the flows of income from the so-called Global South to the imperialist core. They found that net income transfers from the poorest to the richest is now equivalent to 1% of the GDP of top 20% countries (and 2% of GDP for top 10% countries), while reducing that of the bottom 80% by about 2-3% of their GDP.

I also looked at how to measure the level of so-called ‘super exploitation’ (ie where workers’ wages fall below the value of their labour power) in the Global South. Using World Bank poverty wage level measures, I calculated that roughly 5-10% of G7 countries’ workers are being ‘super-exploited’, while in the BRICS (the major Global South countries) it’s about 25-30%. But that still means that 70% of workers in the BRICS, while earning way less per day than G7 workers, are not earning below the value of their labour power on a national basis. Exploitation of workers in the Global South is huge, but super-exploitation, as such, is not the main cause.
https://thenextrecession.wordpress.com/2024/04/23/further-thoughts-on-the-economics-of-imperialism/
December 26, 2024
Books of the year 2024
Every year at this time, I look back at the books that I have reviewed during the year on this blog. I’ll take them in chronological order.
José Tapia had a new book on the world economy. In his Six crises of the world economy, he offers the reader a ‘big picture’ analysis of the world capitalist economy since the 1970s. Tapia identifies six crises in capitalist economies since the 1970s. The first crisis occurred in the mid-1970s and the sixth crisis occurred in 2020, at the time of the COVID-19 pandemic.

Tapia draws heavily on previous work by non-Marxist economists Wesley Mitchell and Jan Tinbergen who, in his view, although mainstream economists, developed a theory of endogenous recurring capitalist crises from empirical studies. Tapia’s Six Crises is essential reading for the evidence supporting Marx’s view that crises are endemic to capitalism and are now generalised through the world. Major economic crises occur at least once per decade and “the mostly failed attempt to create institutions of “global governance” show quite clearly that the ability of the market economy to regulate itself and produce efficient social outcomes is just a myth”.
https://thenextrecession.wordpress.com/2024/02/28/six-crises-of-capitalism/
In contrast, British Labour MP Liam Byrne in his book Inequality of Wealth offers a reformist approach to dealing with the extreme inequalities of wealth and income engendered in modern capitalism.

He looks to find ‘a middle way’ to rectify things between the view that nothing can be done and the view that some revolutionary transformation of the economic structure was needed, which the electorate would not accept. To do this, a government should give every young person £10,000 to kick their careers off; the government should establish a sovereign wealth fund to build up funds (what for Byrne did not explain); and there should be fairer taxation. Moreover, all these ‘radical’ measures to reduce inequality of wealth would have to be slowly introduced over “three parliaments” (I make that 15 years!), so that electorate gradually got used to the policies!
https://thenextrecession.wordpress.com/2024/03/04/inequality-the-middle-way/
We returned to a Marxist perspective with The State of Capitalism, an ambitious work, written by the NAMe Collective with the lead from Professor Costas Lapavitsas from SOAS University, London.

The Collective reminds the reader of the aim of the book: to develop a clear analysis of capitalism today in order to see the way towards replacing it with socialism. What do they advocate? Democratic planning “with the state and the broader public sector taking a commanding role in production, consumption, and distribution. The balance of power in economic decision making must be altered accordingly, creating social foundations to confront the ecological crisis in a coherent and socially aware way, something that private capital is incapable of doing.” The State of Capitalism is an exercise in hard analysis and there is much to learn and debate. In that sense, the book is a must read, even if I have disagreements on the Collective’s view on the causes of crises in capitalism, the nature of imperialist exploitation and the role of finance.
https://thenextrecession.wordpress.com/2024/03/28/the-state-of-capitalism/
There is a fundamental contradiction in capitalist investment between reducing costs through higher productivity and slowing investment because of falling profitability. This is the key message from yet another excellent book by Brett Christophers, The Price is Wrong – why capitalism won’t save the planet.

Christophers argues that it is not the price of renewables versus fossil fuel energy that is the obstacle to meeting the investment targets to limit global warming. It is the profitability of renewables compared to fossil fuel production. Christophers concludes “if private capital, circulating in markets, is still failing to decarbonize global electricity generation sufficiently rapidly even with all the support it has gotten and is getting from governments, and even with technology costs having fallen as far and as fast as they have, it is surely as clear a sign as possible that capital is not designed to do the job.” Instead, Christophers argues that if we are ever to achieve rapid reductions in carbon emissions, “extensive public ownership of renewable energy assets appears the most viable model.” I would add that must also require public ownership of the fossil fuel producers to ensure any rapid transition.
https://thenextrecession.wordpress.com/2024/06/23/fixing-the-climate-it-just-aint-profitable/
Grace Blakeley is a columnist for the British left-wing journal, Tribune, and a regular panellist on political debates in UK broadcasting – often the only spokesperson on the left advocating socialist alternatives. In her new book, Vulture Capitalism she seeks to debunk the longstanding concept of mainstream neo-classical economics that capitalism is a system of ‘free markets’ and competition.

If capitalism ever did have ‘free markets’ and competition among companies in the struggle to obtain profits created by labour (and Blakeley doubts that it ever did), then it certainly does not now. Capitalism now, she argues, is really a planned economy, controlled by big monopolies and backed by the state. Blakeley argues that crises in capitalism are no longer resolved by what Joseph Schumpeter (and Marx for that matter) called ‘creative destruction’ . Crises in capitalism ie slumps that lead to the liquidation of companies; mass unemployment and financial crashes, have been increasingly overcome through ‘planning’ by the big monopolies and the state.
Blakeley dispenses with the ‘out of date’ Marxist explanation of crises that Marx argued for, between the profitability of capital and productivity of labour that leads to regular and recurring crises of investment and production. For Blakeley, capitalism can actually avoid or at least resolve such crises by ‘planning’ and by getting handouts from the state. Monopolies can avoid ‘creative destruction’ and can continue to motor on at the expense of small businesses and the rest of us.
It’s not a thesis I agree with. Capitalism has not overcome international crises through state monopoly planning. Crises continue to occur at regular intervals, caused by the contradiction between the striving for more profit and the increasing difficulty of realizing that profit. Crises are still inherent to the capitalist accumulation process and not the result of ‘bad choices’ made by politicians doing the bidding of monopolies. Only the ending of private capital and the law of value through public ownership and planning can stop such crises.
https://thenextrecession.wordpress.com/2024/05/08/vulture-capitalism/
There are also confusions, if not the same as with Blakeley, in Joseph Stiglitz’s new book, The Road to Freedom.

For Stiglitz, the enemy of human freedom is not capitalism as such, but ‘neoliberalism’ which has bred soaring inequality, environmental degradation, the entrenchment of corporate monopolies, the 2008 financial crisis, and the rise of dangerous right-wing populists like Donald Trump. These baleful outcomes weren’t ordained by any laws of nature or laws of economics, he says. Rather, they were “a matter of choice, a result of the rules and regulations that had governed our economy. They had been shaped by decades of neoliberalism, and it was neoliberalism that was at fault.”
Stiglitz has argued before in previous books that it is not capitalism that is at fault but the decisions of governments and their corporate backers to ‘change the rules of the game’ that had existed in the post-war period of managed capitalism. The rules were changed to deregulate; to privatise; to crush labour unions etc. But Stiglitz never explains why the ruling elite felt it necessary to change the rules of the game. What happened to swing the post-war rules into the neoliberal ones? ‘Progressive capitalism’ is an oxymoron in the 21st century. And even Stiglitz doubts that it is possible to achieve.
https://thenextrecession.wordpress.com/2024/05/13/joseph-stiglitz-and-progressive-capitalism/
A much more important and insightful book is by Brazilian Marxist economists Adalmir Antonio Marquetti, Alessandro Miebach and Henrique Morrone. Entitled Unequal development and Capitalism, the authors argue that unequal development has been a defining characteristic of capitalism.

“Throughout history, countries and regions have exhibited differences in labor productivity growth – a key determinant in poverty reduction and development – and although some nations may catch up with the productivity levels or well-being of developed economies at times, others fall behind.” What they show is that Global South countries will never ‘bridge the gap’ on labour productivity and thus on living standards because the profitability of capital in the Global South will quickly dissipate compared to the Global North.
Without strong state intervention, the contradiction between a falling rate of profit and increasing the productivity of labour cannot be overcome. As the authors put it “This issue is observed in many middle-income trap countries. In these cases, state intervention becomes essential, expanding investment even as the profit rate declines, as in China.” Exactly. China’s success in catching up, which so frightens US imperialism now, is down to state-led investment overcoming the impact of falling profitability on capital investment.
https://thenextrecession.wordpress.com/2024/07/17/catching-up-and-falling-behind/
Meanwhile, the advanced capitalist economies are steadily coming to an end in any significant development as finance capital squeezes the productive sector.

This is graphically revealed for the UK by a new book, in his recent book, Vassal State – how America runs Britain, Angus Hanton shows the dominant role that US companies and finance play in owning and controlling large sections of what remains of British industries. This US takeover was accepted and even encouraged by successive British governments from Tory Thatcher to Labour’s Blair.
Hanton shows that in Thatcher’s second full year in office, 1981, only 3.6 per cent of UK shares were owned overseas. By 2020 that number was more than 56 per cent. Of all the assets held by US corporations in Europe, over half of them are in the UK. US corporations have more employees in the UK than the number they have in Germany, France, Italy, Portugal and Sweden combined. The largest US companies sell more than $700 billion of goods and services to the UK, which amounts to over a quarter of the UK’s total GDP.
https://thenextrecession.wordpress.com/2024/11/19/private-equity-vampire-capital/
The next books reviewed return us to Marxist economic theory. In the Tracks of Marx’s Capital: Debates in Marxian Political Economy and Lessons for 21st Century Capitalism is an important new book by two well-known Marxist economists from Turkey.

Ahmet Tonak and Sungur Savran bring together a series of works written by them over the last 40 years that ‘track’ the development and relevance of Marx’s analysis of the capitalist mode of production to the present day. Tonak and Savran show convincingly that Marx’s Capital remains the bedrock for understanding the laws of motion of capitalist production despite fashionable attempts to revise and refute Capital’s analysis. It still provides the only searchlight for guiding us towards a new social formation for humanity that is not based on exploitation of the many by the few, but brings human beings and nature together in a world of cooperation and freedom.
https://thenextrecession.wordpress.com/2024/10/12/tracking-marxs-capital/
Ascension Mejorado and Manuel Roman have authored a book that analyses the US economy from a Marxist perspective and in so doing provides yet more empirical support for Marx’s law of profitability and its essential relevance to crises in capitalist production.

Entitled Declining Profitability and the Evolution of the US Economy: A Classical Perspective, Mejorado and Roman take the reader on a journey through Marxist crisis theory using the latest data from the US economy. Most important, Mejorado and Roman show that it is the movement in the rate and mass of profits that leads to an investment collapse and a hoarding of cash, with the subsequent collapse in ‘effective demand’, not vice versa. “For Marx, an increase in the demand for idle money, at the aggregate level, takes place when the capitalist class as a whole is induced to regard investment and production as not profitable. In this way, Marx linked the analysis of effective demand to the analysis of the fundamental factors underlying capitalist production and growth.”
The authors refer to a ‘silent depression’ in the period from 2012 to 2020 when there was a stagnation of the mass of nonfinancial corporate real profits from 2012 to 2020. So Mejorado and Roman do not expect the ‘silent depression’ to end. “Given the extended path of secular stagnation, low capital accumulation trends in the real sectors, and the build-up of financial fragility in the banking scaffold that fueled asset bubbles, the depression “is likely to persist.”
https://thenextrecession.wordpress.com/2024/12/20/profitability-investment-and-the-silent-depression-a-new-book/
Greek Marxist economists, Nikolaos Chatzarakis; Persefoni Tsaliki and Lefteris Tsoulfidis look at long cycles and economic growth with the latest data and seek to identify these long cycles in capitalism. In their book, Economic growth and long cycles, the authors critically evaluate the existing mainstream growth models and offer an alternative approach to the theory of economic growth based on what they call classical political economy, but in essence is a Marxist approach.

They argue that capitalist development takes the form of “long periods of expansion characterized systematically by accelerating growth rates and other periods of similar longevity during which growth decelerates and sometimes becomes negative.” The authors provide us with new evidence of the existence of long cycles and in so doing offer us an important indicator of the long-term ‘health’ of capitalism in the 21st century. According to the authors’ analysis, the fifth K-cycle should end by the end of this decade.
https://thenextrecession.wordpress.com/2024/12/24/long-cycles/
And finally two very useful easy educators: one on capitalism; and one on socialism. First in Capital Condensed, Colin Chalmers has written a clear, easy to read, short version of the three volumes of Capital.

Step by step, he takes the reader through Marx’s categories and definitions and how they build into the complex web of modern capitalism. I think it is a good educator for activists who are not familiar with economics – something that is very difficult to achieve.
And second, there is Simon Hannah’s, Reclaiming the Future: A Beginner’s Guide to Planning the Economy.

Hannah takes readers on a transformative journey towards a radically democratic society, where the power and control over our lives are firmly in our hands. Hannah lays the building blocks for a grassroots economy that aligns our economy within human needs and environmental limits, presenting a convincing case for socialist democratic planning as the only way to meet the needs of billions of humans without destroying the planet.
December 24, 2024
Long cycles
I have long been sympathetic to the concept of long cycles in capitalist production and accumulation. This is the idea that capitalist production moves in cycles, not just in booms and slumps every 8-10 years or so, but also there are longer periods of generally faster accumulation and output growth ie periods of relative prosperity followed by a periods of relatively slower accumulation and growth, with more recessions. These longer cycles or waves last around 50-60 years including the upswing and downswing.
If such cycles exist and can be supported by empirical evidence, they would provide an important indicator of the state of world capitalist economy. For example, if capitalist economies are in a long upswing of production, investment and profitability, as they were after WW2 up to the lat 1960s, then the prospects for any radical or revolutionary change would be low – capitalism was working. On the other hand, if the world economy had entered a downswing in production, accumulation and profitability, that would create new class tensions that could bring about radical changes (for example, from the late 1960s to the early 1980s, eg with the overthrow of military dictatorships across southern Europe).
The most famous long cycle analysis is attributed to Nicolai Kondratiev, a Russian economist of the early 20th century. He argued that in all ‘probability’ such long cycles existed and he sought to reveal them empirically, primarily by relying on the movements in prices of commodities, which in turn depended on long term investments in infrastructure and in markets. Kondratiev argued that such cycles were ‘endogenous’, ie they were internal or driven by economic forces within capitalism.
Kondratiev was strongly criticised for his ‘mechanistic’ approach – the most famous critic being Leon Trotsky, who, while recognising the compelling features of Kondratiev’s claims, rejected that these cycles, if they existed, were economically endogenous, arguing instead that political and social forces, like wars and revolutions, were major contributors to any significant changes in the direction of capitalist development. Later, a close follower of Trotsky, the Belgian Marxist economist Ernest Mandel also recognised long cycles or waves. But he curiously argued that while the upwaves and downphases in the long cycle were due to economic changes (ie endogenous), the downphases only came to an end because of political events (war, revolution etc) and not because of economic changes.
I say all this because there is a new book out that looks at long cycles and economic growth with the latest data and seeks to identify these long cycles in capitalism. The authors are the Greek Marxist economists, Nikolaos Chatzarakis, at the New School for Social Research in New York; Persefoni Tsaliki Aristotle University of Thessaloniki and Lefteris Tsoulfidis at the University of Macedonia.

In their book, Economic growth and long cycles, the authors critically evaluate the existing mainstream growth models and offer an alternative approach to the theory of economic growth based on what they call classical political economy, but in essence is a Marxist approach. They argue that capitalist development takes the form of “long periods of expansion characterized systematically by accelerating growth rates and other periods of similar longevity during which growth decelerates and sometimes becomes negative.”
Their model shows that “economic growth is a turbulent but non-erratic and indeterminate process” in which two distinct patterns become apparent: the long-run tendency of capitalism to grow and the cyclical nature of this growth. The cause of the long cycles depends ultimately by the long-run falling tendency of the rate of profit “which gives rise to the cyclical nature of capitalist growth.” It is the evolution of the surplus value and the rate of surplus value that ultimately shapes the evolution of the capitalist economy, as opposed to mainstream theories based on investment, consumption or productivity.
Their growth model joins the three basic laws of Marxist economic theory: the law of value; the general law of accumulation (along with the schemes of expanded reproduction) and the law of profitability. This combination of the three basic laws is something that I emphasised in my own work on crises (see Marx 200). When combined, the empirical results closely follow the actual evolution of the capitalist economy in long cycles. Based on these laws, they build a model of economic growth and long cycles consisting of five differential equations based on: the evolution of the rate of profit, investment in both constant (fixed) and variable capital, technological change and capital devaluation.
The authors find that there are five long waves or K-cycles spanning 187 years of capitalist development in the US and the UK, from 1834–2021.

These waves match earlier work by Anwar Shaikh’s (in his book Capitalism (2016) p66 and as early as 1992). I also constructed a long wave or cycle model in my book, The Long Depression, pp. 217-34, although the dates of my cycles were different from the authors, as they make the period of profitability downturn in the 1970s as the downphase of a fourth K-cycle, thus entering a fifth K-cycle from 1982 to now. For more on the differences between my view and that of the authors, see this.

The authors’ empirical evidence importantly connects their cycles to long-term changes in the trajectory of the rate of profit. “During the upward stage of the long cycle profitability is rising, and businesses have no compelling reason to risk their already good performance by introducing radical innovations. By contrast, in the downturn phase of the long cycle, profitability is stagnating or even falling, and the prospects are bleak, which challenges the very survival of the enterprise. Under these circumstances, the pressure to innovate is at its highest as capitalists, on the one hand, face the abyss of default; on the other hand, their higher likelihood for survival compels them to assume the risk of becoming more innovations-prone and, therefore, opt for the innovation path.”
Thus the authors claim that their analysis of long cycles integrates the Schumpeterian view on innovations and the theories of social structures of accumulation (SSA) into a single and unified theory in which the ‘cause of the causes’ is the evolution of the rate of profit. It is the cumulative long-run effect of the rate on investment and on the mass of real net profits that, past a point, generates the conditions for the manifestation of economic crisis and the change in the phase of economic activity.
The authors argue that “For Marx, the crises in capitalism have intrinsic causes and, therefore, are not conjectural; in this sense, they are inevitable.” The evolution of the US economy follows the Kondratiev’s theoretical scheme and the movement of the rate of profit inevitably shaped it over the post-WWII period.

The technical aspects of the model are detailed in a chapter that conveys both the secular and the cyclical patterns in the evolution of capitalism in which profitability governs capitalists’ decisions to expand or contract, hence shaping both the tendential and the cyclical patterns of the system’s behaviour.
The authors interestingly argue that the growth rate of the rate of surplus value becomes the key explanatory variable of the upswings and downswings of the rate of profit for two reasons: first, it formulates the degree and level of disproportions between the departments of consumption and investment and; second, it defines the system’s ability to generate enough new surplus value at each phase of the accumulation process. “By so doing, the rate of surplus value becomes the principal variable determining the rate of capital accumulation and, to the extent we know the literature, this particular role has not been adequately explored.” Indeed, this is a new insight.
As the authors correctly emphasis, a falling rate of profit is not “in and of itself” capable of generating crises. In fact, if the fall in the rate of profit is slow enough, the economy can keep expanding for many years. What is required is an underlying cause that takes the ‘possibility’ to pass into the ‘actuality’ of crises (see my paper, Tendencies, triggers and tulips.) Such a cause is offered by Marx in the trajectory of the mass of realized surplus value (profits). As the rate of profit declines, there is a point at which the mass or real net profits stagnate and thereafter even falls. This is what can be called ‘Marx’s moment’ or point of ‘over-accumulation’. At this tipping point, the capitalists abstain from investment, and the system spirals down into a crisis.
The authors provide us with new evidence of the existence of long cycles and in so doing offer us an important indicator of the long-term ‘health’ of capitalism in the 21st century. According to the authors’ analysis, the fifth K-cycle should end by the end of this decade (see table above).
December 22, 2024
Revisiting the theory of long depressions
This post was first published in the Spanish online journal Sin Permiso and is in response to a critique of my long depression theory presented in my book, The Long Depression.
Rolando Astarita, the excellent Argentine Marxist economist, has written a brief critique of my concept of the Long Depression, first developed in my 2016 book of the same name. Rolando begins by referring to my brief review of a recent new book by José Tapia . In my review, Rolando notes that I defend Engels’ characterization of the period 1873-1890 as a “long depressive phase of capitalism.” Rolando quotes me: “Engels wrote of ‘a permanent and chronic depression’ in 1886, right at the depth of the long 19th-century depression that engulfed the major economies around 1873-95. Engels was surely right to characterise that period as somewhat different from the earlier boom period of 1850-73, which also had, however, a succession of crises.”
Rolando questions this characterization because, he says, “the data do not show that the quarter century after the 1873 crisis was one of stagnation. In fact, the period 1873-1894, which proponents of the Kondratiev long wave thesis define as a depressive phase B, does not show growth rates so different from the previous 25 years, nor from the 25 years after.” To defend this point, he refers to the data presented by Edwards, Gordon and Reich (below).
1) Growth rate 1846–1878:
US 4.2%; Britain 2.2%; Germany 2.5%; France 1.3%. Weighted average 2.8%.
2) Growth rate 1878–1894:
US 3.7 %; Britain 1.7%; Germany 2.3%; France 0.9%. Weighted average 2.6%.
3) Growth rate 1894–1914:
US 3.8%; Britain 2.1%; Germany 2.5%; France 1.5%. Weighted average 3%.
Source: Segmented Labor, Divided Workers, Gordon, Edwards, and Reich, p. 66.
The first thing that strikes me about these data is that there is actually a smaller growth rate between 1878-94 and the periods before and after. But it is not by much. This is because these data do not provide an accurate guide to the growth rate in the period defined as the depression. In my book (Chapter 2), I define that period as 1873-97 (at the latest). The earlier data are superimposed across that period.
I analyzed the real GDP growth rate of the United Kingdom, the largest economy in that period. I used the Bank of England’s historical series. I found the following:
Average
1851-73 2.72
1873-97 1.72
1873-86 1.28
1897-1913 1.96
1887-1913 2.09
https://www.bankofengland.co.uk/statistics/research-datasets
The average annual growth rate for the UK in the defined period was therefore 1.7% per annum, compared with 2.7% before and around 2% after. In my view the period of depression varied for different economies at the time, and in the case of the UK the depression was really from 1873 to 1886. During that period the growth rate was just 1.3% per annum, less than half the rate of the earlier period and just 60% of the rate of the later period up to the First World War. This indicates a significant slowdown which is consistent with my characterisation (and that of Engels in 1886) of a prolonged depression.
Rolando points out that the United States had a much higher growth rate between 1846 and 1914 than other major economies. Sure, but when we look at the defined period of the depression, we also find a significant slowdown in US growth in the defined period. In my book, I reproduce US BEA data on US per capita income growth and it reveals a significant slowdown and even stagnation in per capita income growth between 1883 and 1896.
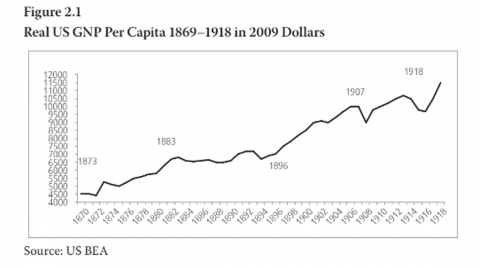
Using Maddison as a source, I found that average annual growth in per capita income in the United States slowed from 1.6% in the 1870s to 1.3% for 13 years, from 1883 to 1896, before accelerating to 1.9% per year until World War I. Once again, this confirms a 13-plus-year depressive period for the United States.
Average
1871-82 1.61%
1883-96 1.29%
1897-1913 1.92%
https://socialdemocracy21stcentury.blogspot.com/2012/09/us-real-per-capita…
The US National Bureau of Economic Research provides a wealth of data on the economic history of the United States. They produce decadal growth rates for the period in question. Between 1879 and 1893, the decadal real GDP growth rate was just 36%, compared with 65% between 1869-78 and 49% after 1893. On a per capita basis (no small feat in a country with significant immigration at the time), the decadal per capita growth rate was just 9-13% between 1879-93, less than half the rate before and after.
Decennial growth rates
GDP per capita
1848-58 70 25
1869-78 65 31
1879-83 36 9
1884-93 36 13
1894-1903 49 23
NBER
In my book, I also show a significant slowdown in the growth of industrial output during the defined depression period in all major economies. Average German industrial output growth between 1873 and 1890 was 33% lower than before 1873 and 30% lower than between 1890 and 1914. Average UK industrial output growth was 45% lower than before and 15% lower than after. Average US industrial output growth was 25% lower than before and 12% lower than after. Average French industrial output growth was 24% lower than before and 52% lower than after.
As for the causes of the late 19th century depression, Rolando believes that the “so-called Great Depression of the 19th century” was not such a thing because “it was a period of high productivity growth and the gold standard.” He goes on to say that “this would have caused permanent deflationary pressures in the economy. Hence the persistent feeling of a “bad business” climate. But productivity and production gains were a fact.”
Here Rolando repeats the views of the then and later “deniers,” who come mainly from the Austrian School, who like to claim that price deflation was due to exchange rates and money supply being controlled by the gold standard. For the “deniers,” the depression was simply a subjective feeling, not a reality. But this view was vigorously rejected by others at the time and since. In my book, I make extensive reference to the work of the great economic historian Arthur Lewis, whose careful study makes a powerful argument for defining this period as a depression (pp. 38-39).
Lewis argues that there were several recessions during the long depression and that they were markedly worse after 1873. Lewis estimated the depth of these recessions by the time it took for output to return to a level of growth “in excess of the previous peak.” He found that between 1853 and 1873, it took about three or four years. But between 1873 and 1899, it took six to seven years. He also measured the loss of output in the recessions—that is, the difference between actual output and what it would have been if trend growth had continued. The loss of potential output was only 1.5 percent between 1853 and 1873 because “the recessions were short and mild.” From 1873 to 1883, the loss was 4.4 percent; from 1883 to 1899, 6.8 percent; and from 1899 to 1913, 5.3 percent, because “after 1873 the recessions became quite violent and prolonged.” The recessions were longer because Britain (among other countries) was in the grip of a long depression. So the original crisis (or financial panic) of 1873 was followed a few years later by another recession (1876) and another (1889) and another (1892). The loss was therefore two or three times greater in the recessions during the long depression.
Furthermore, Lewis argued that the cause of the depression (at least for the UK) was not the gold standard and the price deflation created by high productivity, but a fall in the profitability of capital. Lewis: “In the low level of profits in the last quarter of the century we have an explanation which is sufficiently powerful to account for the retardation of industrial growth in the 1880s and 1890s.”
Lewis sums up the Long Depression as follows: “There was a decline in aggregate industrial demand in the last quarter of the nineteenth century after the great boom which ended in 1873… the remarkable severity and prolongation of the Minstrel recessions. No Minstrel recession was equally severe in all countries; different countries prospered in different decades, depending mainly on the timing of the building booms. They therefore offset each other to some extent. But the net effect on aggregate industrial output was weakness from 1873 to 1899 compared with the Minstrel cycles before and after.”
Let me be clear here. I define a depression not as an actual long-term decline in output or investment, but when economies, after a recession, start to grow well below their previous rate of output (in total and per capita) and below their previous long-term average. Productive investment growth will also be below the previous long-term average. But, above all, the profitability of the capitalist sectors in the economies will be below the levels before the onset of the depression.
Rolando now brings us to the period from 2000 to the present, which (at least since 2008) I define as another long depression like that of the late 19th century and the 1930s. Rolando refers to IMF data on global growth for the period 2010-24. “Taking IMF data, over the past 15 years the world economy grew at an average annual rate of 3.4%.”
2010: 5.4%; 2011: 4.2%; 2012: 3.5%; 2013: 3.4%; 2014: 3.6%; 2015: 3.5%; 2016: 3.3%; 2017: 3.8%; 2018: 3.6%; 2019: 2.8%; 2020: -2.7%; 2021: 6.5%; 2022: 3.5%; 2023: 3.2%; 2024: 3.3%
Rolando concludes that “I do not see these figures as typical of a period of ‘long depression’. The average rate was 3.39%, much higher, for example, than the average growth of the British economy throughout the 19th century (which no Marxist would hesitate to describe as a development of the productive forces).”
But comparing the growth rate of the global economy from 2010 to 2024 with the average growth rate of the UK over a hundred years in the 19th century is not comparing apples to apples. Instead, let us look at data from the IMF and the World Bank for the relevant periods from 1980 to the present.
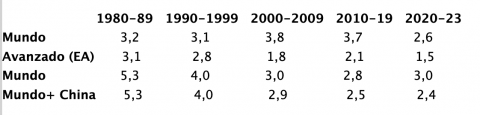
Global real GDP growth rose at a rate of 3.1-3.2% in the 1980s and 1990s, and accelerated to 3.7-3.8% in the first two decades of the 21st century. This would seem to support Rolando’s critique. But if one looks only at advanced capitalist economies, a different story emerges. In the 1980s and 1990s, average growth in AEs was 2.8-3.1%. But that rate fell to about 1.8-2.1% in the first two decades of the 21st century, a decline of about one-third of the previous average rate. In the 2020s, growth rates have plummeted even further (in the case of AEs, to half the rate of the 1980s and 1990s).
And this is IMF data. The World Bank data (lines 3 and 4) show that the average global growth rate fell from 4% per year in the 1990s to just 2.8% in the 2010s. Moreover, I would argue that the growth rate of the global economy only remained high because of the rapid growth of China, which absorbed most of the growth in the 21st century. If you exclude China (which I would do because I believe its economy does not function in the same way as the major capitalist economies and it did not experience a single recession during the 1980-2023 period), then the average global growth rate falls to just 2.5% per year in the 2010s, or 40% below that of 1990.
In fact, if we look at the largest economy of the late 20th and 21st centuries, namely the United States, we can see that the average US growth rate over the past 15 years has fallen by more than 40% compared to the previous 25 years.
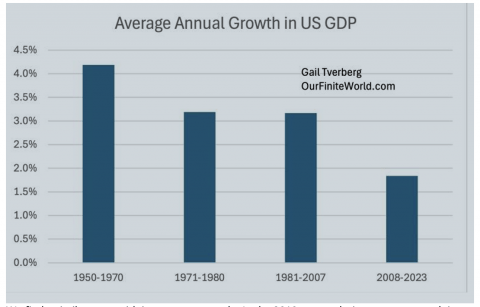
We find a similar story with investment growth. Since the 2010s, investment growth in the world and in advanced economies (AEs) has slowed.

(US data includes China, which has the highest investment rate in the world.)
And with world trade:

To the point that we can talk about the end of globalization in the Great Depression.
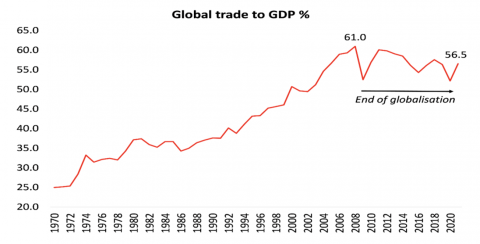
Rolando says that “I have serious doubts about the passage that Roberts continues with: ‘Yet profitability eventually resumed its secular decline beginning in the late twentieth century, a period I call the Long Depression.’” Rolando does not see any decline in the profitability of capital leading up to the Great Recession in 2008-9. Well, there are various estimates of global returns on capital, but let’s take the ROP data from the Basu-Wasner database based on Adalmir Marquetti’s Expanded Penn World Tables (EPWT).
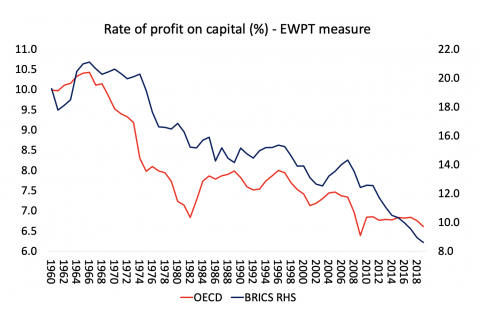
According to these figures, the rise in profitability during the so-called neoliberal period of the early 1980s peaked in the late 1990s and fell in the two years leading up to the Great Recession, remaining stagnant in the OECD and falling further in the BRICS.
So, in summary, the current long depression is characterized by: lower growth rates; lower investment growth rates; lower trade growth rates; and lower profit rates. Moreover, the recovery from each recession has been weaker than before, with no return to previous trend growth, as happened in the late 19th century depression (a la Lewis).
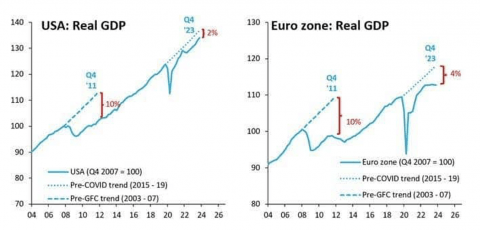
The World Bank now sees the global economy on track for its worst half-decade of growth in 30 years. Similarly, global trade growth in 2024 is expected to be only half the average of the decade before the pandemic. I think all of this provides evidence to support the definition of a depression, both in the late 19th century and now.
Michael Roberts's Blog

- Michael Roberts's profile
- 35 followers

