
Danny Dorling's Blog, page 17
December 31, 2019
Who dies young in a rich city? – The Homeless
This Christmas and New Year 2020 have been mercifully warm in Oxford, with the temperature staying at (or above) two degrees at night – so far. Because of this the usual stories about homelessness have not made many headlines yet, despite a huge increase in the numbers rough sleeping. However, almost all of the 280,000 people who are now homeless in Britain do not sleep on the streets – because almost half of that number are children; and children are not allowed to sleep rough. The number of homeless households in the UK rose by almost a quarter in the last twelve months of 2019. If those who are at threat of losing their home are added in, that figure rose to half a million people by January 2020. One in 200 people are now homeless in the UK, 1 in 24 in parts of London, and statutory homelessness (of people who the state has decided it has a duty to house) has risen overall by 39% in the ten years since 2009. More children in the UK are homeless today that at any time since 2006 (when the situation was improving). Nowhere is homelessness (when broadly defined) falling. The most affluent parts of the country are affected as much (if not more) than the poorest.
Oxford, a symbol of academic and intellectual pride, is a very divided city that has become more divided as the housing crisis worsens. To some, the listed buildings and booming University economy suggests a city thriving. Average incomes for Oxford are almost £10,000 higher than the average for England. Gentrification has transformed almost beyond recognition what were once normal neighbourhoods in the city. But it is only through looking beyond the rose-tinted glasses of seeing such gentrification as revitalisation, and by realising that many people in the city actually have a very low income (because of the very wide spread of incomes), that you can see the unequal city. The vast majority of homelessness in a city like Oxford is hidden. When it is not we are shocked.

Bedding used by people sleeping rough outside the gates of Trinty College Oxford, June 2019
One of the most visible signs of inequality in Oxford are the rough sleepers camped out on the doorsteps of the wealth-built University buildings, or under the great gates of ancient colleges. House prices in Oxford are the least affordable of any city in England and rental prices are the third most unaffordable. Because of this is no wonder that Oxford has one of the highest homeless rates per head of population and that homeless rates in the city have risen far more than in many other areas in the UK. In very recent years most of those who have died while homeless, or in a halfway house, in Oxford were born in Oxford and brought up as children in the city; but Oxford is also a place were people come to seek a better life. It as been estimated that 33 homeless people died in the city between 2013 and 2017; but this may well be an underestimate as we find a far higher number when we look again at the records.
Life expectancy in Oxford is 84.3 for women and 80.6 for men. If you are a man living in North ward in Oxford, you can expect to live to 90; a mere six miles away in Northfield Brook it is 75. For women, the gap is just under 10 years. Similarly, whilst premature mortality in Oxford is a fifth lower than the national average, people living in one area (one ward) were less than 40% as likely to die prematurely between 2014-2016; people in a nearby ward, 30% more likely.
In our study of ward-level premature mortality rates in Oxford 2002-2016, published in December 2019 in the Geographical Journal, we found that in the city overall, premature mortality rates declined over the period and were lower than the average for England and Wales. Disentangling this declining trend reveals substantial differences within the city and in particular increasing numbers of homeless deaths over time: we identified at least 144 homeless deaths in people aged under 65 between 2002 and 2016. Homelessness in Oxford, and nationally, continued to rise after the period for which we could secure data had ended, and deaths among the homeless also increased nationally; a future study may well report even worse results than these.
In one electoral ward alone – Carfax – there were 91 premature deaths. This number had almost doubled since we last looked at these issues in the 1980s. In Carfax, deaths amongst the homeless population accounted for 88% of all deaths under age 65 between 2014 and 2016. The majority of these homeless deaths were of men. Homelessness not only cuts short lives; it increasingly dominates the profile of who dies young in Oxford. For more information on homelessness in Oxford and what is and can be done to help, click here.

People sleeping rough outside the gates of Trinity College Cambridge seven months before Christmas 2019
Oxford is not alone in how visible homelessness has increased so suddenly in recent years; but the vast majority of those who are now homeless in Oxford cannot be seen sleeping rough on its streets; they are hidden away in tents in the undergrowth by the rivers, or in halfway houses; or sleeping on a friend’s sofa, or in other emergency housing provided by the authorities or by a charity for a night (or two). The same is true of Cambridge where, just before Christmas 2019, a woman aged around 30 gave birth at 7am to twins on the street outside Trinty College (11 weeks premature). more than £20,000 has been raised to help her through public donation. Ironically, now that she has children she (and they) has a right to be housed by law – because two of them are children. But thousands of other people, including many who may be pregnant, do not have such a right; hundreds of thousands who do not have young children have no right to a home, and all the time these numbers are rising.
Every week that passes more and more people are under an increased threat of losing their home across all of Britain. Furthermore, for every one of the half a million people who are currently homeless or at threat of homelessness, there are many others who know them, are their mother, father, son or daughter, bother, sister, friend or neighbour. There comes a point when this is no longer ‘other people’, and there comes a point when you realise that it has been many decades, if not centuries, since there were last so many people living rough on the streets and also living under the threat of such a fate. When was it last as bad as this? Even during wartime we found housing for people who were bombed out. You may have to go back to when the fields were first enclosed and people were made landless to find a time when mothers were last giving birth outside the gates of Trinity, Cambridge, and men last gathered to sleep on the small strip of grass outside of the gates of Trinity, Oxford.
Oxford viewed from Shotover hill. Painting by John Baptist Malchair, 1791


October 6, 2019
Slowdown: Whose freedom? a talk at Vienna Secession
A short talk on what the future may bring given the spatial dimension of the distribution of property and resources, followed by a debate with Gabu Heindl, the Vienna-based architect and planner.
Danny Dorling speaking on Slowdown: Whose freedom? at the Association of Visual Artists, Vienna Secession, 30th September 2019:
This was a public lecture in the series ‘Wessen Freiheit?’ (Whose freedom?)
This lecture and discussion concerned asking why there is always deep poverty near to great riches, but not necessarily such widespread poverty in those places where a small group of people are not extremely rich. What role do housing markets and policies play? Why do so many of our maps of human society appear fractal in their nature? And what happens when we start to look for social patterns in time as well as space? In what ways does history repeat? And what happens when the rate of change slows down?
The talk is based on past work and on a book due to be published by Yale University Press in April 2020 titled:
Slowdown
The End of the Great Acceleration—and Why It’s Good for the Planet, the Economy, and Our Lives
by Danny Dorling with illustration by Kirsten McClure
Click here for details of the UK edition and here for details of the US edition.
Please note, the illustrations within the book do not change, as the two below do (if your browser permits), because books – like almost everything else in the world – are slowing down 
August 26, 2019
What’s So Funny About Brexit? (and other subjects)
Danny Dorling talking about ‘What’s So Funny About Brexit? on the Treehouse stage, Greenbelt Festival, Boughton House, Kettering, August 25th 2019 (audio recording, click play to listen):
Paul Mason and Danny Dorling: ‘Taking The Pulse Of The Nation’s Wellbeing: Is GDP The Best Measure? Exchange venue, Greenbelt Festival, Boughton House, Kettering, August 25th 2019 (audio recording):
An interactive discussion on ‘Brexit through the Gift Shop’, held at the Foundry Venue, Greenbelt Festival, Boughton House, Kettering, August 25th 2019:
Emma Revie (CEO Trussell Trust) and Danny Dorling, talking on Peak Inequality and Food Bank Use, Treehouse Stage, Greenbelt Festival, Boughton House, Kettering, August 26th 2019:

Danny Dorling, August 2019
August 6, 2019
We need MORE babies, not fewer, Harry!
Many thousands of words have been written on the subject of Prince Harry’s announcement in Vogue last week that, when it comes to children, he intends to have ‘Two, maximum!’
Harry and Meghan might even stop at just Archie, he seemed to imply. He would certainly not go to three, as his elder brother William has done.
The reason he gave was that ‘I’ve always thought: this place is borrowed. And, surely, being as intelligent as we all are, or as evolved as we all are supposed to be, we should be able to leave something better behind for the next generation.’
In other words, Harry was worried that we have stolen the future from the generations to come.
The claim is understandable and in many ways laudable. But it is simplistic and shows a misunderstanding about how both population growth and environmental damage works.
It would be better if Prince Harry were to spend his energy and time addressing how he could tackle the issue properly. In fact, the Vogue comment betrayed a fundamental misunderstanding of the subject. Throughout history, we have had many population panics.
They began shortly after the French Revolution when the English Establishment came to believe that over-population led to starvation and the overthrowing of established order.
More recently, the late 1960s saw global consternation that the human population of the planet was growing by just over two per cent a year, and that this rate was completely unsustainable.
Had we continued to have children at the rate we had them then, there would indeed be many billions more people alive today, and tens of billion more projected into the future.
However, today the global population growth rate has slowed to about one per cent a year and that rate is now falling every year.
[This next section was nor included in the printed version of this article, but was in the final proofs]:
Furthermore, the main reason we have continued global population growth today is not because of childbirth, but because we are all now living so much longer. In almost every country in the world, life expectancy continues to rise, in many cases rapidly. There are a few exceptions, of which the most notable are the UK and the US.
In both, life expectancy peaked in 2014 but then fell. The fall in the UK is likely to be the result of cuts in social care spending for the elderly. In America, the drop has been caused by the opioid crisis and a rising death toll caused by conditions known as ‘diseases of despair’ – the results of drug and alcohol abuse in particular. These drops in life expectancy are almost certainly temporary.
For more information on these falls click play directly below:
Danny Dorling’s Keynote Speech: Manchester International festival of Public Health, University of Manchester, July 18th 2019.
Note: In England and Wales infant mortality per 1000 births rose from 3.6 in 2014 to 3.7 in 2015, 3.8 in 2016, and then up significantly again to 3.9 in 2017. As yet we have no data for 2018. Nowhere else in Europe are the mortality rates of babies rising like this. Independently of infant mortality, mostly due to people dying earlier in old age, life expectancy in the UK peaked in 2014 and then fell for both men and women, again this is unique across all of Europe. By 2019 it became obvious that this was no “blip”. It has far-reaching social and economic implications across all of the UK.
[The printed articles then continues…]
Indeed, people living longer into a healthy older age is a cause for celebration. It is by far the most important reason why we expect the human population to reach nine, ten, or at most 11 billion people by the end of this century.
But demographers do not expect life expectancy to continue to rise as quickly as it has been growing in recent decades. Already we are seeing fewer and fewer reports of people reaching spectacularly older ages. The human body is a little like a washing machine that has a design life of some 70 or 80 years, a machine with very little chance of much going wrong for the first half of our lives, the years in which we have most of our children. That is how we are evolved to be.
Harry also misunderstands just how few children people are now having. Today, there is no reason to panic about how many babies we have.
Many years ago, the majority of countries in the world saw their rates of childbirth reduce below ‘replacement level’, which is roughly 2.05 children per couple. (The ‘replacement’ figure is slightly higher than two because not all children survive to be old enough to be able to have children of their own.) In other words, the global birthrate is shrinking.
Latest estimates published by the United Nations in June revealed that the average couple are now expected to have 2.42 children over the course of their lives, 2.00 by 2080 and 1.94 by 2100.
Recently, however, childbirth rates have been falling much faster than the United Nations demographers projected, so these are likely to be over-estimates. There are not, in other words, too many children about.
Then bear in mind that Harry is living in Europe, the continent with the lowest birth rate, and where the average number of children couples are having is 1.62.
On Friday, the Office for National Statistics revealed that birth rates in Britain have hit a historic low. A total of 657,076 children were born in 2018, which was down 3.2 per cent on the year before and nearly 10 per cent down on 2012.
Without net inward migration, the population of Europe will fall to fourth-fifths of what it is today in just one generation, two-thirds in two generations, and will nearly halve by the third generation. Europe is very fortunate to be a net recipient of international migrants. Without them, the continent’s very elderly population in future would be hard to care for.
If the Prince became more interested in this issue, he could learn that people tend to have fewer children when they migrate, so the more international migration there is towards places such as Europe, the lower total global population is expected to be. He could become an advocate for more migration.
There is also the rest of the world to consider. The average number of children per couple across North America is now 1.76. Across the rest of the Americas it has fallen to 1.96 and is expected to keep falling, reaching 1.80 by 2025.
The whole of Asia is already at 2.09 children per couple, and that is currently expected to fall to 1.94 by 2035. Africa has a fertility rate of 4.16, which was the number of children people in Brazil had in 1975, or India had shortly after 1985 (Queen Elizabeth, Harry’s grandmother, gave birth to four children between 1948 and 1964).
Today, couples in Brazil have only 1.67 children, and in India they have 2.14. In India, childbirth rates are continuing to fall very quickly, as they are across all the countries of Africa. Rates are now static in Brazil.
Meanwhile, back in the UK the number of children every potential couple is expected to parent by 2020 is just 1.75.
A more important issue for Harry to consider is what he and his children do: how much they fly; how many homes they occupy; how they heat their houses and whether they could be better insulated; and whether he and they wear out their clothes rather than buy new ones to constantly try to look smart.
He is in a fortunate position to do something about his concerns, as is Meghan and as will be their child or future children.
The UN figures are only projections and they could easily go awry. In the past it was the European conquest of the Americas and Africa that sparked worldwide population growth from under a billion to nearing eight billion now. That will not be repeated.
However, Harry could warn us about what might rekindle the childbirth rates of the past. Harry knows about war. A Third World War is not unthinkable in his lifetime – and wars almost always create baby booms. Most people do not understand this.
Other precursors of population growth are widespread famine, as happened in India under the rule of the British in the past. Harry could promote vegetarianism to reduce that risk, if he were concerned.
He could also point out that we would be sensible to occupy our thoughts on the risk of a global dis-ease pandemic and how to handle one if it happens.
People will always have more children if mortality rates suddenly rise. They always have. In explaining this, Harry could help us all learn more.
And many more people will listen to him than to Oxford University professors!
Danny Dorling is the co-author of Why Demography Matters, published by Polity Press.
For a PDF of this article and link to its on-line first publication click here.
And for more on the graph below click here.
The number of 18 year olds in the world – UN world population prospects estimates, 2019 (millions of people aged 18, 1950 to 2100)
August 5, 2019
Ministers will still claim, to their dying breath in some cases…
“Ministers will still claim, to their dying breath in some cases, that there is no ‘evidence’ linking their actions to the rising numbers of premature deaths in the UK, but eventually they will buckle under the weight of reports showing they are wrong.”
Foreword to Data in Society:
Challenging Statistics in an age of globalization,
edited by J. Evans, S. Ruane and H. Southall, Bristol: Policy Press
By Danny Dorling
This is the third book in a long running series, each one (and much else besides) initiated by the Radical Statistics Group. In 1979, the first book, Demystifying Social Statistics, revealed how social statistics are constructed and controlled in ways that serve the powerful, and argued that they needed to be contextualised, critiqued and reconstructed. Statistics at that time were most closely associated with the state. Although they were not to know it, the authors of that first volume were writing just before a government would take power that had almost total disregard for the validity of both social data and society itself (‘no such thing as society…’). Famously, the Conservatives changed the official definition of unemployment many times, over and over again, to reduce the headline count, especially after that particular indicator soared above three million. Many government statisticians lost their jobs in the early 1980s due to swingeing cuts to public funding. The same happened again when a Conservative government took power in 2010, aided and abetted by the Liberal Democrats.
The second collection of Radical Statistics essays, published as Statistics in Society in 1999, explained how social statistics are rarely collected without an underlying purpose, the importance of how they are assembled and interpreted, and finally how those interpretations were then described – often by the press – as something other than what their authors had originally intended. And it emphasised that what mattered was who was paying for the statistics. It sought to demystify social statistics by including a photograph of every author – rare at that time.
Again, and although they were not to know it, within a few years of the publication of that book the then party of government was involved in determined statistical manipulation. In the run up to the 2001 general election, the Labour Party published ‘What has Labour done for you in your constituency’. It turned out that no matter where you lived in the country, or what statistic you clicked on, things had only got better. What the party officials had done was to alter the time range of the statistic, or the geographical area being referenced, to achieve this in all cases. I published a detailed list of all the many forms of manipulation which were undertaken (Dorling et al, 2002). Official statistics had been cleaned up, so now the deception was mainly taking place on political party websites, no longer so often in official statistics.
In the title of this 2019 book, Data in Society, the word statistics now appears in the subtitle, Challenging Statistics in an Age of Globalisation. In just two decades we now talk of data probably more often than statistics. And we do not know what new forms of deceit await us in a few years’ time, although this volume gives us many clues. In very recent years Cambridge Analytica and a slew of other apparently dark outfits have been involved in everything from encouraging people to vote Leave (having harvested their and their friends’ data), through getting folk to buy even more things they do not want to buy. All this is being done with the collusion of Facebook (2004), Google (1998), Amazon (1994) and other modern-day Behemoths that were not even imaginable in 1979 and barely in existence in 1999. The book you are holding now explains all that, but also that government still frequently misleads, as do many politicians when they use numbers, and that official statistics remain under threat – although they are far better policed and scrutinised today than they ever were before. We have a far more statistically literate population now, both in the UK and world-wide, and the current volume provides a number of examples of the way in which both statisticians and non-statisticians are using statistics for purposes of debunking and counter-information.
So, what will the 2039 volume be about? Many things change but at the heart of the matter, truth and bravery will be most important. Speaking truth to/of power will still require guts, and an understanding of how you can be misled. You can be just as much, if not even more, effectively fooled with numbers as with words. The editors and authors of this volume are to be congratulated for bringing this all together now.
Everything changes, social media is born, data mining becomes an industry, huge and reliable surveys of the population of the global south become available – many for the first time. Those who were not properly counted begin to be included, those who try to evade being enumerated because they don’t want to pay tax, are increasingly better and better estimated. The damage caused by austerity is enumerated. Ministers will still claim, to their dying breath in some cases, that there is no ‘evidence’ linking their actions to the rising numbers of premature deaths in the UK, but eventually they will buckle under the weight of reports showing they are wrong. And progressive politics will also adapt. Statistics, used well, are the weapon of the otherwise unheard, unseen, ignored. There is such a thing as society – the data shows us what it is, how it works, and what happens if, and occasionally when, it falls apart.
Reference
Dorling, D., Eyre, H., Johnston, R. and Pattie, C. (2002) A good place to bury bad news? Hiding the detail in the Geography on the Labour Party’s website, Reports and Surveys The Political Quarterly, Vol 73, No.4, p476-492 http://www.dannydorling.org/?page_id=...
For a PDF for this short Foreword and link to the book is this published in click here.
To listen to a recent talk related to these issues click play below:
Danny Dorling speaking on the launch of the third edition of the book “Inequality and the 1%”, about the health crisis, and a better politics, in the Book tent at the Wilderness Festival, August 4th, Cornbury, Oxfordshire.
July 23, 2019
The smaller generation to come – worldwide
Here’s some good news for the planet: the human population is set to peak and stabilise, not rising much above 9.7 billion, the total that it will reach around the year 2050, according to the latest UN figures. Danny Dorling, Halford Mackinder Professor of Geography at Oxford University, explains how this works, and why it is something to celebrate.
On Monday 17 June 2019 the United Nations revealed momentous news. The world did not notice, but soon it will. The headline of their own report read “9.7 billion on Earth by 2050, but growth rate slowing”.
A day earlier the UN projection for the year 2050 had been nearer 9.8 billion, and the projection for 2100 had been 11.2 billion people. Something very significant had occurred.
Some parts still growing, but…
The United Nation’s report concentrated on where there will still be the most growth. To quote: “India is expected to show the highest population increase between now and 2050, overtaking China as the world’s most populous country, by around 2027. India, along with eight other countries, will make up over half of the estimated population growth between now and 2050. The nine countries expected to show the biggest increase are India, Nigeria and Pakistan, followed by the Democratic Republic of the Congo, Ethiopia, Tanzania, Indonesia, Egypt and the United States of America.”
But their report continued: “The population size of more and more countries is actually falling. Since 2010, 27 countries or areas have seen a drop of at least one per cent, because of persistently low fertility rates. Between now and 2050, that is expected to expand to 55 countries which will see a population decrease of one per cent or more, and almost half of these will experience a drop of at least 10 per cent.”
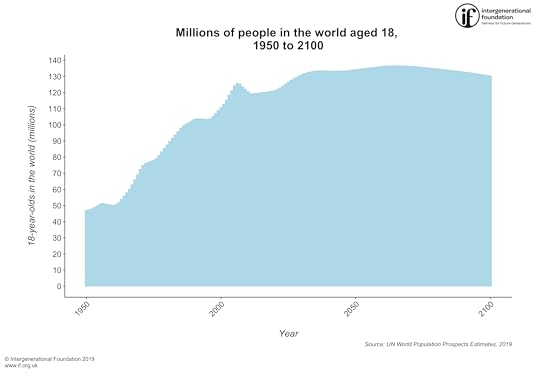
Bellwether 18-year-olds
The UN did not mention their new 2100 prediction in this particular press release. The first graph below shows the number of people the UN estimate have been (and will be) aged 18 each year from 1950 until 2100. The future they predict is remarkably smooth.
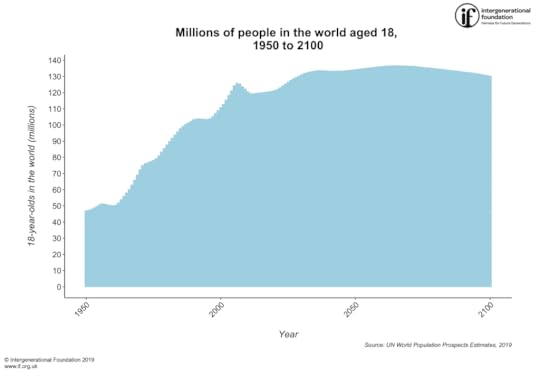
The number of 18 year olds in the world – UN world population prospects estimates, 2019 (millions of people aged 18, 1950 to 2100)
However, some reporters noticed that something was very new: “The world’s population is slowing down and could stop growing – or even begin decreasing – by 2100” one noticed, before adding that “…[UN population] division director John Wilmoth said this outcome ‘is not certain and in the end the peak could come earlier or later, at a lower or higher level of total population.’”
However, John’s central projection for the year 2100 is now 10.9 billion people, 300 million fewer than the UN said they expected, the day before.
Even fewer babies – but longer lives
Human population growth is slowing dramatically and it is slowing because people are having fewer and fewer babies as compared to their parents – everywhere – without exception.
More importantly, they are having fewer than we thought they would have a few years ago when the fertility rates were already reducing dramatically and unprecedentedly. Our species has never – ever – had so few children.
The reason why the total human population of the planet will keep on growing for 50, or 60 or 70 years (but almost certainly not for 80 years) is because people are living longer. It is now no longer because we are having more children.
If people in a particular place live for 80 years rather than 40 (on average), they double the number of people found in that place at any one time without a single additional baby needing to be born.
The human species is ageing – rapidly. More rapidly than we thought it was by Monday 17 June 2019! And this is wonderful news because it is caused by fewer people dying when young and healthcare for the elderly improving.
Tell-tale peaks for 18-year-olds
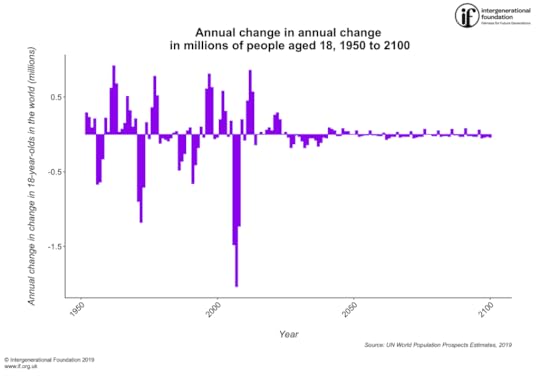
The next graph below shows the annual change in the number of 18-year-olds now predicted to occur each year and the number that did occur each year in the last 68 years. The peaks in the graph below occurred in 1955, 1970, 1985 and 2005, with the next predicted to be in 2025. The length of time between these peaks in years is 15, 15, 20 and 20.
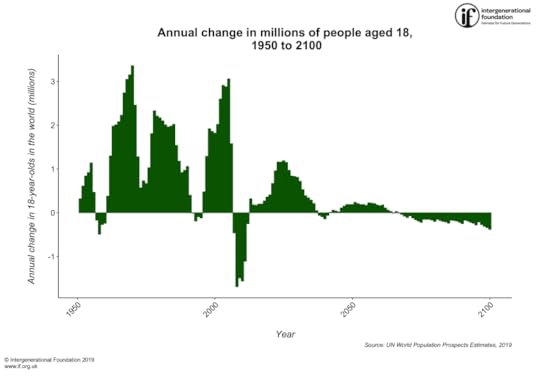
The number of 18 year olds in the world – UN world population prospects estimates, 2019 (annual change in millions of people aged 18, 1950 to 2100)
It is the trend in the corrections to the UN revisions that matters most. In the 2011 estimates the UN demographers suggested that 10 billion was most likely by 2100. The subsequent 2013, 2015 and 2017 revisions updated that estimate to just over 11 billion. But now the 2019 revision is reducing that estimate again.
Six years ago, on 11 June 2013, I published a book titled Population 10 billion in which I made a guess that the UN were getting it wrong. It was just a guess, but it turned out to be right. The reason they were making this mistake, I said, is that they had failed to notice an echo of a baby boom. They were using very current fertility estimates to project forwards, unaware that fertility at the start of this current century was slightly and unusually elevated – due to so many people turning 18 around the year 2005.
(Non-robotic) implications for smaller generations
The slowdown in the growth and then the fall to come in young adults worldwide raises all kinds of issues. In general, smaller generations have been more powerful generations in the past. Their bargaining position is better. Each child becomes more precious.
But in strange times like these, people begin to try to imagine all kinds of new scenarios. However, “artificial intelligent” robots are not going to replace the young. The reason why is simple. We are an animal, evolved to be acutely aware of just how much attention we are or are not getting from others of our species. That is how for millennia those of us that survived, survived. We were cared for, and cared for our young. Most of us are acutely aware of even the smallest slight we receive, the mildest of ignoring. Most of us warm with happiness when we are praised by those we love. Emulating humans to fool other humans with machines is a fools’ game because it is trying to compete with what drove our evolution. Instead, robots are best used to undertake repetitive tasks that our inquisitive nature hates.
Predictions in a precarious world
What is likely to happen next? Look again at the graph above of the future change in the number of 18-year-olds predicted to carry through to the year 2100. Note how the UN prophesies a rapid move towards stability. To achieve that, every 18-year-old has to have slightly more than two children each (because a few babies will still die even in the most utopian of futures).
But then look at what has happened most recently. Look at the falls between 2007 and 2013 in the graph above and note how that plummeting below the line almost exactly fits the gap that can be seen in the time series between 1991 and 1996, around 17 years earlier.
Young adults in future are unlikely to conform to what the UN demographers currently predict. If we manage to avoid world war, famine, pandemic and severe prolonged global economic crisis, then young people will continue to have fewer and fewer children each – for some time to come. It is what women want. And more and more women now get what they want.
Change in change
Finally, if you find it hard to believe that the finest demographic minds the world can muster might still be making a mistake, even though they now are at least moving their predictions down toward what reality is telling them, look at the last graph in this series of three, below. The graph shows the “change in change” each year in 18-year-olds.
This is just one change figure subtracted from another. To give an example in 2006, 2007 and 2008 the number of 18-year-olds thought to be alive worldwide on 1 July each year was 125.850, 125.386, and 123.692 million respectively. The change between those three numbers was -0.46 and -1.69 million: the population was falling, and the change in change between those two numbers, the rate of deceleration or acceleration, was -1.23 million – a rapid deceleration (or acceleration in the rate of fall if you want to see it that way).
The final graph below shows all of those “change in change” figures derived from the very latest UN population estimates for the world. Each great deceleration – the troughs in 1955, 1972 and 2007 – has been greater in magnitude than the last.
Now look at what the UN think will happen in future and then start planning for even fewer 18-year-olds than they are now suggesting there will be. Because they are still ignoring this clear downwards trend.
The number of 18 year olds in the world – UN world population prospects estimates, 2019 (annual change in change,,millions of people aged 18, 1950 to 2100)
Web links:
https://news.un.org/en/story/2019/06/...
https://eu.usatoday.com/story/news/na...
https://population.un.org/wpp/
http://www.dannydorling.org/books/10b...
http://www.dannydorling.org/books/dem...
Why Demography Matters
Danny Dorling & Stuart Gietel-Basten
Why Demography Matters?
http://www.dannydorling.org/books/dem...
For a PDF for this article and an on-line link to the original posting click here.
A talk to school children in London the day after the UN released its latest biannual global population estimates: demography and what else we worry about in the very near future…
Danny Dorling speaking at Channing Senior School and to pupils from neighbouring schools, London, Archway, June 20th 2019
World population – United Nations 2019 revision – people aged 18, estimated and projected
18 year olds
thousands
millions
Change
Change in Change
1950
47 028
47
1951
47 351
47
0.32
1952
47 963
48
0.61
0.29
1953
48 802
49
0.84
0.23
1954
49 725
50
0.92
0.09
1955
50 863
51
1.14
0.21
1956
51 332
51
0.47
-0.67
1957
51 165
51
-0.17
-0.64
1958
50 673
51
-0.49
-0.33
1959
50 403
50
-0.27
0.22
1960
50 164
50
-0.24
0.03
1961
50 547
51
0.38
0.62
1962
51 848
52
1.30
0.92
1963
53 831
54
1.98
0.68
1964
55 839
56
2.01
0.03
1965
57 915
58
2.08
0.07
1966
60 142
60
2.23
0.15
1967
62 879
63
2.74
0.51
1968
65 933
66
3.05
0.32
1969
69 085
69
3.15
0.10
1970
72 444
72
3.36
0.21
1971
74 906
75
2.46
-0.90
1972
76 187
76
1.28
-1.18
1973
76 758
77
0.57
-0.71
1974
77 489
77
0.73
0.16
1975
78 158
78
0.67
-0.06
1976
79 190
79
1.03
0.36
1977
81 000
81
1.81
0.78
1978
83 330
83
2.33
0.52
1979
85 544
86
2.21
-0.12
1980
87 711
88
2.17
-0.05
1981
89 811
90
2.10
-0.07
1982
91 823
92
2.01
-0.09
1983
93 781
94
1.96
-0.05
1984
95 762
96
1.98
0.02
1985
97 778
98
2.02
0.04
1986
99 315
99
1.54
-0.48
1987
100 490
100
1.18
-0.36
1988
101 409
101
0.92
-0.26
1989
102 382
102
0.97
0.05
1990
103 441
103
1.06
0.09
1991
103 842
104
0.40
-0.66
1992
103 835
104
-0.01
-0.41
1993
103 648
104
-0.19
-0.18
1994
103 563
104
-0.09
0.10
1995
103 438
103
-0.12
-0.04
1996
103 921
104
0.48
0.61
1997
105 212
105
1.29
0.81
1998
107 131
107
1.92
0.63
1999
108 995
109
1.86
-0.06
2000
110 814
111
1.82
-0.04
2001
112 832
113
2.02
0.20
2002
115 431
115
2.60
0.58
2003
118 338
118
2.91
0.31
2004
121 214
121
2.88
-0.03
2005
124 273
124
3.06
0.18
2006
125 850
126
1.58
-1.48
2007
125 386
125
-0.46
-2.04
2008
123 692
124
-1.69
-1.23
2009
122 202
122
-1.49
0.20
2010
120 638
121
-1.56
-0.08
2011
119 525
120
-1.11
0.45
2012
119 270
119
-0.25
0.86
2013
119 589
120
0.32
0.57
2014
119 765
120
0.18
-0.14
2015
119 939
120
0.17
0.00
2016
120 140
120
0.20
0.03
2017
120 344
120
0.20
0.00
2018
120 611
121
0.27
0.06
2019
120 972
121
0.36
0.09
2020
121 379
121
0.41
0.05
2021
122 050
122
0.67
0.26
2022
123 013
123
0.96
0.29
2023
124 176
124
1.16
0.20
2024
125 341
125
1.16
0.00
2025
126 532
127
1.19
0.03
2026
127 685
128
1.15
-0.04
2027
128 655
129
0.97
-0.18
2028
129 494
129
0.84
-0.13
2029
130 327
130
0.83
-0.01
2030
131 133
131
0.81
-0.03
2031
131 849
132
0.72
-0.09
2032
132 382
132
0.53
-0.18
2033
132 775
133
0.39
-0.14
2034
133 116
133
0.34
-0.05
2035
133 406
133
0.29
-0.05
2036
133 617
134
0.21
-0.08
2037
133 665
134
0.05
-0.16
2038
133 605
134
-0.06
-0.11
2039
133 510
134
-0.09
-0.04
2040
133 366
133
-0.14
-0.05
2041
133 308
133
-0.06
0.09
2042
133 319
133
0.01
0.07
2043
133 384
133
0.06
0.05
2044
133 424
133
0.04
-0.02
2045
133 447
133
0.02
-0.02
2046
133 554
134
0.11
0.08
2047
133 706
134
0.15
0.04
2048
133 893
134
0.19
0.04
2049
134 080
134
0.19
0.00
2050
134 267
134
0.19
0.00
2051
134 503
135
0.24
0.05
2052
134 713
135
0.21
-0.03
2053
134 907
135
0.19
-0.02
2054
135 095
135
0.19
-0.01
2055
135 269
135
0.17
-0.01
2056
135 497
135
0.23
0.05
2057
135 714
136
0.22
-0.01
2058
135 920
136
0.21
-0.01
2059
136 105
136
0.18
-0.02
2060
136 264
136
0.16
-0.02
2061
136 441
136
0.18
0.02
2062
136 547
137
0.11
-0.07
2063
136 603
137
0.06
-0.05
2064
136 632
137
0.03
-0.03
2065
136 627
137
-0.01
-0.03
2066
136 655
137
0.03
0.03
2067
136 644
137
-0.01
-0.04
2068
136 599
137
-0.04
-0.03
2069
136 522
137
-0.08
-0.03
2070
136 410
136
-0.11
-0.03
2071
136 338
136
-0.07
0.04
2072
136 213
136
-0.12
-0.05
2073
136 050
136
-0.16
-0.04
2074
135 861
136
-0.19
-0.03
2075
135 638
136
-0.22
-0.03
2076
135 490
135
-0.15
0.07
2077
135 343
135
-0.15
0.00
2078
135 193
135
-0.15
0.00
2079
135 019
135
-0.17
-0.02
2080
134 820
135
-0.20
-0.02
2081
134 674
135
-0.15
0.05
2082
134 498
134
-0.18
-0.03
2083
134 303
134
-0.20
-0.02
2084
134 091
134
-0.21
-0.02
2085
133 850
134
-0.24
-0.03
2086
133 684
134
-0.17
0.07
2087
133 509
134
-0.18
-0.01
2088
133 319
133
-0.19
-0.01
2089
133 101
133
-0.22
-0.03
2090
132 850
133
-0.25
-0.03
2091
132 678
133
-0.17
0.08
2092
132 483
132
-0.19
-0.02
2093
132 267
132
-0.22
-0.02
2094
132 023
132
-0.24
-0.03
2095
131 747
132
-0.28
-0.03
2096
131 533
132
-0.21
0.06
2097
131 266
131
-0.27
-0.05
2098
130 957
131
-0.31
-0.04
2099
130 617
131
-0.34
-0.03
2100
130 240
130
-0.38
-0.04
How to Solve the Housing Crisis
It might not be sexy, but the answer to the endemic housing crisis not just in Britain but across the West is something relatively simple: effective property taxes
‘I’ll build houses for your children!’ said the man with the microphone standing at the front of the packed hall. No one had been able to really see the slides he had shown, but the images were colourful when seen from a distance. They were artists’ drawings of the proposed new development: images suggesting that it would not greatly affect the view from the city, and would be built below the ‘ridge line’. And it would all be constructed to the highest of environmental standards, he said. ‘We have to build for the next generation’, he explained. ‘Any questions?’
I put my hand up. Eventually I was chosen. ‘My children will not be able to afford your houses’, I said, ‘is that why you will not say how much they will cost?’ He looked at me partly in pity, partly in annoyance. Some of the audience laughed as they knew I was a professor in the city and they realised that the property developer was assuming I was poor.
But it was true. The housing he was planning to build would not be for any of our children, not even mine. He wasn’t going to tell us the price. He knew that he planned to sell these new-build homes to whomever would give him the most money. He knew that would not be anyone in the room, let alone any of their children. But he needed to try to minimize our complaints for when he sought planning permission. He had to be able to say that he had consulted the ‘local community’. Even he did not realize that inequalities had risen so high that the children of a university professor would not be able to afford to live in the city they had grown up in. Not unless they had some huge inheritance.
In the more affluent parts of the UK, money is made from building large detached homes for people who commute to another city, or simply buy one as an investment. The big money cannot be made out of the little people. It cannot even be made out of the average or even much-better-off anymore. Income inequalities have risen decade after decade, wealth inequalities have reached astronomical extents and almost all the ‘spare’ money is now held by the extremely well-off. The extremely-well-off have become ‘the market’.
The man standing in front of me slicked back his hair. Most of the objections he had heard in the hall had been from elderly and better-off people complaining that his development might spoil their views.
This was what he wanted. He wanted to present himself as the champion of the underdog, the provider of homes for the young. It soon became apparent that who exactly would get those homes and at what price was none of our business – that was for ‘the market’ to decide. What he had to do is to ensure he was allowed to play in that market. He had to get permission to build. He was a property speculator, and this was what he did best. He looked rather pleased with himself.
Learning to Love Taxation
How do you stop speculation? How do you ensure that homes are built for the people that need them? How do you make sure that the homes that exist are well-occupied? That particular planning meeting was mostly populated by well-off elderly people who, when not attending meetings such as these, rattle around in what had once been a large family house, watching the value of ‘their’ property rise and objecting to any development nearby that might damage their accrued wealth.
These older, wealthy people only partly want to protect their wealth for themselves and their cruise holidays. They are also worried about their children and grandchildren and want to pass on as much as they can when they die. They see it as in their interests to do whatever they can to both maximize the price of their own homes and minimize the taxation their children might ever have to pay on what they inherit. They have been taught that being selfish is good and tax is bad. This is, after all, the generation that saw a Prime Minister pronounce that ‘there is no such thing as society,’ then fight a political war over that premise, and then win.
But the truth is the very opposite. Taxation is a social good — and it is our most powerful tool to solve the housing crisis. Short of a command and control economy, it has only ever been through effective taxation that the city has been well planned. Taxation preserves choice but deters speculation. Should your motive be to build to amass great profits, but such profits might be properly taxed, you will not bother to build and someone else with far better motives than you will build in your place.
Where homes are well taxed, people try to fit into them efficiently. The more people living in the home, the more there are to share the paying of the local property tax. And where a local property tax is made progressive, where it rises continuously (and preferably exponentially) with the value of the property, there is an incentive not to live in the most expensive property you can.
One factor that matters greatly is how property tax assessments are determined and how that process is influenced politically. An efficient system is one which ensures that the tax is actually being applied to the true value of the land and property upon it. One useful way to ensure this is for the state to have the power to compulsorily purchase property at the value it has been assessed for taxation. This gives owners an incentive to declare that their property is worth more and to volunteer to pay more property tax.
New property taxes are introduced from time to time and show what is possible. Since 2013, in Ireland, the national property tax has been 0.18% of a property’s value per year. Thus, on a property worth €300,000, the owner has to pay €540 a year in addition to all other taxes. However, for properties valued at over €1 million, the rate is 0.25% a year on any value over that million. This means that someone living in a property worth €1.3 million would pay €3,040 a year. Someone on a low income in an expensive property that they own outright would have no problem paying this tax, if they secured a small mortgage on it – a mortgage which could be repaid when the home is sold.
The new rates in Ireland are quite low and 90% of properties are worth less than €300,000, so most Irish residents pay only €90 to €495 a year. There is clearly a great deal of scope to raise these taxes if a government wants to get property prices and speculation under control. Prices are currently rising rapidly in Dublin, not least because of Brexit. However a further slight increase to the property taxes, would soon soften that rise. Wealth taxes such as this are also progressive because they reduce inequalities in the future, meaning that the rich inherit less through the taxation’s effect in dampening prices.
In New Hampshire, USA, property taxes range from 0.41% a year to 0.21% a year, as a proportion of the value of the home and the county it is in. Critics argue that these ‘high’ taxes mean a big and inefficient government. In reality, Americans have little opportunity to get to know what a big government actually is. All of America has small government. Taxes in the USA in general are lower than in almost any other affluent country and public services are generally poor as a result. This especially harms education with Americans usually being at the bottom of international league tables by ability in mathematics (see Figure 4.14 below). In almost all other affluent nations in the world, schools are not funded by local property taxes: they are funded nationally so that poor areas do not get poorly funded schools.

Economic Inequality and the mathematics ability of young adults up to age 24, 2012
Source: Dorling, D. (2017) The Equality Effect: Improving life for everyone, Oxford: New Internationalist
In the Netherlands, one of the countries with the most numerate populations in the world (see Figure 4.14 above), property is taxed at around 0.1% to 0.3% a year. Second and subsequent homes, however, are assumed to have an annual yield of about 4%. This is then taxed at 30% a year, meaning a total tax of about 1.2% of the value of each second home property in the Netherlands per year. In the Netherlands, children become clever, the old live longer and land is efficiently used. You don’t leave a second home empty when you have to pay such a tax on it.
In the United States, the popular narrative suggests that taxation and freedom are opposites. In reality, taxation is freedom because it is taken from everyone. It is the very opposite of theft. Theft is about individual loss and a criminal act. Taxation is everyone’s gain. When property and land is well taxed its value does not rise and rise with speculation; homes instead become affordable, and local schools and hospitals are well funded. No one loses out because the affluent are still able to live in the same apartments as elsewhere, the apartments just cost less to buy in the first place.
In contrast, where property is not well taxed it tends to rise exponentially in value. The property in some areas and some parts of the city becomes worth much more than in other parts. Before you know it, you are building walls around your more affluent estates, to separate the children from the poorer end of the road from the richer end. At the extreme these walls can be eight-foot-high and topped with metal spikes sharp enough to kill a child. The picture below shows just such a wall built in 1934 in my home town of Oxford.

One of the two Cutteslowe walls, Oxford, late 1930s (note the spikes).
One of the two Cutteslowe walls:
Without taxation of property, social divides increase, walls begin to be built ever higher and the fear of others grows. Determining what level of taxation is best and how it can best be collected is not easy, but you can tell from the social outcome when you are getting it right. Taxation is a tool to find freedom, improve housing, enhance education, and ensure good health.
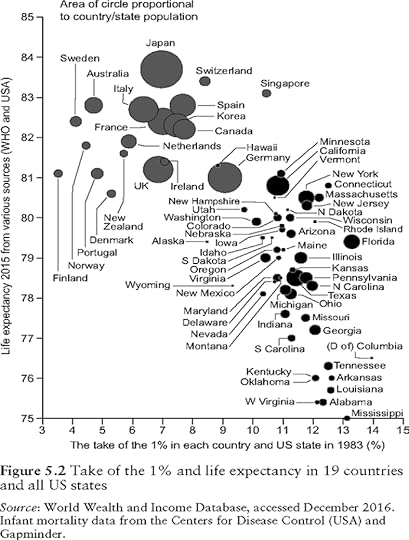
Take of the 1% in 1983 and life expectancy in 19 countries and all US states in 2015
Source: One figure from the 2018 book: Do We Need Economic Inequality?
When people begin to see their freedom to choose increase; when most know they might really be able to choose where to live in the city; when there is a greater and greater mix of people and housing along a road, and also within almost all neighbourhoods; then you know something is working well.
If you want to see the greatest housing success in the world then travel to Japan and see how Tokyo works, or smaller cities like Kyoto. In Japan, the annual property tax is about 1.4% of the value of property. Over and above that there is the municipal tax of around 0.3%. Furthermore, to quote the local press, “empty land is taxed at a higher rate than land that has a residential structure on it, just as land designated for agriculture is taxed at a higher rate if it is not being used to grow something.” Societies with lower income inequalities and better property taxes tend to almost always be better housed, educated and have better health than those who do not.
In the UK, one of the most unequal countries in the rich world, people are at a loss as to how to solve the housing crisis. ‘Section 106’ agreements are now used to build the bulk of any so-called affordable housing which is only done at the whim of property owners. Taxation is still seen as a social bad, profit as good and there is a ‘this is as good as it gets’ attitude to what might be possible. Both Toronto and Vancouver now have 15% taxes being levied on foreign buyers to try to prevent speculation from overseas investors. As yet London shows no signs of even considering such a move.
The British government says it can’t introduce a property tax like Ireland’s that covers all property, because they have not quite got around to registering all the property in Britain. This is particularly the case for those that have not changed hands for a couple of hundred years or more. It is always easy to come up with such excuses. The Irish suddenly taxed all their property when the economic crises of 2008/2009 forced them to. They created a register of all property in Ireland in little over a year. Google Earth has many uses!
The Housing Pendulum
Property taxation is not only good for the less well-off, or for society as a whole. It is also a mechanism for protecting the affluent from folly. Land and property speculation inevitably eventually both end in disaster. Many people find this impossible to believe and that is part of the reason why prices can rise so high.
“Surely central London will always be one of the most desirable places on the planet?” They say. They forget what central London was like in the 1980s. They also forget that it is a major financial city of a country in relative economic decline today. They forget that home prices almost halved in the space of just a few years in central Tokyo in the early 1990s. But, most importantly, they forget the oldest of stories from the beginning of capitalism. Our current way of living began in Amsterdam in the 16th century, and that city provides the most serious warning of what happens when speculation is not controlled.
Today the Dutch live in one of the countries with the lowest rates of income inequality. Life expectancy is high and rising. People are well-housed and a majority of the population walks and cycles to work. So how on earth was this achieved in the cradle of capitalism? One answer is that the Dutch have had far longer to learn from their earlier mistakes, especially those mistakes that concerned property.
In Amsterdam there was euphoria in the early 1700s. The power that Spain had held over South America for over two hundred years from 1492 had been waning. Some Dutch merchants began to invest in companies designed to exploit the new power vacuum and profit from rapidly increased trade with the Americas. All went well for a few decades. Amsterdam was already an incredibly rich city and it began to teeter towards new dizzying heights of affluence.
The United Provinces (with Amsterdam at their centre) had seen the founding of the Dutch East India Company a century before, in 1602, that private company already dominated trade with New Guinea, Borneo, Sumatra and Java. The Dutch had colonies in the Caribbean, Brazil and in what is still known as Manhattan. Manhattan was an American development that was commissioned by that Dutch East India Company after the Halve Maen sailed from Amsterdam and dropped anchor in a convenient harbour in 1609. It only became part of a larger ‘New York’ when the English took it by force in 1664. But the English didn’t really own it for long. Four years later the Dutch stadtholder William III, Prince of Orange invaded England in what became called the Glorious Revolution. The Dutch were far more important in the past of both the USA and the UK than is commonly recognized.
Amsterdam was sitting pretty at the start of the 18th century, it was at the top of the world, but then, around 1738, there was a sudden loss of confidence and a financial crisis ensued. House prices in the Herengracht, one of the most expensive streets, peaked that year and subsequently fell by a third in real terms by 1751. The market rallied a little to a new peak in 1778 “…and then not again for 250 years [from 1738 to 1988],” according to Neil Monnery’s 2011 book Safe as Houses. “The middle of the eighteenth century marked the beginning of a period of plodding decline that would continue for the next two centuries.” After being at the top of the world, the fall can take a very long time.
Housing prices can and have fallen for more than two hundred years in the past in the centre of Amsterdam. Think about that. That will happen again in other parts of the world, especially the parts that are today most overheated. The end result is not disaster – it is the most densely populated country of Europe relying on planning and taxation to bring about some of the highest levels of freedom experienced anywhere on the planet.
Danny Dorling (Geography, Oxford University) and Polly Neat (Chief Executive of Shelter) talking on the housing crisis in England, Introduced by Alexandra Jezeph as part of the ‘Fixing the Future Conference’, Bright Blue (an independent think tank and pressure group for liberal conservatism.), The Guildhall, London, 8 July 2019
Back in England, in the community hall near my home in Oxford, the man with the slick black hair was wrapping up the meeting. He was about to try to get permission from the local planners to develop what would soon be some of the most expensive homes to ever be built on the edge of the city where I live and work where I grew up, where my parents were young adults and where my grandfather once lived and where my children will never be able to settle down unless everything changes. He had the audience where he wanted them, opposing his housing not because it would be unaffordable, but just because they are NIMBYs. Someone asks him: what’s all the rush was about? Why after all these centuries did his firm of property developers, and the Oxford College that owned the fields on the edge of the city, want to build now?
“Corbyn,” he muttered and then look embarrassed, as if he had let something slip that he should not have said. A few months earlier, the shadow housing minister John Healey had announced that: “we will build for those who need it, including the very poorest and most vulnerable, with a big boost to new social rented homes. We will also build Labour’s new affordable homes for those in work on ordinary incomes who are priced out of the housing market and being failed by housing policy.”
Two months earlier again, it had been announced how the British Labour Party would get the land for these new homes: “Labour is considering forcing landowners to give up sites for a fraction of their current price in an effort to slash the cost of council house building. The proposal has been drawn up by Healey and would see a Jeremy Corbyn-led government change the law so landowners would have to sell sites to the state at knockdown prices. Landowners currently sell at a price that factors in the dramatic increase in value when planning consent is granted. It means a hectare of agricultural land worth around £20,000 can sell for closer to £2 million if it is zoned for housing.” A Labour government would take the land, pay just £20,000 an acre, and build the homes.
The man needed to build now because after another election it could well be too late for him to make his profit. Rather than a few large detached houses being built on those fields on the edge of Oxford the space could be used for social housing. To his mind this was the worst kind of all housing of all – good quality social housing with views into the city, housing that meant that, given a choice between renting securely and having a mortgage, you might actually choose to rent:
Housing that would help housing prices fall.
Housing that was a home.
Sometimes the pendulum swings.
…
For a PDF version of this article and a link to the Magazine it was published din click here.

Cover of the summer 2019 issues of Tribune Magazine in which this article first appeared
July 15, 2019
The cost of housing and education for young adults in England
Something went very wrong in the UK, and especially in England, during the 1980s, 1990s, 2000s and 2010s. Housing became too expensive for young adults to afford and then, by 2012, we made half of them take out huge debts to go to university. It’s time to fix both problems.
The housing crisis and educational malaise are linked. In Britain in 2019 a nurse has to pay back more on their student loan than a banker who is able to pay it back earlier and so pays far less interest. The nurse also has to pay a far greater share of his income in rent if he works in England near most major hospitals.
Both of these young adults will have much less disposable income in future to pay for their housing costs because they have those debts to repay, for many decades to come. They will be able to afford less in rent and will not be able to make the same mortgage payments that their parents might have been able to (as a share of their own income).
Mortgage interest rates may be much lower than in the past, but the total amount they would have to borrow would be far greater, this is because housing costs so much more. And the longer they rent, the more likely they are to have to rent for the rest of their lives.
The worst aspect of the debts now being built-up to pay for higher and further education is that for even a minority of the loans ever to be repaid in full, the UK will have to maintain the highest income inequalities in all of the EU28 states.
If, in future, income inequalities were to fall towards the European norm, then more and more current graduates will either default on their repayments in future, leave the country for a better life abroad, or fall below the threshold at which they have to repay – underfunding the entire student loan scheme.
Housing is in a crisis in the UK and education in malaise because of the gross income inequalities we currently tolerate. However, there are plans in place to remedy this. For the capping of most student loans one such plan is Jubilee 2022.
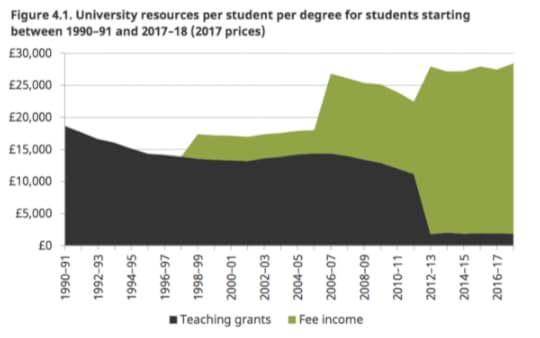
Figure 4.1, Higher Education funding in England, IFS Briefing Note BN211
Something has to give. Someone old will have to give up more because the young will not be able to afford to buy their homes in future at the prices they are trying to secure and a generation of university graduates is unlikely to swallow the idea of paying exorbitant private rents for the rest of their lives to fund the cruise ship holidays of their ever more wealthy older landlords. UK universities are now almost entirely funded by private individuals rather than the state. Those universities have – in effect – taken a very large chunk out of the future value of the British housing market.
When landlords who own many properties say that they own them to fund their private pension, ask what pension they expect their tenants to ever have. The large majority of private lets are owned by a small minority of very wealthy landlords. Changes to the law on housing are needed, to regulate rents and curtail greed, as well as the building of much more social housing.
The discussion below was recorded at the annual Bright Blue conference (a UK Liberal/Conservative think tank). It is becoming more and more obvious that the current impasse is unsustainable. Click play below to hear what solutions are being suggested and the new questions being asked.
July 8, 2019
Health Inequalities in Trump’s America and Brexit Britain
Why do people vote for politicians and rhetoric which actually puts their own lives at risk and what can be done about it? On 25 June 2019 Jonathan Metzl and Danny Dorling were asked to consider how politics in the US and UK is failing the people who most need help. They both spoke at a public meeting in the town hall of the city of Durham. The meeting was chaired and introduced by Dr Angela Woods of the Wolfson Research Institute for Health and Wellbeing, University of Durham. An audio recording is below.
Life expectancy in the USA fell from its 2014 peak of 81.47 years for women in 2014, to 81.35 years in 2015; US data for 2016 onwards has yet to be released. In 2014 women in the USA lived, on average, for 20 fewer months each than women in the UK. Men in the USA saw their life expectancy peak at 76.66 years in 2014, falling to 76.50 years in 2015; or to 33 fewer months of life to enjoy, each man that year. This was despite life expectancy also falling in the UK.
The UK does much better than the USA. Life Expectancy in the UK fell occasionally before 2014 and has been falling steadily since 2014. In 2014 women in the UK lived for 82.99 years, that fell to 82.72 in 2015 and was 82.84 in 2016 – still two months below its 2014 peak. For men UK life expectancy peaked at 79.25 years in 2014, falling to 79.04 in 2015 and was 79.18 in 2016 – still one month below the 2014 peak. The mortality figures for the UK since 2016 have shown rising overall mortality rates from each mid-year to mid-year since 2016. The two graphs below are taken from the full international comparison made most recently by ONS.
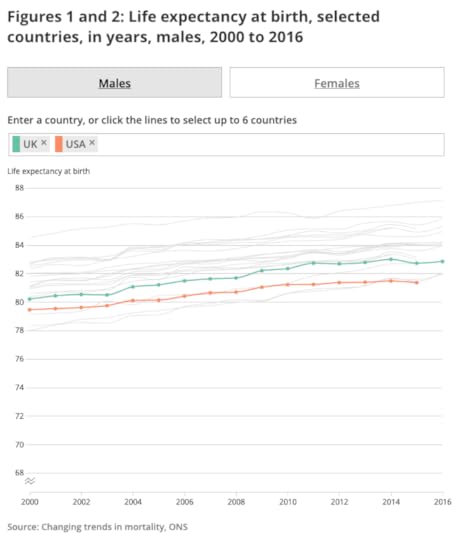
ONS estimates of male life expectancy trends in 20 affluent countries, 2000 to 2016
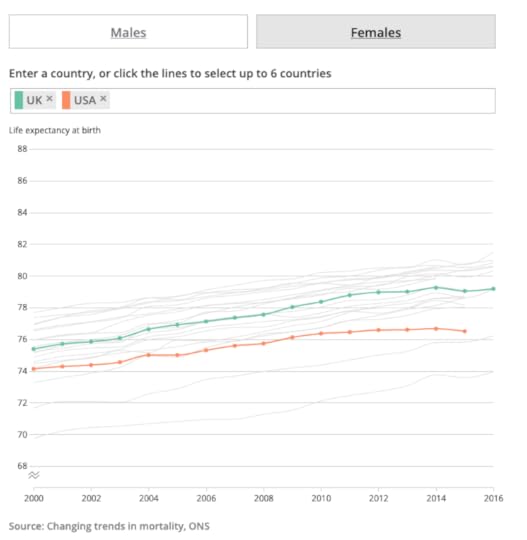
ONS estimates of female life expectancy trends in 20 affluent countries, 2000 to 2016
The source for these graphs and the ONS data behind them can be found here. ONS base their estimates on the Human Mortality database, the best international source of comparative data on life expectancy. Note how every other line for every other country in the comparison is either already above the UK and USA or is rising rapidly towards soon overtaking these two unusual states.
The data released by ONS, and used by them to make the two charts shown above, can also be used to look at changes in life expectancy over time. The two tables below do this for all those countries for which data up until 2016 is included. It is clear that for both men and women the UK has the worse recent record of all ten countries ONS has compared up until 2016. The two tables below sort these ten countries countries from that experiencing the largest fall (the UK in both the cases of women and men) to largest rise of the most recent change (Japan and Norway respectively):
Change in life expectancy in year between pairs of years from 2008 until 2016 (women)
“08-10”
“09-11”
“10-12”
“11-13”
“12-14”
“13-15”
”14-16″
0.66
0.52
0.33
0.05
0.32
-0.05
-0.15
UK
0.35
0.34
0.07
0.05
0.51
0.31
0.04
Sweden
0.19
0.39
0.26
0.16
0.69
0.54
0.07
Norway
0.20
0.30
0.10
0.10
0.50
0.10
0.10
Switzerland
0.70
0.48
0.08
0.41
0.54
-0.13
0.19
Spain
0.18
0.58
0.16
0.13
0.45
0.03
0.22
Austria
0.63
0.85
0.39
0.24
0.63
0.43
0.33
Poland
0.51
0.26
0.13
0.40
0.21
-0.13
0.35
Australia
0.47
0.61
0.28
0.39
0.81
0.31
0.36
Czech Republic
0.29
-0.47
0.13
0.70
0.40
0.42
0.37
Japan
Note that an earthquake off the coast of Tōhoku of magnitude 9.0 occurred on Friday 11 March 2011. On Thursday 7 May 2015 a new government was elected in the UK.
Change in life expectancy in year between pairs of years from 2008 until 2016 (men)
“08-10”
“09-11”
“10-12”
“11-13”
“12-14”
“13-15”
“14-16”
0.81
0.75
0.60
0.22
0.29
0.04
-0.07
UK
0.67
0.48
0.48
0.58
0.30
-0.04
0.18
Australia
0.82
0.68
0.32
0.64
0.75
-0.02
0.19
Spain
0.84
0.91
0.61
0.62
1.04
0.52
0.19
Poland
0.43
0.46
0.35
0.30
0.49
0.22
0.21
Sweden
0.07
0.69
0.60
0.38
0.66
0.17
0.23
Austria
0.41
0.50
0.63
0.53
0.78
0.60
0.43
Czech Republic
0.30
-0.10
0.41
0.77
0.55
0.56
0.50
Japan
0.50
0.50
0.30
0.20
0.50
0.20
0.50
Switzerland
0.53
0.40
0.57
0.65
0.61
0.71
0.58
Norway
Note that an earthquake off the coast of Tōhoku of magnitude 9.0 occurred on Friday 11 March 2011.On Thursday 7 May 2015 a new government was elected in the UK.
Even small changes in lie expectancy between years, let alone pairs of years are almost also significant changes other than for the smallest of pacific islands with very low total populations. To quote from those who know: “Life expectancy statistics are almost never presented as interval estimates (i.e., with confidence bounds). For national-level populations, life expectancy is very sharply estimated. Except for the smallest countries, population size and deaths are large enough that the confidence intervals are so narrow as to be unhelpful, and are therefore omitted.”
ON June 1st 2019 the Guardian newspaper reported, quoting IPPR research, that “More than 130,000 deaths in the UK since 2012 could have been prevented if improvements in public health policy had not stalled as a direct result of austerity cuts, according to a hard-hitting analysis to be published this week.” Prevented, of course, means, delayed and people could have lived a little longer. Had they each just lived a few months longer life expectancy in the UK would not now be falling.
Earlier Lu Hiam and Martin McKee, writing in the BMJ, had explained that more recent data than that released by the ONS to date had revealed that “Life expectancy in the UK has fallen, again. The trend that started in 2010-2011 has worsened. The total fall in life expectancy compared to 2015 projections is 13 months for men and 14 months for women.”
Infant mortality has also been rising steadily now in the UK and has stopped falling in the USA for for some time now. Thankfully this is not the reason why the life expectancy figures are falling in both countries but infant mortality rates, although now continuously rising in the UK, are still historically low.
Health Inequalities in Trump’s America and Brexit Britain
25th June 2019, 17:30 to 19:00, Town Hall, Durham, Jonathan Metzl & Danny Dorling
Why do people vote for politicians and rhetoric which actually puts their own lives at risk and what can be done about it? Join Jonathan Metzl and Danny Dorling to consider how politics in the US and UK is failing the people who most need help.
In his latest book ‘Dying of Whiteness’ Jonathan M. Metzl travels across America’s heartland seeking to better understand the politics of racial resentment and its impact on public health. Despite Trump’s promises to restore greatness to white America, Metzl’s systematic analysis of health data dramatically reveals they did just the opposite: these policies made life sicker, harder, and shorter in the very populations they purported to aid.
In contrast, Danny Dorling’s work considers key inequality issues in the UK including politics, housing, education and health. In the book ‘Peak Inequality’ he explores what the future holds for Britain, as attempts are made to defuse the ticking time bomb while we simultaneously try to negotiate Brexit and react to the wider international situation of a world of people demanding to become more equal.

In a time of austerity: we pray
A PRAYER IN A TIME OF AUSTERITY
1000s of UK citizens currently suffering sanctions,
which are imposed with the maximum use of the media
to blame decent people for their own unemployment and poverty;
for the millions of UK citizens who are suffering under
unmanageable debts due to high rents, the council tax, the
caps and cuts in social security
imposed by Parliament, made worse by sanctions.
We pray too for those in power, and seeking power, that they may find;
The courage to work for and implement social and economic justice,
The will to build a well-being state on the ashes of the welfare state
in which rich and poor and Parliament are in solidarity with each other.
The policies to ensure that no one will have to choose between
heating or eating,
the rent or the streets,
life or death
due to the unjust enforcement of debts
against inadequate incomes,
or no incomes at all,
due to a sanction.
In the name of Jesus Christ,
Amen
[a prayer penned by the Reverend Paul Nicolson. Reproduced here with permission from N. Paynter, In the Gift of this New Day: Praying with the Iona Community (Glasgow: Wild Goose Publications, 2015). It was first said outside the DWP Headquarters, Westminster, 19 March 2015, at a demonstration called by UNITE Community, with the relatives of people who had died after their income was stopped by a job centre sanction.]
July 1, 2019
The Oxfordshire ‘Expressway’, local and European elections, and the Conservative leadership race.
On the evening of 17 June at 7.30pm Oxford Civic Society held a public debate in the Assembly Room of the Town Hall on the effect on Oxfordshire of the planned Expressway and related issues. Cllr. Ian Hudspeth, Conservative leader of Oxfordshire County Council agreed to speak in favour of the Expressway. Danny Dorling opposed him and suggested other solutions. The debate was held in the context of the largest upheaval in British politics to have occurred for many decades. An audio recording is available here:
A debate organised by Oxford Civic Society, chaired by Clive Booth and held in Oxford Town Hall on June 17th 2019 .
The debate was held as the political shape of the UK was quickly changing. A great deal had happened in the month of May 2019. Given what is currently occurring in British politics and that every English political party other than the Conservatives opposes the ‘expressway’ it is unlikely to ever be built.
On May 2nd 2019 local elections were held in England and Northern Ireland. The Conservatives lost 1,330 councillors that day, taking their national tally to only 3,564. This was a loss of almost a quarter of all their local politicians (24% of all their councillors). However, quite a few of the losses were to candidates who had in the very recent past been Conservative councillors and who were now presenting themselves as if they had suddenly become Independent.
Labour lost 84 of their councillors, or almost 16 times fewer than the Conservatives. If you double and double and double and double and then double again the number of Labour losses, you get to the number of seats the Conservatives saw disappear from their control. Despite the large difference between 1,330 and 84, on May 3rd 2019 the BBC presented this news as “Voters have delivered a stinging rebuke to the two main parties at Westminster in the local elections in England…”
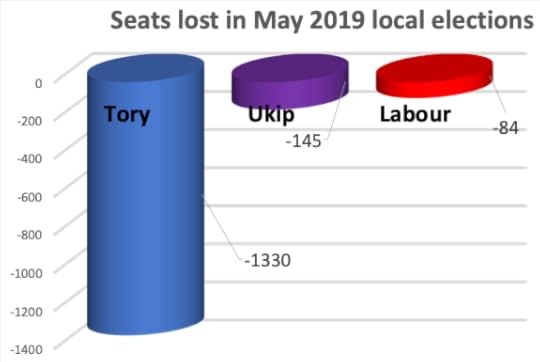
How the BBC could have chosen to present the May 2019 local election losers
At those same local elections on May 2nd 2019, the United Kingdom Independence Party (UKIP) lost 145 of their far fewer councillors reducing their total number across all of the UK to 31. In other words UKIP lost 82% of all their elected representatives. The BBC did not say much about that. A graph of how the BBC could have presented these three figures is shown above, drawn in typical BBC style with unnecessary three dimensional columns and garish colours.
The local elections and their reporting set the context for the then upcoming European Parliamentary elections that were held on Thursday 23rd May 2019. To understand them requires stepping back in time a few months; and knowing a little of the influence of the University of Oxford alumni on England’s politics.
Calls for Theresa May to resign mounted from within her own party following the disastrous May 2019 local election results which were the worst recorded since 1995. The local election results in 1995 preceded the ending of 18 years of Conservative rule from 1979 to 1997. Upon resigning on March 24th 2019, Mrs May announced that she was leaving “…with enormous and enduring gratitude, to have had the opportunity to serve the country I love”. By ‘country’ she meant the United Kingdom of Great Britain and Northern Ireland – a coalition of three countries and a province that had become increasingly divided both from the English elite and within England itself.
One example of the rise in division was a private company called ‘The Brexit Party Limited’ that was incorporated with Companies House on 23 November 2018. Its existence was formally announced on 20 January 2019 by the former very prominent UKIP economics spokesperson Catherine Blaiklock. Catherine served as the Brexit Party’s initial leader. As an undergraduate, Catherine had studied Geography at Christchurch College Oxford, not long after Theresa May read the same subject at St. Hugh’s College Oxford. We may well be at the end of the ‘Oxford era’, the time when politicians educated at Oxford continued to dominate the agenda during the Brexit fiasco. Brexit was brought about by David Cameron and his Oxford University (and Eton) dominated Cabinet.
Catherine Blaiklock resigned as leader of the Brexit party on March 20th 2019 when it was revealed that she had made a series of tweets that were found by the campaign group Hope not Hate to be offensive. These included retweeting suggestions that a “white genocide” was underway and a tweet ‘…from December 2017, [which] recounted being at a north London tube station, and read: “8 people waiting for lift, 5 Muslim girls, 1 black, 1 other Asian Chinese, 1 white. Immediately outside saw a drug deal take place. Looked like Turkey.” She also retweeted a message by the US radio show host and former state congressman Joe Walsh saying: “Haiti is a shithole and it’s run by blacks.”’ There are more allegations in the original press reports, see: [Peter Walker, Leader of Nigel Farage’s party resigns over anti-Islam messages: Catherine Blaiklock sent racist posts and retweeted those of far-right figures before joining Brexit party, The Guardian, 20 March 2019.
Theresa May resigned the day after the European Parliamentary elections were held and two days before the results were announced. For many weeks the opinion polls had been going very badly for her, and they got worse. The bar graph below shows the average proportion of voters, each month, from May 2015 to May 2019, who said they would support either UKIP or the Brexit Party at a general election. Support for UKIP had fallen away shortly after 2016. A rump of UKIP party activists kept plodding on, but in early 2019 most of its key supporters, such as Nigel Farage, and its financial backers, moved their alliance to Catherine Blaiklock’s new Brexit party and by doing so secured an unprecedented poll rise in April and May 2016 by painting themselves as being ‘new’.
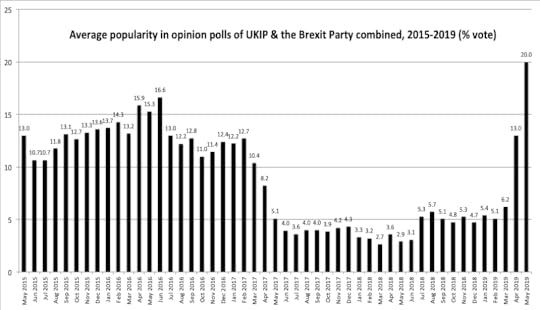
Combined support for UKIP and the Brexit party combined, proportion of those polled in all polls each months who said they would vote for them, 2015-2019
When the European election results arrived the Brexit Party gained 5 more seats than the 24 UKIP had won in 2014 at the last European elections, increasing their share of seats by 20%. In contrast, the Liberals (a pro Remain party) increased their seat share by 1,500%! Labour (who were being ambiguous over Brexit) lost 50% of their seats; the Greens gained 4 seats, a rise of 233% on their 2014 performance; the Conservatives lost 15 seats, almost 80% of what they had held; the Scottish National Party gained one seat (a 50% rise in seats for them), Plaid Cymru held their one seat in Wales, a new political party called ‘Change UK’ changed nothing; and, in Northern Ireland, a pro-leave Unionist lost his seat to a pro-remain Alliance candidate. The Alliance party saw their votes in Northern Ireland rise from 44,000 in 2014 to over 170,000 in 2019; a rise of over 400%.
Table: Seats held by each UK political party in the European Parliament (2014-2019)
2019 EU seats change from 2014
The Brexit Party / UKIP 29 (+5)
Liberal Democrat 16 (+15)
Labour 10 (-10)
Greens 7 (+4)
Conservative 4 (-15)
Scottish National Party 3 (+1)
Plaid Cymru 1 (-)
Democratic Unionist Party 1 (-)
Sinn Féin 1 (-)
Alliance Party 1 (+1)
Ulster Unionist Party 0 (-1)
Change UK 0 (-)
Although it was not reported as such, in the UK, European elections resulted in the largest fall in support for parties to the right of the main European Conservatives (the EPP block) to be found anywhere in Europe. The Conservatives, UKIP and the Unionists had held 45 seats in 2014; in 2019 they secured only 34. That drop of 11 was almost a quarter of their 2014 seats.
Similar trends were happening elsewhere in Europe, just not as strongly as in the UK. Before the June 5th national elections in Denmark, a combination of centre-left, green-left, liberals and radical-left parties appeared set to make the most gains given recent opinion polls. These were the European elections taking place after the Local elections. Similar to how badly the British Conservatives were now performing, the Danish ‘radical right’ (Dansk Folkeparti) were now on track for their worst results in over twenty years, according to polls taken there on or just before June 3rd.
In Germany, the far-right Alternative für Deutschland (AfD) suffered losses in the European Parliamentary elections. The far-right Golden Dawn in Greece had been doing badly for some time; but, most important of all, many European far-right parties, such as the Northern League in Italy (which won 34% of the 2019 EU vote in Italy in May 2019) have now changed their stance on the EU and are no longer pro-EU-exit. In France, the greatest surprise was how well the Greens did. In Spain, it was the success of the socialists which was the greatest shock.
When I was first writing these words, on June 3rd 2019, there were an unlucky 13 candidates in the race to be the next leader of the Conservative Party. A Conservative government minister, James Brokenshire, who was not standing to be leader, urged ‘no hope candidates’ to pull out saying “…It doesn’t reflect on your talent or ability to influence the direction of our party now and in the future … It’s just the overriding need to get our new leader in place as quickly as possible.” None of the 13 appeared willing, at least initially, to take his advice. The Table here gives the names of the leadership candidates, the subject they studied at University, where they went to University, and for those that went to the University of Oxford, the year in which they matriculated, or went-up (in other words turned up).
Candidate
First Degree
University (or Oxford college)
matriculated
1 James Cleverly
Hospitality Management
Thames Valley University
2 Michael Gove
English
Lady Margaret Hall {Oxford }
1985
3 Sam Gyimah
PPE
Somerville { Oxford }
1995
4 Matt Hancock
PPE
Exeter {Oxford}
1996
5 Mark Harper
PPE
Brasenose {Oxford}
1988
6 Jeremy Hunt
PPE
Magdalen {Oxford}
1985
7 Sajid Javid
Economics
University of Exeter
8 Boris Johnson
Classics
Balliol {Oxford}
1983
9 Andrea Leadsom
Political Science
University of Warwick
10 Esther McVey
Law
Queen Mary University
11 Kit Malthouse
Politics & Economics
University of Newcastle upon Tyne
12 Dominic Raab
Law
Lady Margaret Hall {Oxford}
1993
13 Rory Stewart
PPE
Balliol {Oxford}
1992
The final two to be presented to the Tory faithful to decide between were candidates 6 and 8, Hunt and Boris, Magdalen and Balliol, PPE and Classics, admitted “once tried cannabis” verses claims did not try cocaine: “I sneezed and so it did not go up my nose“. A full list of all the confessions on drug taking by the various candidates is available in many media outlets but is probably incomplete. Note that more candidates did admit to taking drugs than the number who admitted taking the compound “PPE” while at Oxford.
So, what will happen next? No one knows, but we can follow the polls.
We know that the UKIP / Brexit party vote can easily collapse at any time; but when it does its supporters will tend to revert back to the Tories. The line graph shown next, labelled: “Conservative Lead over Labour in UK opinion polls, May 2015 to September 2018 ” demonstrates how the Conservative lead over Labour rose above 5% for much of 2015, fell below that in spring 2016, but then soared up in the summer and autumn of 2016 to reach an almost 20% point lead in April 2017. Theresa May called a general election, support for her plummeted during May 2017 and June 2017 and she failed to securing a working majority, so was forced to form a very weak alliance with the Democratic Unionist Party (DUP). Since then her showing over Labour never reached a 3% monthly lead ever again.

Conservative lead over Labour in the polls, May 2015 to September 2018 (monthly averaged poll ratings)
The most recent continuation of the trend is shown in the next timeline graph below, labelled “Conservative Lead over Labour in UK opinion polls, September 2018 to May 2019”. It highlights the death spiral her party was falling into after the autumn of 2018 when she danced on the stage of the Tory party conference. By May 2019 the Conservatives were 6.3% below Labour in the polls and falling. The recent rise of the Liberal Democrats is likely to be fleeting; they are a party from two centuries ago formed to argue over issues of great important to the aristocracy and industrialists of that time. Brexit only gives the Liberals a short term popularity. In contrast, the Greens are likely to rise in support as the planet warms up further. UKIP and the Brexit Party will crash away again just as the British National Party and the National Front did many decades before them. Labour will become increasingly relevant in an era where most people have only precarious jobs. And the Conservatives? The Conservatives, appear destined to split into two parties. The only question is when.
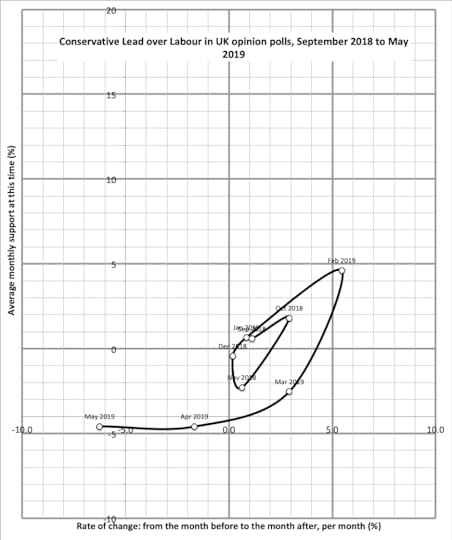
Conservative lead over Labour in the polls, September 2018 to May 2019 (monthly averaged poll ratings)
References
https://www.bbc.co.uk/news/uk-politics-48091592
https://twitter.com/robfordmancs/stat...
https://twitter.com/EuropeElects/stat...
https://news.sky.com/story/tory-leade...
For a PDF file of the full article and a link to where it is published on-line please click here.
Danny Dorling's Blog

- Danny Dorling's profile
- 96 followers

