
The smaller generation to come – worldwide
Here’s some good news for the planet: the human population is set to peak and stabilise, not rising much above 9.7 billion, the total that it will reach around the year 2050, according to the latest UN figures. Danny Dorling, Halford Mackinder Professor of Geography at Oxford University, explains how this works, and why it is something to celebrate.
On Monday 17 June 2019 the United Nations revealed momentous news. The world did not notice, but soon it will. The headline of their own report read “9.7 billion on Earth by 2050, but growth rate slowing”.
A day earlier the UN projection for the year 2050 had been nearer 9.8 billion, and the projection for 2100 had been 11.2 billion people. Something very significant had occurred.
Some parts still growing, but…
The United Nation’s report concentrated on where there will still be the most growth. To quote: “India is expected to show the highest population increase between now and 2050, overtaking China as the world’s most populous country, by around 2027. India, along with eight other countries, will make up over half of the estimated population growth between now and 2050. The nine countries expected to show the biggest increase are India, Nigeria and Pakistan, followed by the Democratic Republic of the Congo, Ethiopia, Tanzania, Indonesia, Egypt and the United States of America.”
But their report continued: “The population size of more and more countries is actually falling. Since 2010, 27 countries or areas have seen a drop of at least one per cent, because of persistently low fertility rates. Between now and 2050, that is expected to expand to 55 countries which will see a population decrease of one per cent or more, and almost half of these will experience a drop of at least 10 per cent.”
Bellwether 18-year-olds
The UN did not mention their new 2100 prediction in this particular press release. The first graph below shows the number of people the UN estimate have been (and will be) aged 18 each year from 1950 until 2100. The future they predict is remarkably smooth.
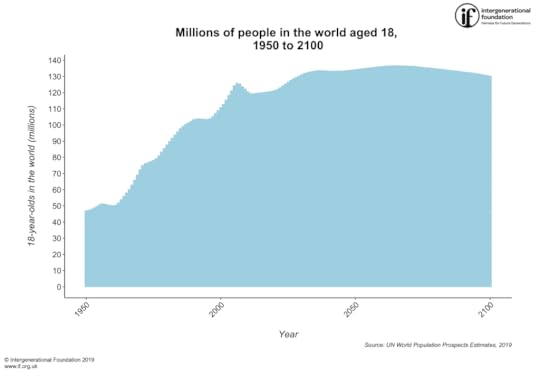
The number of 18 year olds in the world – UN world population prospects estimates, 2019 (millions of people aged 18, 1950 to 2100)
However, some reporters noticed that something was very new: “The world’s population is slowing down and could stop growing – or even begin decreasing – by 2100” one noticed, before adding that “…[UN population] division director John Wilmoth said this outcome ‘is not certain and in the end the peak could come earlier or later, at a lower or higher level of total population.’”
However, John’s central projection for the year 2100 is now 10.9 billion people, 300 million fewer than the UN said they expected, the day before.
Even fewer babies – but longer lives
Human population growth is slowing dramatically and it is slowing because people are having fewer and fewer babies as compared to their parents – everywhere – without exception.
More importantly, they are having fewer than we thought they would have a few years ago when the fertility rates were already reducing dramatically and unprecedentedly. Our species has never – ever – had so few children.
The reason why the total human population of the planet will keep on growing for 50, or 60 or 70 years (but almost certainly not for 80 years) is because people are living longer. It is now no longer because we are having more children.
If people in a particular place live for 80 years rather than 40 (on average), they double the number of people found in that place at any one time without a single additional baby needing to be born.
The human species is ageing – rapidly. More rapidly than we thought it was by Monday 17 June 2019! And this is wonderful news because it is caused by fewer people dying when young and healthcare for the elderly improving.
Tell-tale peaks for 18-year-olds
The next graph below shows the annual change in the number of 18-year-olds now predicted to occur each year and the number that did occur each year in the last 68 years. The peaks in the graph below occurred in 1955, 1970, 1985 and 2005, with the next predicted to be in 2025. The length of time between these peaks in years is 15, 15, 20 and 20.
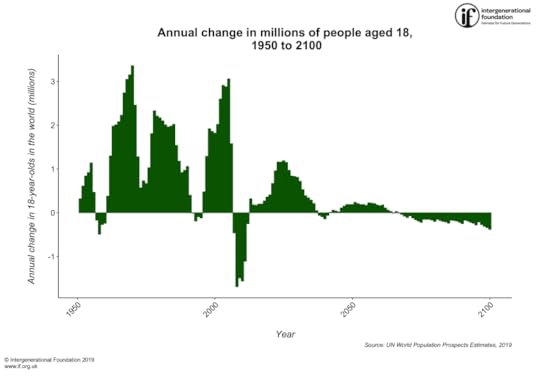
The number of 18 year olds in the world – UN world population prospects estimates, 2019 (annual change in millions of people aged 18, 1950 to 2100)
It is the trend in the corrections to the UN revisions that matters most. In the 2011 estimates the UN demographers suggested that 10 billion was most likely by 2100. The subsequent 2013, 2015 and 2017 revisions updated that estimate to just over 11 billion. But now the 2019 revision is reducing that estimate again.
Six years ago, on 11 June 2013, I published a book titled Population 10 billion in which I made a guess that the UN were getting it wrong. It was just a guess, but it turned out to be right. The reason they were making this mistake, I said, is that they had failed to notice an echo of a baby boom. They were using very current fertility estimates to project forwards, unaware that fertility at the start of this current century was slightly and unusually elevated – due to so many people turning 18 around the year 2005.
(Non-robotic) implications for smaller generations
The slowdown in the growth and then the fall to come in young adults worldwide raises all kinds of issues. In general, smaller generations have been more powerful generations in the past. Their bargaining position is better. Each child becomes more precious.
But in strange times like these, people begin to try to imagine all kinds of new scenarios. However, “artificial intelligent” robots are not going to replace the young. The reason why is simple. We are an animal, evolved to be acutely aware of just how much attention we are or are not getting from others of our species. That is how for millennia those of us that survived, survived. We were cared for, and cared for our young. Most of us are acutely aware of even the smallest slight we receive, the mildest of ignoring. Most of us warm with happiness when we are praised by those we love. Emulating humans to fool other humans with machines is a fools’ game because it is trying to compete with what drove our evolution. Instead, robots are best used to undertake repetitive tasks that our inquisitive nature hates.
Predictions in a precarious world
What is likely to happen next? Look again at the graph above of the future change in the number of 18-year-olds predicted to carry through to the year 2100. Note how the UN prophesies a rapid move towards stability. To achieve that, every 18-year-old has to have slightly more than two children each (because a few babies will still die even in the most utopian of futures).
But then look at what has happened most recently. Look at the falls between 2007 and 2013 in the graph above and note how that plummeting below the line almost exactly fits the gap that can be seen in the time series between 1991 and 1996, around 17 years earlier.
Young adults in future are unlikely to conform to what the UN demographers currently predict. If we manage to avoid world war, famine, pandemic and severe prolonged global economic crisis, then young people will continue to have fewer and fewer children each – for some time to come. It is what women want. And more and more women now get what they want.
Change in change
Finally, if you find it hard to believe that the finest demographic minds the world can muster might still be making a mistake, even though they now are at least moving their predictions down toward what reality is telling them, look at the last graph in this series of three, below. The graph shows the “change in change” each year in 18-year-olds.
This is just one change figure subtracted from another. To give an example in 2006, 2007 and 2008 the number of 18-year-olds thought to be alive worldwide on 1 July each year was 125.850, 125.386, and 123.692 million respectively. The change between those three numbers was -0.46 and -1.69 million: the population was falling, and the change in change between those two numbers, the rate of deceleration or acceleration, was -1.23 million – a rapid deceleration (or acceleration in the rate of fall if you want to see it that way).
The final graph below shows all of those “change in change” figures derived from the very latest UN population estimates for the world. Each great deceleration – the troughs in 1955, 1972 and 2007 – has been greater in magnitude than the last.
Now look at what the UN think will happen in future and then start planning for even fewer 18-year-olds than they are now suggesting there will be. Because they are still ignoring this clear downwards trend.
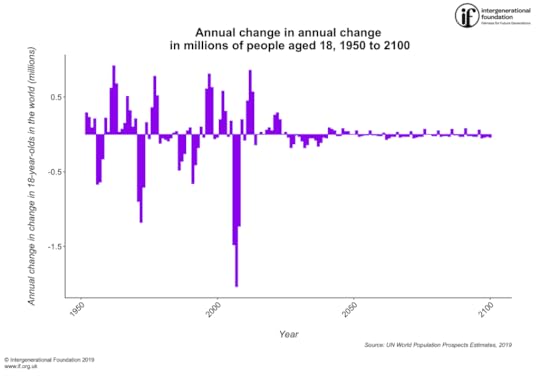
The number of 18 year olds in the world – UN world population prospects estimates, 2019 (annual change in change,,millions of people aged 18, 1950 to 2100)
Web links:
https://news.un.org/en/story/2019/06/...
https://eu.usatoday.com/story/news/na...
https://population.un.org/wpp/
http://www.dannydorling.org/books/10b...
http://www.dannydorling.org/books/dem...
Why Demography Matters
Danny Dorling & Stuart Gietel-Basten
Why Demography Matters?
http://www.dannydorling.org/books/dem...
For a PDF for this article and an on-line link to the original posting click here.
A talk to school children in London the day after the UN released its latest biannual global population estimates: demography and what else we worry about in the very near future…
Danny Dorling speaking at Channing Senior School and to pupils from neighbouring schools, London, Archway, June 20th 2019
World population – United Nations 2019 revision – people aged 18, estimated and projected
18 year olds
thousands
millions
Change
Change in Change
1950
47 028
47
1951
47 351
47
0.32
1952
47 963
48
0.61
0.29
1953
48 802
49
0.84
0.23
1954
49 725
50
0.92
0.09
1955
50 863
51
1.14
0.21
1956
51 332
51
0.47
-0.67
1957
51 165
51
-0.17
-0.64
1958
50 673
51
-0.49
-0.33
1959
50 403
50
-0.27
0.22
1960
50 164
50
-0.24
0.03
1961
50 547
51
0.38
0.62
1962
51 848
52
1.30
0.92
1963
53 831
54
1.98
0.68
1964
55 839
56
2.01
0.03
1965
57 915
58
2.08
0.07
1966
60 142
60
2.23
0.15
1967
62 879
63
2.74
0.51
1968
65 933
66
3.05
0.32
1969
69 085
69
3.15
0.10
1970
72 444
72
3.36
0.21
1971
74 906
75
2.46
-0.90
1972
76 187
76
1.28
-1.18
1973
76 758
77
0.57
-0.71
1974
77 489
77
0.73
0.16
1975
78 158
78
0.67
-0.06
1976
79 190
79
1.03
0.36
1977
81 000
81
1.81
0.78
1978
83 330
83
2.33
0.52
1979
85 544
86
2.21
-0.12
1980
87 711
88
2.17
-0.05
1981
89 811
90
2.10
-0.07
1982
91 823
92
2.01
-0.09
1983
93 781
94
1.96
-0.05
1984
95 762
96
1.98
0.02
1985
97 778
98
2.02
0.04
1986
99 315
99
1.54
-0.48
1987
100 490
100
1.18
-0.36
1988
101 409
101
0.92
-0.26
1989
102 382
102
0.97
0.05
1990
103 441
103
1.06
0.09
1991
103 842
104
0.40
-0.66
1992
103 835
104
-0.01
-0.41
1993
103 648
104
-0.19
-0.18
1994
103 563
104
-0.09
0.10
1995
103 438
103
-0.12
-0.04
1996
103 921
104
0.48
0.61
1997
105 212
105
1.29
0.81
1998
107 131
107
1.92
0.63
1999
108 995
109
1.86
-0.06
2000
110 814
111
1.82
-0.04
2001
112 832
113
2.02
0.20
2002
115 431
115
2.60
0.58
2003
118 338
118
2.91
0.31
2004
121 214
121
2.88
-0.03
2005
124 273
124
3.06
0.18
2006
125 850
126
1.58
-1.48
2007
125 386
125
-0.46
-2.04
2008
123 692
124
-1.69
-1.23
2009
122 202
122
-1.49
0.20
2010
120 638
121
-1.56
-0.08
2011
119 525
120
-1.11
0.45
2012
119 270
119
-0.25
0.86
2013
119 589
120
0.32
0.57
2014
119 765
120
0.18
-0.14
2015
119 939
120
0.17
0.00
2016
120 140
120
0.20
0.03
2017
120 344
120
0.20
0.00
2018
120 611
121
0.27
0.06
2019
120 972
121
0.36
0.09
2020
121 379
121
0.41
0.05
2021
122 050
122
0.67
0.26
2022
123 013
123
0.96
0.29
2023
124 176
124
1.16
0.20
2024
125 341
125
1.16
0.00
2025
126 532
127
1.19
0.03
2026
127 685
128
1.15
-0.04
2027
128 655
129
0.97
-0.18
2028
129 494
129
0.84
-0.13
2029
130 327
130
0.83
-0.01
2030
131 133
131
0.81
-0.03
2031
131 849
132
0.72
-0.09
2032
132 382
132
0.53
-0.18
2033
132 775
133
0.39
-0.14
2034
133 116
133
0.34
-0.05
2035
133 406
133
0.29
-0.05
2036
133 617
134
0.21
-0.08
2037
133 665
134
0.05
-0.16
2038
133 605
134
-0.06
-0.11
2039
133 510
134
-0.09
-0.04
2040
133 366
133
-0.14
-0.05
2041
133 308
133
-0.06
0.09
2042
133 319
133
0.01
0.07
2043
133 384
133
0.06
0.05
2044
133 424
133
0.04
-0.02
2045
133 447
133
0.02
-0.02
2046
133 554
134
0.11
0.08
2047
133 706
134
0.15
0.04
2048
133 893
134
0.19
0.04
2049
134 080
134
0.19
0.00
2050
134 267
134
0.19
0.00
2051
134 503
135
0.24
0.05
2052
134 713
135
0.21
-0.03
2053
134 907
135
0.19
-0.02
2054
135 095
135
0.19
-0.01
2055
135 269
135
0.17
-0.01
2056
135 497
135
0.23
0.05
2057
135 714
136
0.22
-0.01
2058
135 920
136
0.21
-0.01
2059
136 105
136
0.18
-0.02
2060
136 264
136
0.16
-0.02
2061
136 441
136
0.18
0.02
2062
136 547
137
0.11
-0.07
2063
136 603
137
0.06
-0.05
2064
136 632
137
0.03
-0.03
2065
136 627
137
-0.01
-0.03
2066
136 655
137
0.03
0.03
2067
136 644
137
-0.01
-0.04
2068
136 599
137
-0.04
-0.03
2069
136 522
137
-0.08
-0.03
2070
136 410
136
-0.11
-0.03
2071
136 338
136
-0.07
0.04
2072
136 213
136
-0.12
-0.05
2073
136 050
136
-0.16
-0.04
2074
135 861
136
-0.19
-0.03
2075
135 638
136
-0.22
-0.03
2076
135 490
135
-0.15
0.07
2077
135 343
135
-0.15
0.00
2078
135 193
135
-0.15
0.00
2079
135 019
135
-0.17
-0.02
2080
134 820
135
-0.20
-0.02
2081
134 674
135
-0.15
0.05
2082
134 498
134
-0.18
-0.03
2083
134 303
134
-0.20
-0.02
2084
134 091
134
-0.21
-0.02
2085
133 850
134
-0.24
-0.03
2086
133 684
134
-0.17
0.07
2087
133 509
134
-0.18
-0.01
2088
133 319
133
-0.19
-0.01
2089
133 101
133
-0.22
-0.03
2090
132 850
133
-0.25
-0.03
2091
132 678
133
-0.17
0.08
2092
132 483
132
-0.19
-0.02
2093
132 267
132
-0.22
-0.02
2094
132 023
132
-0.24
-0.03
2095
131 747
132
-0.28
-0.03
2096
131 533
132
-0.21
0.06
2097
131 266
131
-0.27
-0.05
2098
130 957
131
-0.31
-0.04
2099
130 617
131
-0.34
-0.03
2100
130 240
130
-0.38
-0.04


Danny Dorling's Blog

- Danny Dorling's profile
- 96 followers

